English (pdf)
 Article in xml format
 Article references
 Send this article by e-mail
 Cited by SciELO
  Similars in
SciELO
Similars in
SciELO 
 Permalink
Introduction
Through a narrow security lens, that of absence of physical threats, Portugal is considered relatively safe. According to the Institute for Economics and Peace, Portugal is ranked as the sixth most peaceful country in the world.2 Concerns with crime and terrorism are one of the country’s least relevant issues.3 In fact, in 2020, 6.3% of people in Portugal reported they lived in areas with crime, violence, or vandalism, contrasting with 10.8% in the European Union (EU), according to the Survey for Income and Living Conditions.4 Still, 15.8% of Portuguese residents report they have felt unsafe or very unsafe walking alone after dark, and more than 83% believe a strong government to ensure safety is important, according to data from the European Social Survey (ESS).5
One can extend this statement in two directions. On the one hand, the extent to which security hinges on this narrow definition related to crime is questionable. On the other hand, even if the average perception of security in a given society is high, it may hide considerable heterogeneity amongst different individuals, depending on their socioeconomic position. In this short paper, we extend the analysis of security in Portugal in these two directions.
Humankind entered the 21st century with a revival in the interest on human security6. According to the prominent economist and moral philosopher, this revival is due to both positive and negative reasons. On the negative side, Sen identifies the emergence of ‘newly developed dangers and adversities’, due to public health concerns, civil wars, and genocides.7 While Sen was writing these lines at the turn of the century, it is fair to say that the problems have been accentuated in the last two and a half decades.8 Currently, humankind is slowly moving out of a pandemic, and the European land is home to a war of aggression unseen in the recent past.
On the positive side, Sen reckons the ‘enhanced possibility […] to put our efforts and understanding together to achieve a better-coordinated resistance to the forces that make human survival so insecure’.9 Indeed, scientific advances in natural and social sciences enhance the opportunities to deal with these challenges. But what, then, is human security? Sen posits that, while human security is related with the human development and human rights approaches to the analysis of societal achievements, it is a distinct concept.10
The concept of human security encompasses several distinct elements. First, it focuses on individual human lives, as opposed to, e.g., the military concept of national security. Moreover, with regards to this latter, human security expands the set of threats considered, to include food, health, political, and environmental security, amongst others, and includes ‘the construction of safeguards and opportunities for people’s strengths and aspirations’.11 Second,
it must include the analysis of society and social arrangements that improve security. Third, in contrast to the concept of human development (as put forward by Sen12), which aims at expanding positive freedoms, human security concentrates on downside risks. Concomitantly with this narrower focus, it ought to concentrate on the more elementary human rights, whereas human development covers the whole range of such rights.
Indeed, modern perceptions of security are multidimensional and interconnected,as they are closely linked to global threats, such as climate change, recurrent economic crises, or increased inequality, amongst others. Characterisation of human security calls, on the one hand, for both objective and subjective dimensions of the concept13 and, on the other hand, to the utilisation of individual-level information. Moreover, the individual dimension is crucial to study the interconnection between inequality and security.
An important related piece of research is Palma, Jardim and Monteiro, who provide an interesting analysis of security in Portugal, focusing on 20 municipalities.14 The authors collected their own data, relying on a random sample of 3757 individuals. Their survey has a lot of detail about the perception of crime rates of different kinds, which the authors relate to objective measures from official statistics. Palma, Jardim and Monteiro show that both objective and subjective measures of security are positively associated with subjective well-being in Portugal and it varies across different regions.15 Women, elderly individuals, and those with lower incomes are the ones with the most vulnerable sense of security. A decade later, these results remain unchanged, as we will show in greater detail in this analysis.
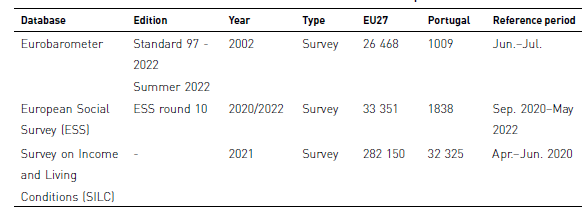
Acknowledging the importance of objective security measures, we will mainly focus on subjective security, since these can be critical in creating a sense of trust and confidence amongst citizens. We rely on individual-level data, from the ESS, the European Union Survey on Income and Living Conditions (EU-SILC), and the Eurobarometer, to analyse how safety and safety perceptions vary for different groups of the population, depending on their socio-demographic characteristics.16 Furthermore, we focus on a set of dimensions that combine the above theoretical considerations about the concept of human security with data availability, namely: environment, income, food security, housing quality, and health.
This analysis is organized as follows. Section 2 analyses the heterogeneity of safety perceptions in Portugal and the objective crime rates, in parallel with other European countries. Section 3 looks at the environmental side of security. Section 4 onward focuses on security in living conditions, namely regarding income, food, housing, and health. Section 5 concludes.
Security, safety and crime
How much do we value safety?
Table 1 shows the share of respondents, from the European Union (EU27) and Portugal (PT), who have identified each of the 15 possible issues facing their countries as the most important, ordered by the prevalence in the EU27. Most residents in Europe identify the rising prices, inflation, and cost of living, followed by energy supply and the economic situation. Note that this data was collected after the COVID-19 pandemic and before the war caused by the invasion of Ukraine by Russia. In the last column, red (green) highlights the issues more (less) frequently mentioned by residents in Portugal, compared to the EU27 average. The concerns directly linked to safety, such as crime and terrorism, ranked 11 and 15, respectively, for the EU27. On average, only 6% and 2% of residents in Europe believe these are the most important issues facing their countries right now. In Portugal, these percentages drop to only 1%.
Table 1 > What do you think are the two most important issues facing the country now? European Union vs Portugal, 2020 (%)
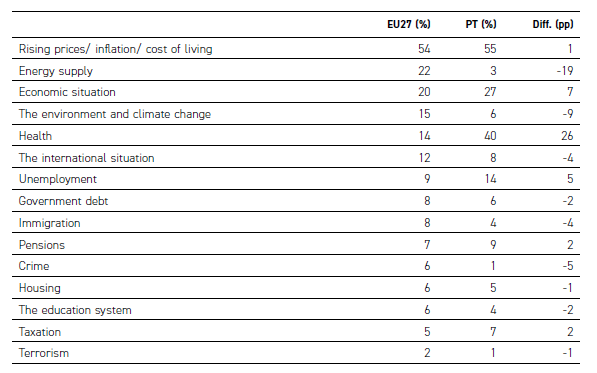
Source: Eurobarometer.17
These findings are consistent with the information collected by the EU-SILC.18 Fewer people in Portugal report living in an area with crime, violence, or vandalism, compared to the EU average (figure 1). In 2020, 6.6% of the Portuguese residents said they faced a problem of crime, violence, or vandalism in their neighborhood, compared with 10.7% for the EU27. This proportion has fallen progressively since 2013 (with peaks of 13.3% for Portugal and 14.1% for the EU27). In 2020, 6.7% of people in Portugal and 10.7% in EU27 reported this issue.
The figures presented so far necessarily average out important heterogeneity. As expected, for instance, people who live in cities reported these problems over three times more often than people in rural areas in 2020 (8.7% vs. 4.4%), as shown in figure 2. The same tendency is found in the remaining EU countries (16.3% vs. 5.8%). The relative advantage of Portugal, regarding safety, is larger in cities.
Is Portugal a safe country?
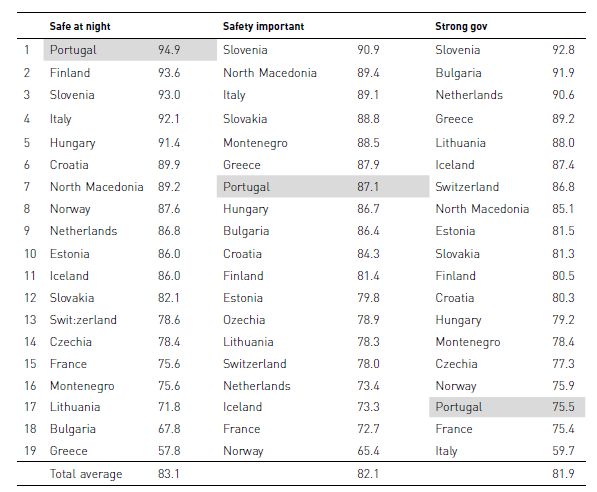
The 2022 ESS reports that 81% of people in the 19 European countries who responded to the survey believe it is essential to live in secure and safe surroundings.19 Table 2 shows that Portugal is above this average, with 87% of people stating secure and safe surroundings are important. The country for which this dimension is more important is Slovenia (90.9%) and the one for which it is less important is Norway (65.4%).
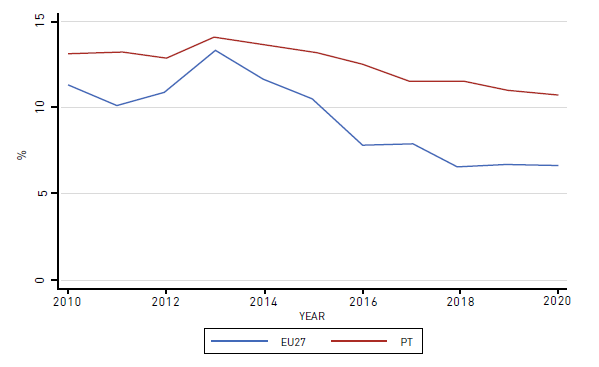
Figure 1 > Proportion of population who live in an area with crime, violence, or vandalism: Portugal vs European Union, 2010-20. Source: EU-SILC.20
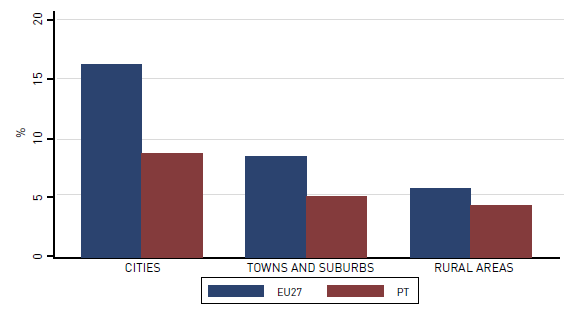
Figure 2 > Proportion of population who live in an area with crime, violence, or vandalism: by degree of urbanization, Portugal vs European Union, 2020. Source: EU-SILC.21
Another question related to security perceptions included in the 2022 ESS is whether people believe it is important that the government is strong and ensures safety.22 For countries like Slovenia and Greece, there appears to be a positive correlation between attributing importance to living in secure and safe surroundings and expecting the government to play an active role in ensuring it. In countries like Italy and Portugal, in turn, the correlation seems to be negative: inhabitants have higher concerns for safety, but less often believe this should be ensured by a strong government. Nonetheless, there is still a high percentage of people who consider the government should play a key role in ensuring safety in all the EU countries considered (from 92.8% in Slovenia to 59.7% in Italy). In Portugal, this share amounts to 75.5%.
Perhaps a more tangible measure of the degree of safety of a country is the question about whether respondents feel safe walking alone in their neighborhood after dark. Among the countries surveyed, Portugal is the one where more people feel safe (95%), followed by Finland and Slovenia. Greece, in turn, is where the population feels less safe walking alone in their neighborhood after dark (58%).
As might be expected, feeling safe walking alone after dark presents some heterogeneity between groups of the population. In all 19 countries currently included in the 2022 European Social Survey, women more frequently report feeling unsafe, when compared to men.24 In 2020, on average, this concern is reported by 30% of females and 12% of males. In Portugal, this gender gap is present, albeit smaller: 20.4% of women expressed the same concern, compared to 13.2% of men.
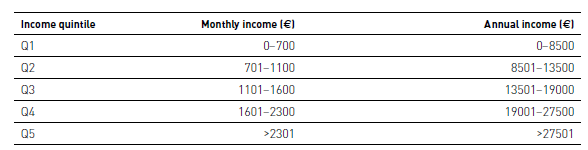
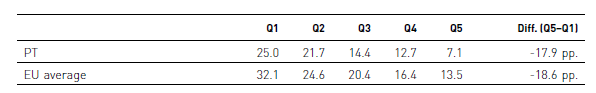
The position in the income distribution also matters for concerns about safety. Table 3 shows that 25% of people in the poorest quintile (Q1) report feeling unsafe, compared with 7.1% in the richest quintile (Q5)25. A similar difference is observed for the EU average (32.1% vs. 13.5%).
Table 3 > Proportion of people who feel unsafe walking alone in local area after dark, by income quintile, Portugal vs. European Union, 2020 (%)
Source: ESS.26
If we cross the gender and income dimensions, as shown in figure 3, it becomes apparent that women in all quintiles report more often they feel unsafe. The gender difference is smallest in the poorest quintile (Q1), where 26% of women and 24% of men feel unsafe. This compares to 10% of women and 5% of men in the richest quintile (Q5). Nevertheless, is in the second quintile Q2 that more women report feeling unsafe (27.8%), and where the gender gap is larger.
An interesting difference between Portugal and the remaining EU countries is that, in Portugal, eigth individuals aged 15-17 years old are the group who more often reports feelings of non safety walking on the street after dark (27% vs. 19% in the EU average). In most of the other countries, the oldest group (65+) has the highest prevalence of non safety feelings.

Figure 3 > Proportion of people who feel unsafe walking alone in local area after dark, by gender and income quintile, Portugal 2020. Source: ESS.27
These differences necessarily reflect different behaviours with regards to the frequency with which individuals are outside after dark. In particular, it is conceivable that those who report less safety also tend to go out less often. In that case, for equivalent behaviours, we would observe even higher levels of heterogeneity.
Figure 5 shows how this concern varies with the relation with the labor market. Unemployed people tend to express higher concern regarding this matter (> 40%), while employed people (10.4%) and students (5.5%) tend to feel less unsafe. Note that disabled people felt more unsafe than non-disabled people (31.9% vs. 17.1%).
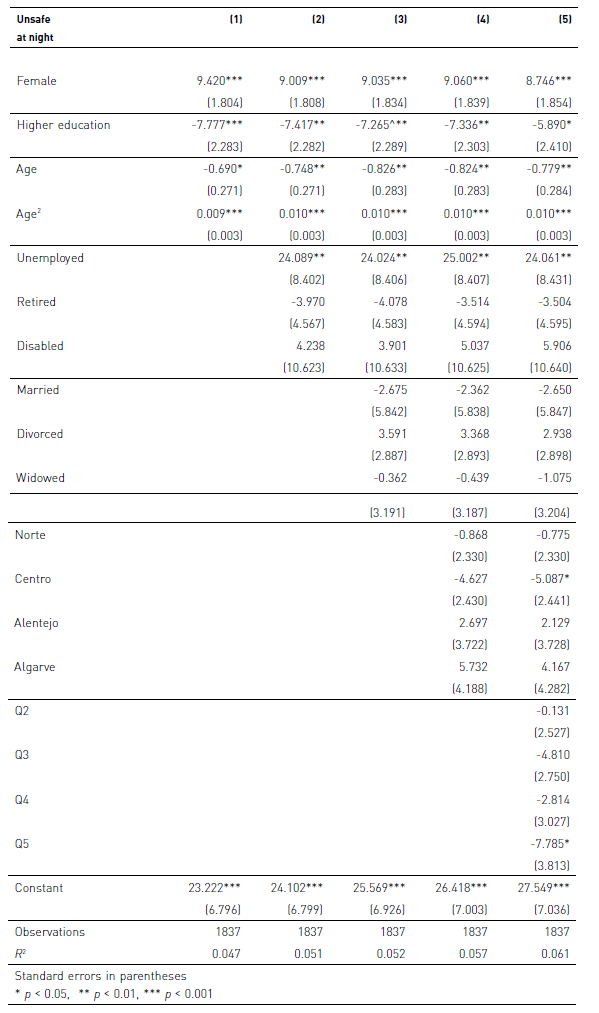
To further ascertain the relevance of the heterogeneity dimensions documented so far, we estimate the following linear probability model, where i stands for the respondent:
yi= a + βI Higher education + β2Higher educationi +
β3Agei + β4Agei + β5Unemploymenti + β6Retiredi +
β7Disabledi + β8Marriedi + β9Divorcedi + β10Widowedi +
β11Nortei + β12Centroi + β13Alentejoi + β14Algarvei +
β15Q2i + β16Q3i + β17Q4i + β18Q5i + εi
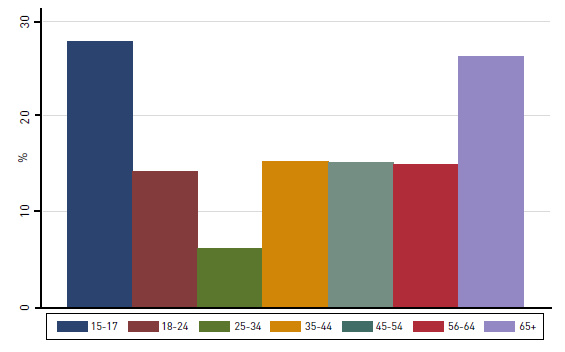
Figure 4 > Proportion of people who feel unsafe walking alone in local area after dark, by age group, Portugal 2020. Source: ESS.28
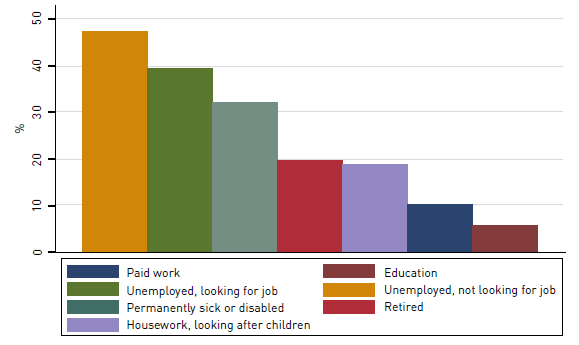
Figure 5 > Proportion of people who feel unsafe walking alone in local area after dark, by main activity. Source: ESS.29
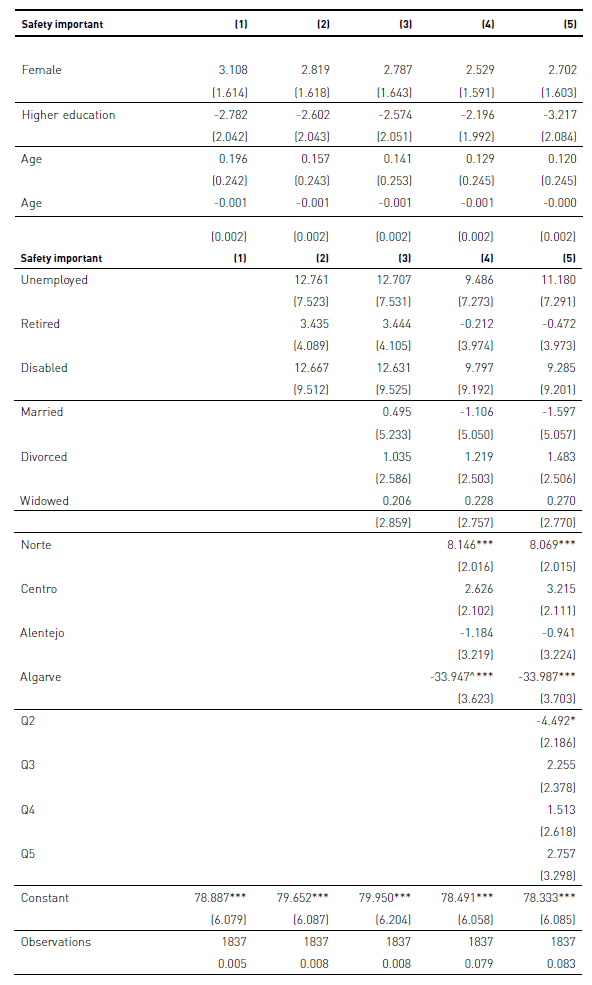
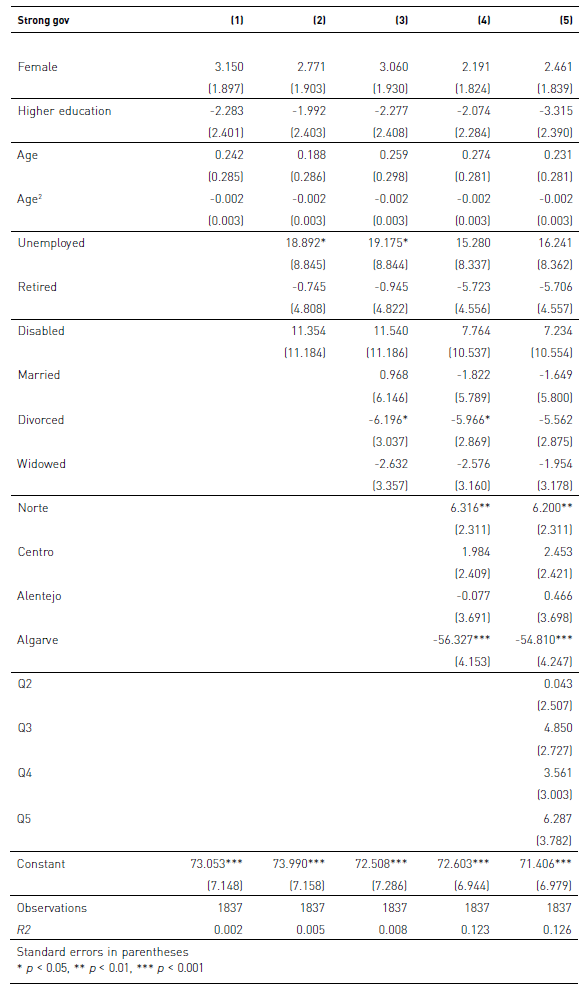
The binary dependent variables, yi will measure, in turn, whether respondents feel unsafe at night, whether they consider safety is important, and whether they consider that a strong government is important. Each outcome is regressed on a set of socio-demographic characteristics: gender, education level, age, labor market situation, legal marital status, region, and income quintile. All explanatory variables are binary, with the exception of age. Table 4 shows the results.
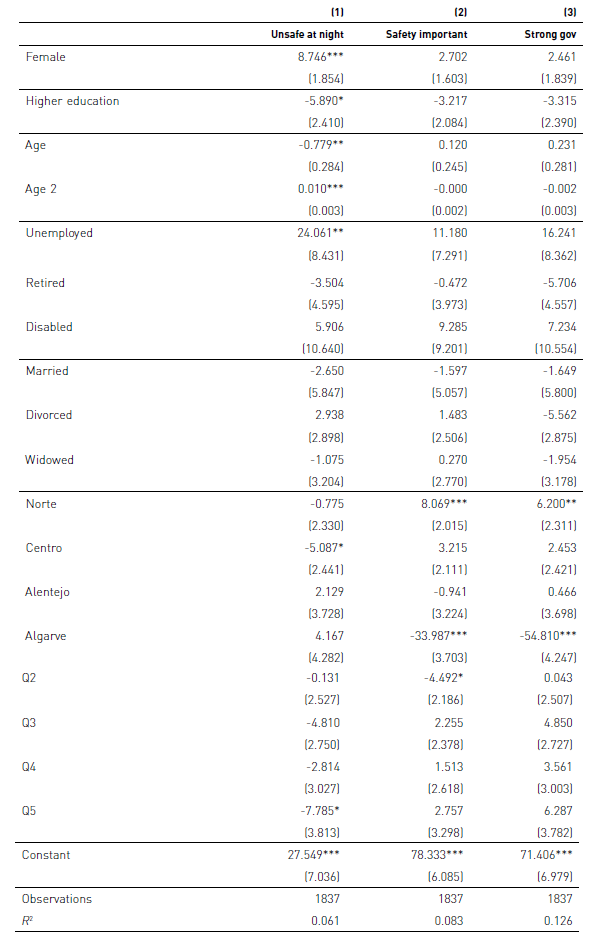
All in all, we find evidence that being female and being unemployed increases the probability of feeling unsafe walking alone in the local area after dark. Those who live in the center of Portugal (Centro) report feeling less unsafe. The richest people (Q5) also feel less unsafe.
Those who live in the northern (Norte) region tend to value more living in secure and safe sur roundings and want a stronger government to ensure safety than those in the Metropolitan Area of Lisbon. The opposite happens in Algarve, where people seem to value less the fact of living in a secure and safe place; they also attribute less importance to having a strong government ensuring safety.
To validate these results, we ran these regressions including covariates one by one. The results, which are unchanged with this robustness check, can be found in table 21, 22, and 23 of the Appendix.
Crime
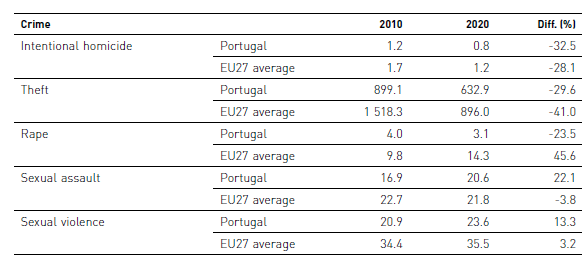
Until now we have been analysing perceptions of safety. Now we will look at the actual recorded crimes in Portugal and in the EU-27. Table 5 shows that the share of intentional homicides and thefts types offences declined, between 2010 and 2020, for both Portugal and EU-27. Crimes of sexual assault and sexual violence increased in Portugal by 22.1% and 13.3%, respectively, in this period.
While crimes such as homicides are measured objectively, other types of offences, in particular sex-related ones, depend a lot on the social norms, that determine the reporting behaviour of the potential victims. Therefore, when analysing these figures, it is important to keep in mind that they reflect the compound effects of prevalence and reporting.
Table 5 > Recorded offences by category, per hundred thousand inhabitants, Portugal vs EU27, 2010 vs 2020
Source: Eurostat.30
Environmental security
The environment is associated with physical and mental health and is prone to induce risks for individuals. Recall from figure 1 that the environment is referred to by 15% (resp., 6%) of individuals in the EU-27 (resp., Portugal) as an issue of concern. We now show the available statistics involving environmental risks.
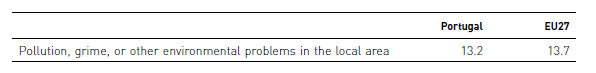
Pollution Smoke, dust, unpleasant smells, or polluted water can be a real danger to health and security. Around 13.2% of the population in Portugal reports problems in the household caused by pollution, grime, or other environmental problems, slightly below the EU27 average (13.7%, table 6). Those from the poorest income quintile (Q1) are the most affected ones, with 17% of people living with these issues (table 7). The Metropolitan Area of Lisbon (AML) is the most affected (15%), followed by Algarve (14.7%) and Alentejo (14.6%).
Air pollution According to the European Environment Agency (EEA), air pollution levels are too high in many countries across the European Union.31 Nearly 75% of the EU’s urban population is exposed to fine particles, known as PM2.5, in excessive concentrations. Table 8 shows how many years of life we lose, on average, due to exposure to these particles. Both Portugal and the EU-27 improved, between 2010 and 2020, with around less 40% of years lost. In Portugal, in 2020, the number of lost years of life amounted to 264 years per 100,000 inhabitants, which compares to 545 years in the EU-27 average.
Table 6 > Pollution, grime, or other environmental problems in the local area, Portugal vs EU27, 2020 (%)
Source: EU-SILC.32
Table 7 > Pollution, grime, or other environmental problems in the local area, Portugal 2020 (%)
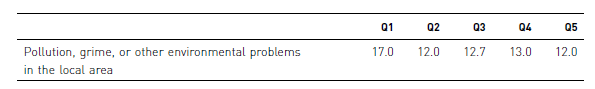
Source: EU-SILC.33
Table 8 > Years of life lost due to exposure to fine particles (PM2.5) per 100,000 inhabitants
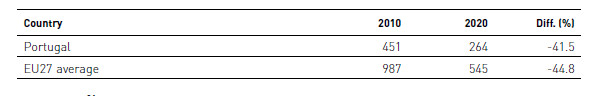
Source: Pordata.34
Wildfires are a serious problem in Europe, and Portugal is one of the most affected areas. According to the report Forest Fires in Europe, Middle East and North Africa 2017, 2017 was the year with more reported wildfires (21,006) and burnt area (540,630 ha) in Portugal. It represented 59% of the total area burned that year in the five Southern EU27 Member States (Portugal, Spain, France, Italy, and Greece).35
In 2021, Portugal reported 8 186 wildfires (61% less than in 2017) and 28 360 (94% less than in 2017) burnt areas. This represented only 5% of the total in the EU27 (500 566 ha). The most affected region was the North, with 42% of the total burnt area. The period between July and August represented around 51% of the 2021 total burnt area.36
Regarding the impact of fires on the loss of human lives, 2017 was marked by two tragic episodes that resulted in 66 fatalities (65 civilians and 1 firefighter). In 2021, there were 6 fatalities, of which 2 were firefighters and 4 civilians (see table 9).
Table 9 > Area burned (hectares) and the loss of human lives, Portugal, 2017 vs 2020
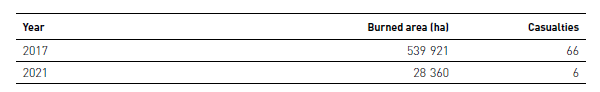
Source: JRC Publications Repository.37
Living conditions
Human security is a broad concept that overlaps with all aspects of life. At the beginning of the century, King and Murray rethink the concept of security and propose a human security index that leaves violence aside and measures the ‘years lived outside a state of generalized poverty’.38
In this section, we look into different dimensions of human security that threaten the everyday lives of the most vulnerable: income, food, housing and health security. As highlighted by Alkire, putting human security into practice entails facing these challenges.39
Income safety
According to Eurostat, people are considered at risk of monetary poverty when their equivalised disposable income (after social transfers and taxes) is 60% of the median national income (which was 924e per month in 2020). In Portugal, in 2020, 1.9 million people were below the at-risk-of poverty threshold of 554e per month. Thus, 18.4% of the population in Portugal is poor, which is above the EU average of 16.7%.
The likelihood of being at-risk-of-poverty is not the same for all population groups. Table 10 shows the most vulnerable groups in Portugal are women, children, young adults and the elderly, and non-Portuguese residents. The type of household is determinant to understand the risk of poverty, with lone parent households being especially at risk (29.9%). Non-Portuguese have a risk of poverty 1.5 times higher than Portuguese in Portugal. With regards to the relation with the labour market, the unemployed are almost 2 times more likely to be at-risk-of-poverty than the employed. The autonomous regions of Madeira and Azores are the most affected (24.2% and 21.9%, respectively). In the mainland, the risk of poverty rate is greater in Algarve (21.6%). Due to their over-dependence on tourism, these regions were strongly affected by the COVID-19 pandemic.
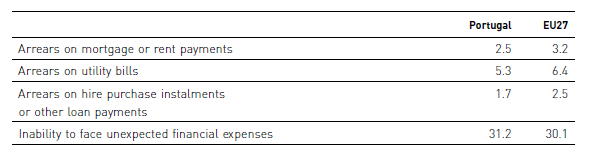
Monetary strain can also be assessed by the inability to face financial commitments or unexpected expenses. In Portugal, in 2021, 2.5% of the population had arrears on mortgage or rent payments, 5.3% had arrears on utility bills, 2% reduced utility costs, and 1.7% had arrears on other loan payments. Additionally, 31.2% report not being able to meet unexpected expenses with their own resources (has to ask for financial help from somebody to pay in due time).
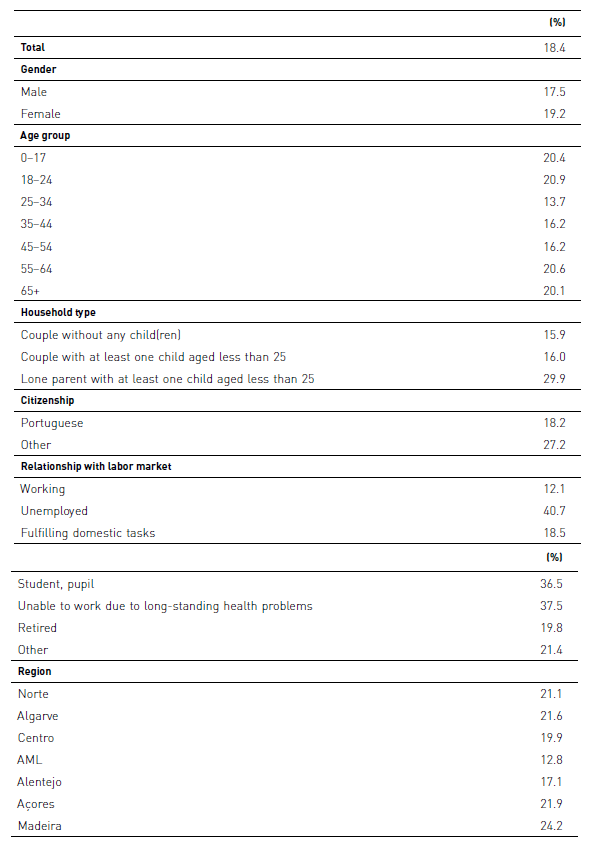
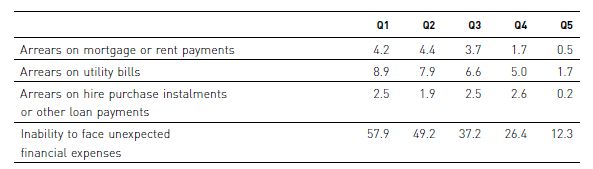
Table 11 shows that Portugal is close to the EU27 average. The big discrepancy is visible between income groups, as shown in table 12. Households with low income are more often unable to fulfill financial commitments, and thus tend to not be able to afford bills and house maintenance in due time. Poorer households (Q1) are 2 times more likely to be unable to pay an unexpected bill and overdue mortgage or rent payments than Q5 households.
Food security
Living conditions are strongly conditioned by the ability to address basic needs, including access to food. The Rome Declaration on World Food Security defines food security as ‘all people, at all times, [to] have physical, social, and economic access to sufficient, safe, and nutritious food that meets their food preferences and dietary needs for an active and healthy life’.41
For this reason, in 2018, the Food Agriculture Organization (FAO) proposed that countries included eight questions about food insecurity in annual household surveys. In the EU, this is done in the SILC survey. The project is known as the Food Insecurity Experience Scale (FIES) and, between 2018 and 2020, 18 countries had already implemented it. Portugal joined in 2021, with relevant findings.
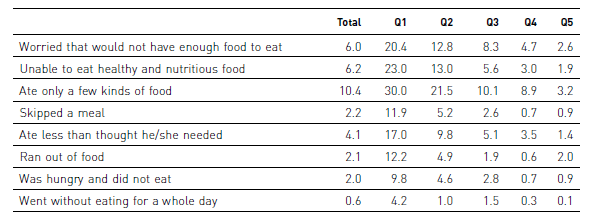
In Portugal, in 2021, 6% of the total population reports concerns about not having enough food to eat, 10% state they can only afford to eat some kinds of food, 4% report they ate less than they thought was necessary, 2% ran out of food, and 3% were unable to afford meals with meat, chicken, fish (or vegetarian equivalent) every second day.
Table 11 > Inability to meet financial commitments or unexpected expenses, Portugal vs EU27, 2021 (%)
Source: EU-SILC.42
Table 12 > Inability to meet financial commitments or unexpected expenses, by income quintiles, Portugal 2021 (%)
Source: EU-SILC.43
As this is a recent set of questions and it is not yet implemented in all the countries of the EU-SILC, it cannot be compared to the EU27. Nonetheless, we know that the share of the population unable to afford a meal with meat, fish, or a vegetarian equivalent, every second day in 2021 in the EU27 average was 7.3%, which compares to 2.3% in Portugal. The EU27 average is skewed by countries like Bulgaria and Romania, with 22.4% and 19.2% of people in this situation.
Table 13 shows that food security in Portugal is strongly conditioned by income: around 20% of the population in the lowest quintile of the income distribution (Q1) report they cannot afford enough food, 30% ate only a few kinds of food, and 17% ate less than thought he/she needed.
Housing security
Having a fixed and safe place to return to at the end of a work or school day is an essential component of one’s safety. In Portugal, in 2021, 16.4% of the population lived in energy poverty, i.e., were unable to keep their home adequately warm (6.9% EU27). In 2020 (last available data), 6.8% of the population considered their dwellings were too dark (6.5% in EU27), 0.6% did not have an indoor private flushing toilet (1.8% in EU27) and 25.2% lived in a dwelling with a leaking roof, damp walls, floors or foundation, or rot in window frames or floor (14.8% in EU27). Table 14 summarises this reality. Once again, those with lower income are the ones in a more unsafe situation. Table 15 shows that 1 in 3 people in Q1 is unable to keep their home adequately warm (vs. 5% in Q5). Leaking dwellings are present across all income groups, with almost 40% of people in Q1 and 15% in Q5 reporting this issue.
Table 14 > Housing conditions, Portugal vs EU27, 2021 (%)
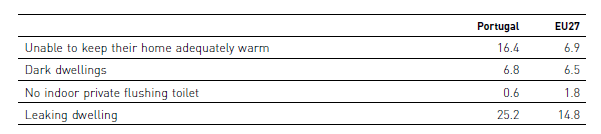
Source: EU-SILC.45. Note: Inability to keep home adequately warm corresponds to 2021 and all remaining variables to 2020.
Health security
All the security factors covered so far affect one crucial aspect of security, which is one’s health. Access to medical care in the Portuguese population is, in principle, ensured on equal grounds, thanks to the existence of a National Health Service (NHS). Nonetheless, differences of access persist across income groups, as shown in table 17. These differences likely result from the combination of private health care top-ups, and lack of access to the public supply due to transaction costs, such as waiting lists or system illiteracy.
Table 15 > Housing conditions, by income quintiles, Portugal 2021 (%)

Source: EU-SILC.46. Note: Inability to keep home adequately warm corresponds to 2021 and all remaining variables to 2020.
Those in the poorest quintile (Q1) are 3 times more likely to miss medical examinations/treatments due to a lack of financial means. The fact that dental care is not provided by the NHS worsens the access of the poorer groups to this type of health care. In 2021, almost 19% of the poor indicate that there was at least one occasion when they needed a dental examination or treatment but did not have access (compared to 7% of the total population).
Table 16 > Share of people reporting unmet needs for medical/dental care for reasons of expense, Portugal vs EU27, 2021 (%)
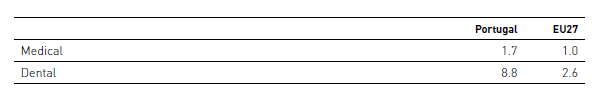
Source: EU-SILC.47
Table 17 > Share of people reporting unmet needs for medical/dental care for reasons of expense, by income quintile, Portugal 2021 (%)
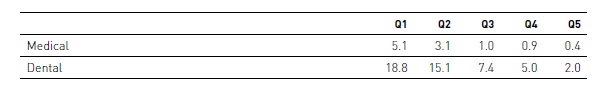
Source: EU-SILC.48
Conclusion
The objective of this paper was to extend the narrow concept of security related to (the absence of) physical threats into Sen’s multidimensional human security.49 Moreover, we sought to show how the heterogeneous position of individuals in society influences the security of their human lives.
The actual dimensions of human security discussed in the paper resulted from the combination of the dimensions of interest and data availability. In particular, we tried, to the extent possible, to rely on individual-level data, that would allow us to characterise asymmetries with regard to security.
Overall, people in Portugal generally feel safe. Portugal is the sixth safest country in the world according to Institute for Economics and Peace.50 However, there are still concerns about safety, especially for certain groups of the population. Women, low-income groups, elderly, and younger people are among the groups of the Portuguese population who feel less safe. Regarding subjective security, Portugal is the country where more people feel safe walking alone in their neighborhood after dark (95%), followed by Finland and Slovenia. The unemployed are 4 times more likely to feel unsafe than the employed. Disabled people also feel more unsafe than non disabled people (31.9% vs. 17.1%).
Since 2013, Portugal has been following the EU trend of decreasing the proportion of the population living in areas with crime, violence, or vandalism. People who live in cities reported these problems over three times more often than people in rural areas of the country.
Turning to objective security, between 2010 and 2020, crimes related to sexual assault and sexual violence are the ones that most increased for both Portugal and EU27 (22.1% and 13.3%, respectively). Regarding environmental security, low-income individuals are the most affected by pollution in their local areas. Although the levels of air pollution have decreased in the last decade, extreme phenomena, such as wildfires, still have devastating effects.
In 2020, the at-risk-of-poverty rate in Portugal was 18.4%, which is above the EU average of 16.2%. With a median equivalised disposable income of 924e per month in 2020, the Portuguese population still faces significant challenges in making ends meet. Around 1 in 3 are not able to meet unexpected expenses with their own resources. Food security is also strongly conditioned by income: around 20% of the population in the lowest quintile of the income distribution (Q1) cannot afford enough food, 30% ate only a few kinds of food, and 17% ate less than thought they needed. Poor housing conditions are present in a significant proportion of households in Portugal, with 1 in 3 people from Q1 unable to keep their home adequately warm (vs. 5% from Q5). Leaking dwellings are present across all income groups, with almost 40% of people in Q1 and 15% in Q5 reporting this issue. Finally, although the country has widely spread access to the National Health Service (NHS), those in Q1 are 3 times more likely to miss medical examinations/treatments due to a lack of financial means. The difference between income groups is most visible in dental care, which is not provided by the NHS. In 2021, almost 19% of the poor indicate that there was at least one occasion when they needed a dental examination or treatment but did not have access (compared to 7% of the total population).
Our main conclusions are as follows. Firstly, Portugal remains a relatively secure country in the context of the EU, even when considering the broader concept of human security. Secondly, one tends to find more prevalence of insecurity in other dimensions beyond the one related to crime and physical threats. Thirdly, and most importantly, the relative security of the country hides considerable heterogeneity amongst socioeconomic groups, which highlights the crucial role of personal circumstances and the importance of targeting public policies at these groups that are more prone to experience insecurity.
Recall that, according to Sen human security concentrates on downside risks, and on the more elementary human rights.51 These inequalities in human security are, therefore, not second order.