


Serviços Personalizados
Journal
Artigo
 Inglês (pdf)
 Artigo em XML
 Referências do artigo
 Enviar este artigo por email
Indicadores
-
 Citado por SciELO
 -
 Acessos
Links relacionados
-
 Similares em
SciELO
Similares em
SciELO
Compartilhar

 Permalink
Motricidade
versão impressa ISSN 1646-107X
Motri. v.5 n.4 Vila Real dez. 2009
Critical load during continuous and discontinuous training in swimming Wistar rats
P. Chimin1, G.G. Araújo2, F.B. Manchado-Gobatto2, C. A. Gobatto2
The study aimed to verify the pattern of critical load (CL) and anaerobic swim capacity (ASC) during a twelve-week continuous program, after 3 and 9 days of detraining, and in a short-term retraining in swimming rats. Animals were distributed into four groups: control (CG), trained (TG), detrained 3 days (D3G) and detrained 9 days (D9G). They were submitted to a CL test in a swimming exercise. TG group trained continuously during 12 weeks. D3G and D9G groups trained for five weeks, stopped for three and nine days, respectively, and came back to complete the training period. ANOVA two-way for repeated measures was used to compare data. All groups showed decline on CL during the twelve weeks of training, but TG showed higher CL values at the end of the twelve weeks (T: 7.03 ± 1.62% of body mass, p<0.05). ASC values did not have a regular pattern of change; there were no statistical difference in the end of the twelve weeks. This study showed that continuous training was able to keep CL values higher than the other groups, but detraining and a short-term retraining was not benefic for CL and ASC.
Key words: critical Load, swimming, Wistar rats
Carga crítica durante treinamento contínuo e descontínuo na natação em ratos Wistar
O estudo buscou verificar o padrão da carga crítica (CL) e capacidade de nado anaeróbio (ASC) durante um programa de treinamento contínuo de doze semanas, após 3 e 9 dias de destreinamento, e em curto período de re-treinamento na natação em ratos. Os animais foram distribuídos em quatro grupos: controle (GC), treinado (GT), destreinado 3 dias (GD3) e destreinado 9 dias (GD9). Eles foram submetidos ao teste de CL. O grupo GT treinou continuamente durante as 12 semanas. Os grupos GD3 e GD9 treinaram por 5 semanas, interromperam o treinamento por 3 e 9 dias respectivamente, e voltaram para completar o período de treinamento. ANOVA two-way para medidas repetidas foi usada para comparar os dados. Todos os grupos mostraram declínio na CL durante as doze semanas de treinamento, mas o grupo GT mostrou valores maiores ao final do treinamento (T: 7,03 ± 1,62% do peso corporal, p<0.05). Os valores de ASC não tiveram um padrão de mudança regular; não houve diferença estatística ao final das doze semanas. Esse estudo mostrou que treinamento contínuo foi capaz de manter os valores de CL maiores, mas o destreinamento e o curto período de re-treinamento não foram benéficos para a CL e ASC.
Palavras-chave: carga Crítica, natação, ratos Wistar
Several concepts support to delimitate the intensity that corresponds to an aerobic-anaerobic transition. Critical power (CP) is often used in order to assess aerobic performance and design training programs. CP is a theoretical construct expected to provide an accurate estimation of the maximal work rate which could be maintained for a very long time without fatigue (Monod & Scherrer, 1965). After the first work of Monod and Scherrer (1965) on a local dynamic muscle, several studies applied CP on different modes of exercise, such as cycling (Moritani, Nagata, DeVires, & Muro, 1981), running (Hughson, Orok, & Staudt, 1984), kayaking (Ginn & Mackinnon, 1989) and swimming (Wakayoshi et al., 1992).
A second index of CP concept is called anaerobic work capacity (AWC), and it seems to correspond to an intramuscular energetic storage, including glycogen and oxygen from myoglobin (Monod & Scherrer, 1965; Moritani et al., 1981), and it represents the anaerobic capacity of the individual (Bishop, Jenkins, & Howard, 1998; Housh, Housh, & Bauge, 1990). The constant AWC is mathematically defined and it is shown to be equivalent to a constant amount of energy above CP, and has been postulated to reflect a finite available energy store previously to exercise (Monod & Scherrer, 1965; Moritani et al., 1981). Consequently, ASC has been considered to be equivalent to the O2 deficit (Gaesser & Poole, 1996).
Since there are obvious limitations in the investigations with in vivo human beings (i.e invasive procedures, ethical concerns), a significant number of studies involving exercise have been conducted in laboratory animals, mainly rats. Some studies determined the transition intensity between intense and severe domain (which represents the highest intensity for VO2 stability) (Poole, Ward, & Whipp, 1990) using measures of blood lactate concentration in these animals (Gobatto et al., 2001; Manchado, Gobatto, Voltarelli, & Mello, 2006). However, it is an invasive method and has high financial cost when compared to Critical Load method (CL) (which correspond to CP) (Marangon, Gobatto, Mello, & Kokubun, 2002). This method has been demonstrated to be an important parameter to prescribe the exercise in humans, besides to be high correlated to performance (Housh et al., 1990).
In that way, there is a great interest in the estimation of the intensity of the effort and in the response of the exercise performed by animals. Adaptations to exercise are a result of a coordinated response of multiple organ systems, and the development of exercise tests represent an important goal towards an accurate evaluation of the effort performed by these animals during exercise and, as a consequence, an accurate evaluation of the physiological responses to it. The physical test applied to the rats can provide information concerning to the metabolic alterations promoted by diseases, sedentarism, detraining and other parameters related to physical-training capacity.
Detraining, in other words, correspond to the principle of reversibility, which states that whereas regular physical training results in several physiological adaptations that enhance athletic performance, stopping or markedly reducing training induces a partial or complete reversal of these adaptations, compromising athletic performance (Mujika & Padilla, 2000a, 2000b). Usually, these interruptions to training process and competition programs occur because of illness, injury, postseason break or others factors. Quantitative and qualitative losses of training-induced adaptations differ depending on the duration of the period of insufficient training stimulus (Fleck, 1994; Hickson, Kanakis, Davis, Moore, & Rich, 1982). In this way, it is extremely important to identify the effects of detraining on aerobic capacity indicator, represented by a non-invasive index.
Therefore, the aim of this study was to verify the pattern of CL and Anaerobic Swim Capacity (ASC – which corresponds to AWC) during: (1) a twelve-week continuous program, (2) after 3 and 9 days of detraining, and (4) in a short-term retraining in swimming rats. We hypothesized that 3 days of detraining would not be able to compromise the aerobic and anaerobic capacities, unlike 9 days of detraining. The short-term retraining would be able to return these parameters to training values, due to short-term detraining.
Methods
Sample
All experiments involving animals were conducted in accordance with the policy statement of the American College of Sports Medicine on Research with experimental animals and it has approval consent from local ethical committee. Fifty six untrained male Wistar rats, 60 days old were used for this study. During whole experiment, the animals received water and commercial Labina Purina chow ad libitum. The rats were housed in collective cages (5 animals/cage), in a room illuminated from AM 6:00 to PM 6:00 and maintained at 25°C.
Design and experimental groups
The animals were distributed into four groups, according to training and detraining regime as:
· Control (CG): group composed of rats that after adapted to water, were submitted to swim for two days.week-1, for three minutes, just to keep the adaptation to water (n=14);
· Trained Group (TG): group composed of rats that after adapted to water, were submitted to continuous training, six days.week-1, sixty minutes per day, along twelve weeks (n=14);
· Detrained 3 days Group (D3G): group composed of rats that after adapted to water, trained for five weeks. After these five weeks, they stopped training for three days. When these days has through, they came back to training to complete the remainder protocol (twelve weeks) (n=14);
· Detrained 9 days Group (D9G): group composed of rats that after adapted to water, were submitted to the same procedure of D3G, but they stopped for nine days (n=14).
The training intensity was set at 80% of CL during all protocol (Gobatto, Manchado, Voltarelli, Contarteze, & Mello, 2005). This intensity was adjusted each two weeks and a half, which consisted in five tests (T1 – test 1; T2 – test 2; T3 – test 3; T4 – test 4 and T5 – test 5).
Research Instrument
Adaptation to water
All rats were adapted to water before the start of the experiment using a standardized procedure (Manchado et al., 2006). Briefly, this adaptation was performed in a 120 cm of depth x 80 cm of diameter, in a cylindrical tank with water at temperature of 31 ± 1°C. The adaptation consisted of daily swimming efforts performed 6 days.week-1 during 2 weeks, where duration and overload were progressively increased. The adaptation was aimed to reduce the water-induced stress without promoting physiological alterations in relation to the physical training.
Determination of Critical Load (CL) and Anaerobic Swimming Capacity (ASC)
After the adaptation, the rats were submitted to four swimming tests at different intensities, which led to exhaustion between 2 and 10 minutes (Hill, 1993). The loads used in the study were 7%, 9%, 11% and 15% of body mass (bm), tied to the back (lead fish sinkers put into a backpack) [see figure 1] (Marangon et al., 2002).

Figure 1. Example of how the loads were tied to the back of the animals
These times were recorded to the nearest second. The loads were executed at random and each animal swam alone. Two tests per day were applied (morning and afternoon). The Critical Load (CL) and the Anaerobic Swimming Capacity (ASC) were calculated, respectively, from the intercept and the slop of the power – 1/time relationship [see figure 2], plotting the load vs. 1/time to exhaustion (Tlim) from the four tests, according to the equation:
Load = CL + (ASC . 1/Tlim)
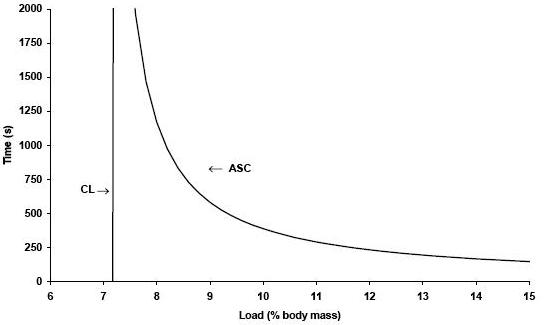
Figure 2. Graphic representation of CL determination of one animal
CL – critical load, ASC – anaerobic swim capacity.
Statistical Analyses
The results are presented as mean ± standard deviation. Least square linear regression was used to fit the data in order to estimate CL and ASC. All data were assessed for sphericity using the Mauchy´s test, and whenever the test was violated we performed the necessary technical correction through the Greenhouse-Geisser test. Whenever the F test was significant, the analysis was complemented by means of a LSD multiple comparison test. Two-way ANOVA for repeated measures (groups and tests) was used to compare the estimates of CL and ASC during all the training protocol. All data analyses were performed using the Statistical Package for Social Sciences (SPSS), version 13.0 for Windows.
Results
All CL values and their differences are presented on figures 3.A and 3.B.

Figure 3.A. Critical load values (% of body mass) among five tests in all experimental groups
Values are means ± SD. CG – control; TG – trained; D3G – detrained 3 days; D9G – detrained 9 days
* significantly different from T; # significantly different from T1; significantly different from T2 (p<0.05)

Figure 3.B. Patterns of critical load values (% of body mass) among five tests in all experimental groups
Values are means. CG – control; TG – trained; D3G – detrained 3 days; D9G – detrained 9 days
The model used for derivation of CL provided good fit to the data in all tests (T1= 0.78 ± 0.19; T2= 0.85 ± 0.16; T3= 0.88 ± 0.17; T4= 0.91 ± 0.11; T5= 0.89 ± 0.11).
On T1, the CL was not significant different among groups (p>0.05), which indicate that all animals began the training protocol in the same physiological condition. But from T2 on, GC group presented reductions on CL values compared to GT group (p<0.05), and this reductions were progressive until the end of the study. The GC group did not differed from GD3 and GD9 groups during all protocol.
Trained group also presented a decline during the continuous training, but only present statistical significance between T2, T3 and T4. At T5 CL value remained stable.
The GD3 and GD9 groups presented reduced values of CL that differed from GT group from T3 to T5 (after detraining period). They also presented lower values of CL in the tests performed after the detraining period; and the retraining time was not able to revert the CL values to their training condition.
On figures 4.A and 4.B, it is represented all ASC values and their differences.
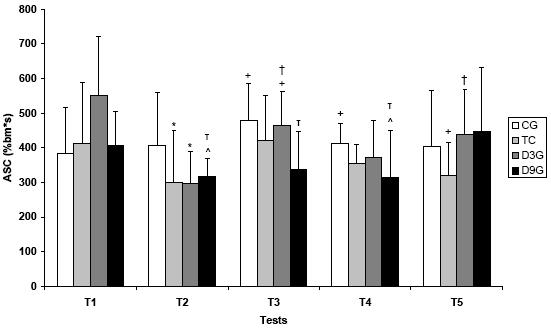
Figure 4.A. Anaerobic swimming capacity values (%bm*s) among five tests in all experimental groups
Values are means ± SD. CG – control; TG – trained; D3G – detrained 3 days; D9G – detrained 9 days
* significantly different from CG; + significantly different from D9G; ^ significantly different from T1;
significantly different from T2; τ significantly different from T5 (p<0.05)
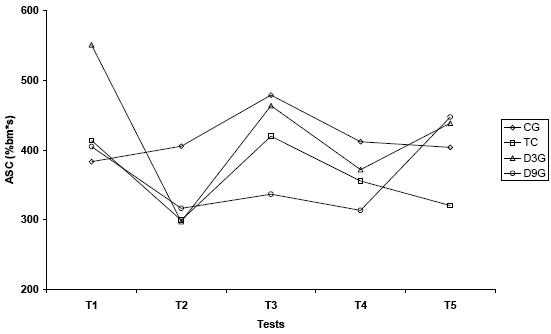
Figure 4.B. Patterns of anaerobic swimming capacity values (%bm*s) among five tests in all experimental groups
Values are means. CG – control; TG – trained; D3G – detrained 3 days; D9G – detrained 9 days
* significantly different from CG; + significantly different from D9G; ^ significantly different from T1;
significantly different from T2; τ significantly different from T5 (p<0.05)
The anaerobic swimming capacity, that represents the anaerobic metabolism, did not present statistical difference along the tests on group GC, but they presented higher values than GD9 group on test 4, which was significant.
The GT group showed higher values of ASC than GC group on T2, and it was significantly different from GD9 on T5. It shows that GT group had higher aerobic capacity.
GD3 group was different from GC on test 2, and presented variations along the other tests. GD9 group showed differences along all the tests.
Discussion
The present study compared the CL indices (CL and ASC) during continuous training, 3 and 9 days of detraining and a short-term retraining. The main finds show that continuous training reduced CL values but they still were higher than CL values of detraining groups. Also, the ASC ASC did not change due to these kinds of training regimes.
Several studies have supported the validity of aerobic parameter in human beings by the high correlations found between VO2 (Gaesser & Wilson, 1988); lactate threshold (Poole, Ward, Gardner, & Whipp, 1988); ventilatory threshold (Moritani et al., 1981), and endurance performance in trained runners (Hughson et al., 1984). In the present study, continuous training at 80% of CL was not capable to induce positive adaptations in aerobic capacity of these animals. This lack of overload in the training regime could explain the decline seen during the 12 weeks.
This monotony (no variation on the intensity) could cause overtraining syndrome. Overtraining syndrome can be defined as a condition of an imbalance between exercise and its recovery, resulting in prolonged and severe fatigue (Hug, Mullis, Voght, Ventura, & Hoppeler, 2003). Ordinarily, the individual with overtraining syndrome presents reduction in performance accompanied by physiological, psychological and biochemical alterations (Silva, Santhiago, & Gobatto, 2006). This explanation is just a theory, since we did not do any direct analysis, like testosterone/corticosterone ratio, for example, to prove our supposition.
Although this decrease in CL values on GT group, it was higher than GC group. It was shown that running exercise prevented an aged-related decline in basal metabolic rate (Ichikawa, Fujita, Ebisawa, & Ozeki, 2000) and to increase VO2max in both rats and mice (Lambert & Noakes, 1990; Swallow, Garland, Carter, Zhan, & Sieck, 1998). This way, even with a monotonous training, GT group preserved some aerobic characteristics compared to GC, GD3 and GD9 groups.
GD3 and GD9 groups also presented reduced CL values after detraining, showing that even 3 days of detraining was sufficient to promote loses. Our data is in accordance with Mostarda et al. (2009) which verified a decrease in aerobic capacity (determined by running exercise) in diabetic and trained rats to baseline values after a 3-week detraining period. Also Carvalho, Marques and Mota (2008) observed significant decline after 3-month detraining in upper and lower body strength and upper and lower flexibility in older women. This way, 3 and 9 days of detraining to our animals were sufficient to promote loses in aerobic capacity, even with submaximal training (80% CL).
The retraining period after 3 and 9 days of detraining was not able to return CL values to its earlier values. This complete recuperation to pre-detraining levels seems to be related to the initial conditioning. Orlander, Kiessling, Karlsson and Ekblom (1977) and Klausen, Andersen and Pelle (1981) demonstrated that in individuals (middle aged men) previously sedentary that completed 7 to 8 weeks of training, the VO2max returned to pre-training levels in 8 weeks of inactivity. On the other hand, besides 16% of decrease in VO2max after almost 2 months of inactivity, individuals previously trained presented VO2max 17% higher than sedentary control.
AWC was shown to be sensitive to muscular glycogen content (Miura, Sato, Sato, Whipp, & Fukuba, 2000) and to high intensity exercise training in untrained men (Jenkins & Quigley, 1993). Besides, it was correlated with anaerobic capacity indices, like maximal accumulated oxygen deficit (Medbo et al., 1988) and total work accomplished during a 30-s cyclergometer sprint (Nebelsick-Gullet, Housh, Johnson, & Bauge, 1988).
In the present study, the ASC values did not shown a regular pattern in all regimes of training. It can be due to the aerobic characteristic of training (80% CL), although some statistical differences were seen among the tests.
One explanation to the variation of ASC even with aerobic training is the change of muscle fiber type in response to inactivity. Several studies showed that the change of type I into type II fibers has been reported in human subjects to be produced by intense strength and interval training (Andersen, Klitgaard, & Saltin, 1994; Staron et al., 1991), sprint training (Janson, Esbjömsson, Holm, & Jacons, 1990) and by detraining (Andersen et al., 1994; Larsson & Ansved, 1985). In experimental animals, the reduction of neural impulses to the muscle has the same effect (Hernández, Torres, & Rivas, 1997).
Unfortunately, we could not access the fiber type of our animals at the end of the experiment to verify if there were some difference on the distribution of type I and type II fibers. In the future, the studies should use some morphological parameters to better understand and explain the pattern of critical load in rats.
Conclusions
This study showed that continuous training did not promote benefits to CL along twelve weeks, but it was able to keep these values higher when compared to control and detrained groups. The pattern of CL during both regimes of detraining was similar, and the retraining period was not enough to return CL values to pre-detraining condition. ASC values did not show a regular pattern in all groups throughout the training/detraining/retraining protocols, perhaps due to its aerobic characteristics.
Acknowledgements
The first author of this study was supported by Fundação de Amparo à Pesquisa do Estado de São Paulo (FAPESP – Proc. 05/54820-2).
References
Andersen, J. L., Klitgaard, H., & Saltin, B. (1994). Myosin heavy chain isoforms in single fibers from m. vastus lateralis of sprinters: Influence of training. Acta Physiologica Scandinavica, 151(2), 135-142.
Bishop, D., Jenkins, D. G., & Howard, A. (1998). The critical power function is dependent on the duration of the predictive exercise tests chosen. International Journal of Sports Medicine, 19(2), 125-129.
Carvalho, M. J., Marques, E., & Mota, J. (2008). Training and detraining effects on funcional fitness after a multicomponent training in older women. Gerontology, 55(1), 41-48.
Fleck, S. J. (1994). Detraining: Its effects on endurance and strength. Strength and Conditioning, 16(1), 22-28.
Gaesser, G. A., & Wilson, L. A. (1988). Effects of continuous and interval training on the parameters of the power-endurance time relationship for high-intense exercise. International Journal of Sports Medicine, 9(6), 417-421.
Gaesser, G. A., & Poole, D. C. (1996). The slow component of oxygen uptake kinetics in humans. Exercise and Sport Science Reviews, 24(1), 35-70.
Ginn, E. M., & Mackinnon, L. T. (1989, March). The equivalence of onset of blood lactate accumulation, critical power and maximal lactate steady state during kayak ergometry. Proceedings of First IOC World Congress on Sport Science, Denver, CO, USA, 34.
Gobatto, C. A., Mello, M. A. R., Sibuya, C. Y., Azevedo, J. R., Santos, L. A., & Kokubun, E. (2001). Maximal lactate steady state in rats submitted to swimming exercise. Comparative and Biochemistry Physiology Part A. Molecular and Integrative Physiology, 130(1), 21-27.
Gobatto, C. A., Manchado, F. B., Voltarelli, F. A., Contarteze, R. V. L., & Mello, M. A. R. (2005). Non-invasive critical load determination in swimming rats: effects of muscle glycogen depletion. Medicine and Science in Sports and Exercise, 37(suppl.), 311.
Hernández, N., Torres, S. H., & Rivas, M. (1997). Inactivity changed fiber type proportion and capillary supply in cat muscle. Comparative Biochemistry and Physiology, 117(2), 211-217, 1997.
Hickison, R. C., Kanakis, J. C., Davis, J. R., Moore, A. M., & Rich, S. (1982). Reduced training duration effects on aerobic power, endurance, and cardiac growth. Journal of Applied Physiology, 53(1), 225-259.
Hill, D. W. (1993). The critical power concept. Sports Medicine, 16(4), 237-254.
Housh, D. J., Housh, T., & Bauge, S. M. (1990). A methodological consideration for the determination of critical power and anaerobic work capacity. Research Quarterly in Exercise and Sports, 61(4), 406-409.
Hug, M., Mullis, P. E., Vogt, M., Ventura, N., & Hoppeler, H. (2003). Training modalities: Over-reaching and over-training in athletes, including a study of the role of hormones. Best Practice e Research Clinical Endocrinology and Metabolism, 17(2), 191-209.
Hughson, R. L., Orok, C. J., & Staudt, L. E. (1984). A high velocity treadmill test to assess endurance running potential. International Journal of Sports and Medicine, 5(1), 23-25.
Ichikawa, W., Fujita, Y., Ebisawa, H., & Ozeki, T. (2000). Effects of long-term, light exercise under restricted feeding on age related changes in physiological and metabolic variables in male Wistar rats. Mechanisms of Ageing Development, 113(1), 23-35.
Jason, E., Esbjömsson, M., Holm, I., & Jacons, I. (1990). Increase in the proportion of fast-twitch muscle fibers by sprint training in males. Acta Physiologica Scandinavica, 140(3), 359-363.
Jenkins, D. G., & Quigley, B. M. (1993). The influence of high-intensity exercise training on the Wlim–Tlim relationship. Medicine and Science in Sports and Exercise, 25(2), 275-282.
Klausen, K., Andersen, L. B., & Pelle, I. (1981). Adaptative changes in work capacity, skeletal muscle capillarization and enzyme levels during training and detraining. Acta Physiologica Scandinavica, 113(1), 9-16.
Lambert, M. I., & Noakes, T. D. (1990). Spontaneous running increases VO2max and running performance in rats. Journal of Applied Physiology, 68(1), 400-403.
Larsson, L., & Ansved, T. (1985). Effects of long-term physical training and detraining on enzyme histochemical and functional skeletal muscle characteristics in man. Muscle Nerve, 8(8), 714-722.
Manchado, F. B., Gobatto, C. A., Voltarelli, F. A., & Mello, M. A. R. (2006). Non-exhaustive test for aerobic capacity determination in swimming rats. Applied Physiology, Nutrition and Metabolism, 31(6), 731-736.
Marangon, L., Gobatto, C. A., Mello, M. A. R., & Kokubun, E. (2002). Utilization of an hyperbolic model for the determination of critical load in swimming rats. Medicine and Science in Sports and Exercise, 34(suppl.), 149.
Medbo, J. L., Mohn, A., Tabata, I., Barh, R., Vaage, O., & Sejersted, O. M. (1988). Anaerobic capacity determined by maximal accumulated O2 deficit. Journal of Applied Physiology, 64(1), 50-60.
Miura, A., Sato, H., Sato, H., Whipp, B. J., & Fukuba, Y. (2000). The effect of glycogen depletion on the curvature constant parameter of the power-duration curve for cycle ergometry. Ergonomics, 43(1), 133-141.
Monod, H., & Scherrer, J. (1965). The work capacity of a synergic muscular group. Ergonomics, 8(3), 329-337.
Moritani, T., Nagata, A., DeVires, H. A., & Muro, M. (1981). Critical power as a measure of physical work capacity and anaerobic threshold. Ergonomics, 24(5), 339-350.
Mostarda, C., Rogow, A., Silva, I. C., Fuente, R. N. De La, Jorge, L., Rodrigues, B., Heeren, M. V., Caldini, E. G., De Angelis, K., & Irigoyen, M. C. (2009). Benefits of exercise training in diabetic rats persists after three weeks of detraining. Autonomic Neuroscience, 145(1-2), 11-16.
Mujika, I., & Padilla, S. (2000a). Detraining: Loss of training-induced physiological and performance adaptations. Part I: Short-term insufficient training stimulus. Sports Medicine, 30(2), 79-87.
Mujika, I., & Padilla, S. (2000b). Detraining: Loss of training-induced physiological and performance adaptations. Part II: Long-term insufficient training stimulus. Sports Medicine, 30(3), 145-154.
Nebelsick-Gullett, L. J., Housh, T. J., Johnson, G. O., & Bauge, S. M. (1988). A comparison between methods of measuring anaerobic work capacity. Ergonomics, 31(10), 1413–1419.
Orlander, J., Kiessling, K. L., Karlsson, J., & Ekblom, B. (1977). Low intensity training, inactivity and resumed training in sedentary men. Acta Physiologica Scandinavica, 101(3), 351-362.
Poole, D. C., Ward, S. A., Gardner, G. W., & Whipp, B. J. (1988). Metabolic and respiratory profile of the upper limit for prolonged exercise in man. Ergonomics, 31(9), 1265-1279.
Poole, D. C., Ward, S. A., & Whipp, B. J. (1990). The effect of training on the metabolic and respiratory profile of high-intensity cycle ergometer exercise. European Journal of Applied Physiology, 59(6), 421-429.
Silva, A. S. R., Santhiago, V., & Gobatto, C. A. (2006). Compreendendo o overtraining no desporto: Da definição ao tratamento. Revista Portuguesa de Ciências do Desporto, 6(2), 229-238. [ Links ]
Staron, R. S., Leonardi, M. J., Karapondo, D. L., Malicky, E. S., Falkel, J. E., Hagerman, F. C., & Hikida, R. S. (1991). Strength and skeletal muscle adaptations in heavy-resistance-trained women after detraining and retraining. Journal of Applied Physiology, 70(2), 631-640.
Swallow, J. G., Garland Jr, T., Carter, P. A., Zhan, W. Z., & Sieck, G. C. (1998). Effects of voluntary activity and genetic selection on aerobic capacity in house mice (Mus domesticus). Journal of Applied Physiology, 84(1), 69-76.
Wakayoshi, K., Ikuta, K., Yoshida, T., Udo, M., Moritani, T., Mutoh, Y., & Miyashita. M. (1992). Determination and validity of critical velocity as an index of swimming performance in the competitive swimmers. European Journal of Applied Physiology, 64(2), 153-157.
Submetido: 24.09.2009 | Aceite: 08.12.2009
1Patricia Chimin.Grupo de Estudo das Adaptações Fisiológicas ao Treinamento – GEAFIT, Universidade Estadual de Londrina, Londrina, PR – Brasil.
2Gustavo Gomes de Araújo, Fúlvia de Barros Manchado-Gobatto e Cláudio Alexandre Gobatto. Departamento de Educação Física, Instituto de Biociências – Universidade Estadual Paulista, Rio Claro, SP – Brasil.
Endereço para correspondência: Patricia Chimin, Rua General Glicério, 378, Vila Nova – Salto, CEP: 13.322-070, São Paulo – Brasil. E-mail: patriciachimin@yahoo.com.br

