


Serviços Personalizados
Journal
Artigo
 Inglês (pdf)
 Artigo em XML
 Referências do artigo
 Enviar este artigo por email
Indicadores
-
 Citado por SciELO
 -
 Acessos
Links relacionados
-
 Similares em
SciELO
Similares em
SciELO
Compartilhar

 Permalink
Motricidade
versão impressa ISSN 1646-107X
Motri. vol.14 no.2-3 Ribeira de Pena out. 2018
https://doi.org/10.6063/motricidade.12790
ARTIGOS ORIGINAIS
Perceived Risk Questionnaire in Canyoners: content validity, cross-validation and transcultural invariance across Portugal and Spain
António Brandão1[*], Diogo Monteiro2,3, Joel Pereira1, Eduarda Coelho3,4, Luís Quaresma4
1 Sports and Leisure School, Polytechnic Institute of Viana do Castelo, Portugal
2 Sport Science School of Rio Maior, Polytechnic Institute of Santarém, Santarém, Portugal
3 Research Center in Sport, Health and Human Development CIDESD
4 Department of Sport Science, Exercise and Health, University of Trás-os-Montes & Alto Douro, UTAD, Vila Real, Portugal
ABSTRACT
The aim of this study was to develop and validate a questionnaire related to the risk perception in canyoning. Cross-validation and transcultural invariance, across Portugal and Spain, were also analysed. A total of 707 canyoners (81.3% males, 18.7% females) from Portugal (47.5%) and Spain (52.5%) participated in this study, with ages between 18 and 57 years old (M = 36.13; SD = 7.71). The initial version of questionnaire had 49 items. With the Temporal Reliability Analysis, the items that showed no correlation between the two moments of the administration of the questionnaire, p>.05, were removed and only 46 items remained. The Exploratory Factor Analysis was developed by choosing the 25 items with higher factorial weight. Six dimensions were found which we managed to identify and characterise with the help of literature. With the Confirmatory Factor Analysis and based on the analysis of the modification indices, 4 items were eliminated, as they presented very high residual values, which contributed to an inadequacy of the model. In this manner, a questionnaire with 21 items was achieved. The final version of the questionnaire showed acceptable values related to reliability and construct validation. Therefore, this allows it to be used in the risk perception in canyoning, with 21 items, distributed among 6 dimensions. Keywords: canyoning, factorial analysis, risk, nature and adventure sport; multi-group analysis
INTRODUCTION
Canyoning is a nature and adventure sport (NAS) which is characterised by a controlled progression in the river/stream bed. The canyoner has to overcome vertical obstacles by means of various techniques and appropriate equipment (Paz et al., 2014). One the of the ways to overcome the obstacles is by resorting to the use of rope maneuvering, with rappel being the most frequent (Acerete et al., 2013). However, the “École Française de Descente de Canyon”, together with the “Fédération Française de Spéléologie” considered canyoning as being a risk sport, since the latter is related to the fact that the place is isolated, of difficult access and with a progression via vertical means (EFDC & FFE, 2001). Additionally, this progression can have the disadvantage of taking place in water, and in certain situations this water can be turbulent with all the inherent risks (Ortega, 2009).
We clearly understand that the risk exists and, therefore, it is important to calculate and minimize it, managing to deal with these occurrences. The majority of the NAS accept the risk as being one of its characteristics. However, these occur when two factors combine, the human and environmental factors. When these factors combine or interact they create an accident-prone situation (Ayora, 2011, 2012; EEAM, 2001; Ennes, 2013). The behavioural factors, which are the more subjective, are those that sometimes make the participant to underestimate the risks inherent to these activities. Therefore, to practice this risk activity, it is essential to have a set of skills and master specialized and complex techniques that guarantee the practice of the activity with maximum safety and a smaller margin of error (Ayora, 2011). The training of the canyoners and technicians is vastly important and should at all times be taken into account. (Bentley & Page, 2008).
This is a recent sport but has expanded greatly in some countries: France, Spain, Italy, Switzerland, Australia and New Zealand. However, the studies on the field of canyoning are reduced, particularly in the area of risk, which makes it difficult to know how the canyoner perceives this issue in canyoning (Hardiman & Burgin, 2010). Nowadays, those who practice NAS seek new and strong emotions but there must be a concern and the notion of the real risks associated with these activities. Such a balance helps the canyoners to reach their objective in a safe manner. This involves risk maximization but the canyoner tries to control in a positive way the uncertainty of the final result. All this is designated as risk management , which has an essential role in the success of the activity (Bentley et al., 2007). Thus, arises our concern for the notion of the perception of risks which the canyoners of the Iberian Peninsula countries are subject to when they practice the activity. Bearing this in mind, this study aimed at the validation of a final version of PQRc, based on content validation. This version was developed by a panel of 60 experts from the canyoning area, with academics, and rescue groups and experienced practitioners, using the Delphi method (Brandão, 2016).
Method
Participants
Study 1: The sample was comprised of 210 canyoners (101 Portuguese and 109 Spanish). The age varied between 18 and 57 years (M=36.21; SD= 7.92). The majority 169 (80.5%) belonging to the male gender. The average number of years in the practice of this activity was of 9.66 ± 7.03.
Study 2: The sample was comprised of 250 canyoners (115 Portuguese and 135 Spanish). The age varied between 18 and 57 (M=36 SD=6.91). The majority 205 (82%) belonging to the male gender and the average number of years in the practice of this activity was 9.56 ± 6.91.
Study 3: To perform this analysis, all used samples were grouped into a single sample, corresponding to a total of 707 canyoners. Subsequently, this sample was divided into four groups: calibration sample (n=356); validation sample (n=351); Portuguese canyoners (n=339) and Spanish canyoners (n=368).
The samples are characterized as follow:
Calibration sample: This sample was comprised of 356 canyoners, (161 Portuguese; 195 Spanish); age varied between 18 to 59 years old (M=36.37; SD=7.93). The majority 275 (77.2%) belonging to the male gender and the average number of years in the practice of this activity was 17.97 ± 7.91.
Validation sample: This sample was comprised of 351 canyoners, (178 Portuguese; 173 Spanish); age varied between 18 to 57 years old (M=35.88; SD=7.46). The majority 300 (85.5%) belonging to the male gender and the average number of years in the practice of this activity was 18.23 ± 6.96.
Portuguese sample: This sample was comprised of 339 Portuguese canyoners, (39 female; 300 male); age varied between 18 to 57 years (M=34.24; SD=7.38), and the average number of years in the practice of this activity was 25.37 ± 8.09.
Spanish sample: This sample was comprised of 368 Spanish canyoners, (93 female; 275 male); age varied between 24 to 57 years (M=37.87; SD=7.60), and the average number of years in the practice of this activity was 11.40 ± 8.17.
Data collection
For the data collection, a convenience sample was used. Spanish and Portuguese were contacted, as well as some clubs of the same countries. All participants were contacted by the research team for the questionnaire procedure and any queries to be explained.
The completion of the questionnaire was carried out on-line on the Survey Monkey platform. Before the participants proceeded with filling in the questionnaire, the latter was tested by 5 people that practice NAS, 3 teachers of Portuguese and 3 teachers of Spanish. They gave their opinion in terms of its readability and workability. The alterations suggested were made and, therefore, a clearer questionnaire was achieved.
Our sample consisted in Portuguese and Spanish canyoners, with a total of 707 questionnaires being used for the whole analysis. In this study we had 3 study moments when different samples were used: Study 1 - 210 questionnaires; Study 2 - 250 questionnaires; Study 3 - 247 questionnaires. The questionnaires were filled through the Survey Monkey platform, with a mean filling time of 10 minutes.
The information collected was anonymous and confidential and was used only in the scope of this research for statistical analysis, in which confidentiality principle was safeguarded, since all the interveners signed a consent document.
Instruments
The participants had to classify their degree of agreement related to the statements of the PQRc instrument that was constructed through the Delphy methodology, through the Likert scale which varies between 1 “never” and 4 “always” (Brandão, 2016).
The sample and use of experts are considered vital for the quality of the results in this process. In the Delphi technique the sample does not use a random representation of the population, but rather a group of specialists in the researched area. Therefore, our concern was to include academic specialists involved in research in canyoning; members of intervention and/or rescue groups, with training in rope manoeuvring, having performed and/or trained in environmental places where canyoning is practised; and finally those who have more than 10000 hours of practice/training in this activity and/or more than 8 years of canyoning (Colvin, 2010; Green et al., 1999).
Study 1: For the Temporal Reliability Analysis (TRA) we carried out the test for 49 items with a 4-point Likert Scale, varied from 1 (never) and and 4 (always). The original questionnaire and it was administered within two weeks interval.
Study 2: After the TRA, we applied the Exploratory Factor Analysis (EFA) on the questionnaire adapted to 47 items with a 4- point Likert Scale, varied from 1 (never) and 4 (always). The purpose of finding and analysing the number of dimensions for a structure of the set of variables, which consider the highly correlated variables with the capacity to summarize the information in the variables into a reduced number of dimensions.
Study 3: For the Confirmatory Factor Analysis (CFA) the version obtained of the CFA with 25 items was used with a 4-point Likert Scale, ranging from 1 (never), 2 (rarely), 3 (often), and 4 (always). The purpose being to find the measurement model of the PQRc.
Statistical Analysis
Study 1: Firstly, an analysis was carried out to evaluate the time reliability of the answers to the questionnaire items by the subjects. The purpose was to evaluate the temporal stability coefficient and, therefore, a test-retest analysis was performed using the Pearson correlation r coefficient, to check if the variables are associated. We verified the force and direction of this association between the two moments the questionnaire was administered varying between +1 and -1. This procedure aims at administering the instrument to the same subject in two distinct moments of time and administered with the same conditions. Although there is no consensus in the literature about how much time we should wait, from the first to the second moment, best practices recommend two weeks, such as suggested by Hill and Hill (2012).
The items that presented no correlation between the two moments of the questionnaire administration, p > .05, were removed from the questionnaire. For the items that remained, the correlation was significant at the level of p <.01 (Saint-Maurice et al., 2014).
Study 2: For the EFA, we considered the minimum ratio suitable 5:1 (number of participants for each item of the questionnaire), as recommended for this type of analysis by Hair, Black, Babin, and Anderson (2014), as well as the best practices recommended by some authors, such as Hair et al. (2014), Kline (2011), Worthington and Whittaker (2006) more precisely: principal component method with varimax rotation; Kaiser criterion (eigenvalue ≥1.0); Kaiser-Meyer-Olkin test (KMO≥.08 p≤.01), combined with Bartlett´s test to verify the degree of adequacy and sphericity; factorial weights between .30 (minimum criterion) and .50 (recommended criterion inexistence of items with factorial weights of some relevance (factor loadings > 0.30) by more than one factor. If that happens and if the difference between them is not significant (cross-loads ≤ 0.15), the item must be eliminated, factorial variance equal or above 40%; internal consistency measured by Cronbach’s Alpha, establishing .60 as the minimum criterion and .70 as the recommended, verify if the latter does not increase if an item is eliminated and only factors with at least three items should be retained. The analyses were undertaken using SPSS 20.0.
Study 3: The Confirmatory Factor Analysis (CFA) was operated using the maximum likelihood (ML) method, based on the chi-square test (χ²) and respective degrees of freedom (df), as well as the level of significance (p). In order to verify the adjustment quality assumptions of the measurement model, the traditional absolute and incremental indices were used: Standardized Root Mean Square Residual (SRMR), Root Mean Square Error of Approximation (RMSEA) and its confidence interval (90% CI), Comparative Fit Index (CFI), Non-Normed Fit Index (NNFI), respectively. For these indexes, the cut-off values suggested by several authors (Byrne, 2010, Hair, et al., 2010; Marsh, Hau, & Wen, 2004) were adopted: SRMR ≤0.0, CFI and NNFI ≥90 and RMSEA ≤. 08. The analyses were undertaken using AMOS 20.0.
Cross-Validation Cross-Cultural Invariance
For the cross-validation, the recommendations of Byrne (2010) were adopted, which suggests that when it is not possible to collect two independent samples, the sample should be divided randomly into two samples (50%). In that sense, following the good practices mentioned, all the samples used were gathered in a single database and divided into two sub- samples, one of which was constituted as a calibration sample and the other as a validation sample. In this way the measurement model from the exploratory analysis was analysed in the calibration sample, and the final model resulting from this analysis analysed in the validation sample.
In addition to cross-validation, we resorted to the study of invariance between Portuguese and Spanish practitioners. The main purpose of cross- cultural invariance is to evaluate if the structure of the measurement model is equivalent (invariant) in different groups that have different characteristics (e.g., Portuguese vs. Spanish culture), According to Sass (2011) and Chen (2008), the cross-cultural analysis is one of the most important analysis in psychometric studies. In order to verify if there was cross-validation and cultural invariance, we used the analysis of multigroup, following the recommendations of some authors (Byrne, 2010; Cheung & Rensvold, 2002), which suggest that to exist invariance it is necessary to verify two criteria: 1) measurement model should be adjusted in to each group; b) to perform a multigroup analysis, it is necessary to examine the following invariance types: configural invariance (unconstrained model); metric invariance (factor loadings equal); strong invariance (factor loadings and item intercepts equal) and strict invariance (factor loadings, item intercepts, and item residuals equal). According to Cheung and Rensvold (2002), the difference in values between the unconstrained model (free parameters) and the constrained model´s (fixed parameters) should be ∆CFI ≤ .01. In line with Cheung and Rensvold (2002), determining invariance in multi-sample testing using the Δχ2 value has been considered unsatisfactory. From this perspective, Cheung and Rensvold (2002) revealed that decisions should be based on CFI differences (∆CFI).
Finally, the convergent validity was calculated, using the average variance extracted (AVE), considering values of AVE ≥ .50. Besides the convergent validity, the discriminant validity was calculated, obtaining good values when the correlation square between the factor is not superior to the AVE value, as well as the composite reliability (CR), considering adjustable values those from .60, as recommended by Hair et al. (2014), and Fornell and Larcker (1981). The analyses were undertaken using AMOS 20.0.
Results
Study 1
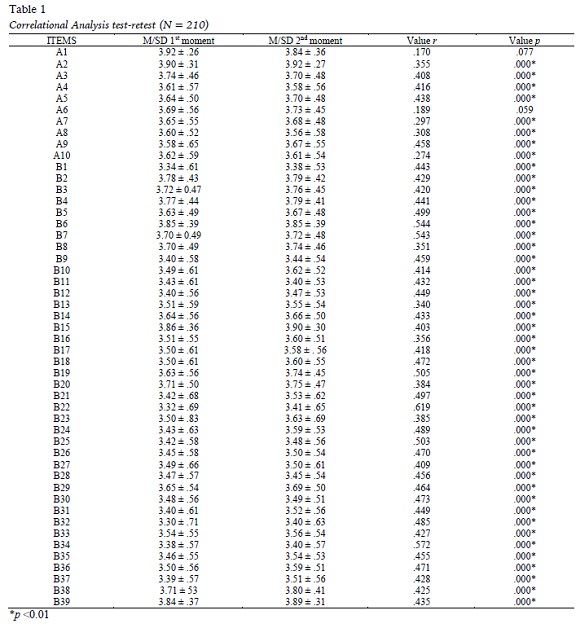
Analysing Table 1, we verify that the questionnaire items presented time reliability since the results proved by Pearson’s r coefficient showed positive and significant correlations between the items in the two moments, with the exception of two items which do not show time reliability. According to Hair et al. (2014), and Hill and Hill (2012), when this assumption is not verified the items have to be eliminated. We, therefore, followed the procedure by eliminating items A1 and A6.
Study 2
In relation to EFA, as demonstrated in Table 2, six factors were extracted, with eigenvalue ≥ 1.0, which together justify 55.33% of the total variance of the results, considered quite satisfactory in studies of this nature. (Hair et al., 2014). Consequently, with this analysis 21 items were eliminated for being cross-loadings and the difference between them not equal to or above .15 (Hair et al., 2014; Worthington & Whittaker, 2006). Besides these items, one more was eliminated for showing a commonality below .40 (Item B23 - .29). According to Worthington and Whittaker (2006), when such a procedure occurs the item has to be eliminated as most of the variance remains unexplained, and the solution is to be found with 25 items.
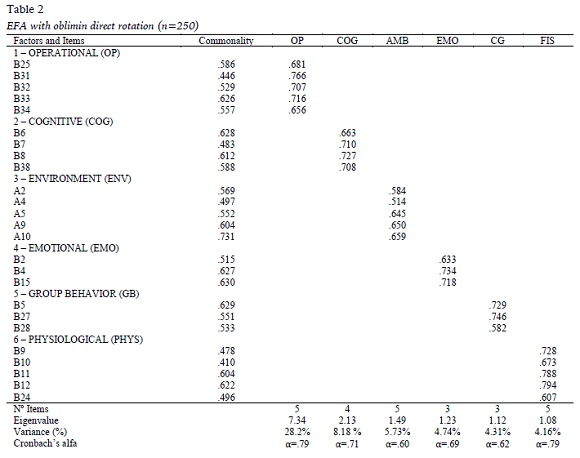
Regarding the factorial weights in the respective factors, the values vary between .51 and .79, which is considered excellent by Kline (2011) and, consequently, all the items explain at least 25% of the variance of the latent factor. The internal consistency of the factors proved to be appropriate, in conformity with the criteria adopted in the methodology, although it was below the recommended level in three factors. No cross-loadings were detected. However, as referred in the methodology, we accept values equal or above .60, minimum acceptable criterion, as stipulated by Hair et al. (2014). It was also noticed that the internal consistency did not increase if the items were eliminated.
Lastly, when analysing the semantic content of the items in each factor, the latter were designated as follows: factor 1 includes information on the operational part (OP), referring to the practices, the processes, the activity systems; factor 2 presents issues related to the cognitive component (COG), referring to the acquisition of knowledge for the practice of canyoning, with the capacity to process data for the learning processes; factor 3 relates to the environment (ENV), typical of the practice areas, environment framework, without Man’s action; factor 4 presents statements regarding emotions (EMO) related to the emotional experience, which may occur in a sudden manner and is aroused by an object or exciting situation, causing reactions in the canyoner’s emotional state and process; factor 5 is related to behavioural group factors (GB), concept which refers to the group dynamics, which is regarded as a number of people who build ties among themselves, placing their cohesion in being together; factor 6 related to the physiological component (PHYS), that is, an athlete’s physical condition in his morphological, muscular, motor, cardiovascular component and his health condition.
Preliminary Analysis
Before the AFC, cross-validation and invariance between countries, a preliminary analysis was performed. This analysis revealed that there were no missing values in any of the analysed samples. However, univariate (z > 3.00) and multivariate (squared Mahalanobis distance = p1 < .001, p2 < .001) outliers were detected, specifically, one in calibration sample, three in validation sample, two in Portuguese sample and four in Spanish sample. These subjects were removed by further analysis (Byrne, 2006; Hair et al., 2014). Still, no violation of univariate data distribution was detected, because the skewness (|S|) and kurtosis (|K|) values for all samples varied between -2 to 2 and -7 to 7, respectively (Hair et al., 2014). However, the mardia coefficient revealed a non-normal data distribution for all samples analysed: calibration sample (129.15); validation sample (108.390); Portuguese sample (84.59) and Spanish sample (1237.31). In line with Nevitt and Hancock (2001), BollenStine bootstrap on 2000 samples was used.
Study 3
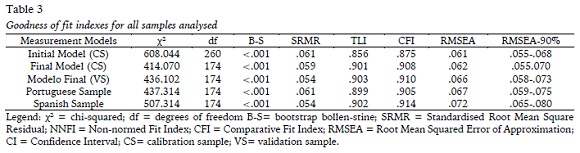
By examining Table 3 it can be verified that the model from the EFA analysed in the calibration sample did not fit the data according to the cut-off values adopted in the methodology (Byrne, 2010, Hair et al., 2014; Marsh et al.,2004). In this sense, the modification indexes were analysed, which resulted in the elimination of 4 items (A2; A4; B11; B38), derived from being cross-loadings (Byrne, 2010). After this procedure the final version (6 factors/21 items) was adjusted to the data in all the samples under analysis: calibration, validation, Portuguese and Spanish samples.
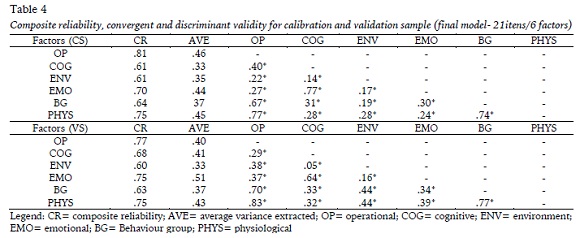
Based on Table 4, it is possible to verify that all factors in the two samples (calibration and validation) presented adequate internal consistency, with composite reliability values ranging from .60 to .81 (Fornell & Larcker, 1981; Hair et al., 2014). However, all factors, except for the emotional factor (validation sample), presented problems of convergent validity (AVE <.50), as suggested by several authors (Fornell & Larcker, 1981; Hair et al., 2014). In addition, they presented discriminant validity problems involving factors such as OP-BG; OP-PHYS; EMO-COG; PHYS-BG (calibration sample); OP- BG; OP-PHYS; EMO-COG; BG-ENV, PHYS-ENV, PHYS-BG (validation sample), since the square of the correlations between the factors was higher than the VEM value of both factors (Fornell & Larcker, 1981; Hair et al., 2014).
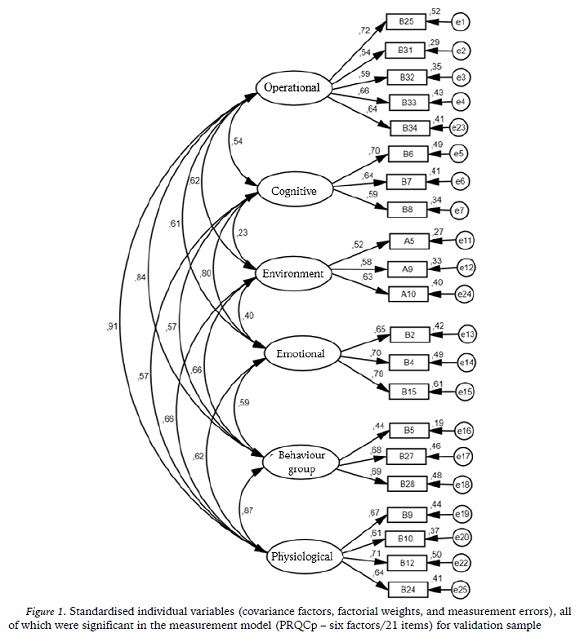
Regarding the CFA, as figure 1 illustrates (validation sample), we verify positive and significant correlations between all the factors, varying from .23 to .91. On the other hand, factorial validity is also verified as all the items have a factorial weight in the respective factor and all statistically significant (p< .05), which vary between .44 and .78, explaining in this manner a good percentage of the variance of the latent variable.
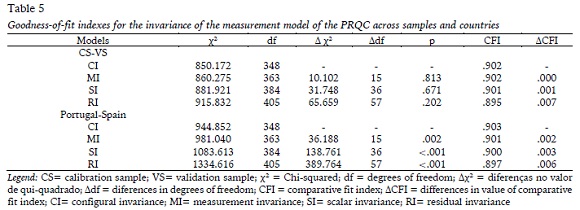
Based on Table 5, it is verified that the measurement model (21 items / 6 factors) is invariant between samples, evidenced by cross-validity and invariant between countries, showing that it can be used by Portuguese and Spanish practitioners.
Discussion
The aim of this study was the validation of the PQRc to the evaluation of the underlying risk factor in the canyoning. In a first instance, results revealed a temporal reliability of the test-retest method, presenting significant correlations between the two moments, in all the items, except (A1) and (A6), which were eliminated. According to Hill and Hill (2012) and Martins (2011), this indicator shows that the items are perceived in the same way at the two moments and, therefore, adding temporal solidity to the questionnaire.
For the TRA, Hill and Hill (2012) recommendations were used, the use of the instrument is suggested to at least 30 subjects and so, in our case, 210 respondents were used. In relation to the EFE, good initial psychometric qualities were shown for a six-factor model with 25 items. Regarding the questionnaire developed initially, which resorted to the Delphi methodology, with a result of 49 items, two of which were eliminated based on the test-retest, as previously referred, out of the 47 remaining items 21 items were eliminated, due to the fact that they presented cross-loadings and the difference between them was not above 0.15. Therefore, when such evidence is available, the correct procedure to be used is the elimination (Hair et al., 2014; Worthington & Whittaker, 2006). When applicate the EFA test, another item was eliminated (B23), because it presented a low commonality (.29), according to Worthington and Whittaker (2006), who suggest the elimination of items with a commonality below 0.40.
Two independent samples were used, one for the EFA and another for the CFA, meanwhile it is not appropriate to use the same sample in the EFA and the CFA, as the problems encountered in the EFA can be counted for the CFA when the same sample is used (Kline, 2011). Although two independent samples were used, one for the EFA and other one for the CFA, for the accomplishment of the CFA, all the samples used in the previous analyses were incorporated in the CFA, since it was necessary to perform a cross- validation, following best practices recommended by Byrne (2010).
The resulting EFA model was analysed in the calibration sample and did not fit the data according to the values adopted in the methodology (Byrne, 2010, Hair et al., 2014; Marsh et al., 2004). After the analysis of the modification indexes, four items were removed, as they were cross-loading (Kline, 2011; Worthington & Whitakker, 2006; Hensen & Roberts, 2006). As a result, the final model (21 items/6 factors) was adjusted to the data in all samples under analysis (i.e., calibration and validation samples, as well as Portuguese and Spanish canyoners), according to the cut-off values adopted in the methodology (Byrne, 2010, Hair et al., 2014, Marsh et al., 2004).
Regarding the composite reliability, all the factors showed an appropriate internal consistency, with CF values varying between .60 e .75 (Fornell & Larcker, 1981; Hair et al., 2014), which in turn indicate factorial validity, so all the items have a factorial weight in the respective factor, varying between .48 and .78, therefore, explaining most of the variance of the latent factor (Hair et al., 2014).
On the other hand, validity convergent problems are verified in all the factors (expect the Emotional factor in validation sample), meaning that the items are not converging solidly with these factors. However, all the items show an appropriate factorial weight and are statistically significant in the respective factor and according to Hair et al. (2014) this is an excellent indicator of convergent validity. Besides this, in accordance with Byrne (2010), none of the items appeared to be a cross-loading, nor presented high residual values and therefore, this is an indicator of adjustment of the items in the factors. Nevertheless, we still verified discriminant validity problems among OP-BG; OP-PHYS; EMO-COG; PHYS-BG (calibration sample); OP- BG; OP-PHYS; EMO-COG; BG-ENV; PHYS-ENV; PHYS-BG (validation sample). This may mean that the factors are not sufficiently distinct from one another (Fornell & Larcker, 1981; Hair et al., 2014). This evidence may be associated to the fact that the questionnaire was created from scratch, based on what is mentioned in the literature and with the help of the specialists and canyoners, members of Intervention groups and/or rescue, researchers in the area of risk and nature and adventure sport (NAS).
In regard to cross-validation and cross- cultural invariance, the results show that the final measurement model (21 items/6 factors) was invariant both between the sample (calibration and validation sample) and between countries (Portugal and Spain). The values found reveal the following: configural invariance - the same number of manifold variables (i.e. items) is present in the same number of latent variables (i.e. factors); metric invariance - the factor weights of the respective factors of the PRQCanyoning have the same meaning in both samples of this population, as well as between countries; scalar invariance - ensures that the obtained results are totally related to the latent trait level of the subjects, independently of the group; residual invariance confirms that the residues of the items are the same for the different groups. According to Chen (2008), when the assumptions of invariance are verified it is allowed to make comparisons in the populations, as well as between Portuguese and Spanish.
In spite of the questionnaire having been developed with the aid of a theoretical model, the latter is not specifically for the area of canyoning but rather fits into the NAS, including distinct activities, such as wall-climbing, rafting, mountaineering, among many other activities, but also showing flaws in the scientific solidity (Ayora, 2012; Ennes, 2013). What could equally influence the results in the discriminant validity was the fact of the risk factors in canyoning not being perceived in an isolated form, that is, one at a time never happens but various factors simultaneously, with these factors being interconnected among themselves, as Ayora (2011) presents in the theory of the concentric circles. This same author clarifies that the factors are not fixed and are unpredictable. It is a dynamic system and changes may occur in the actual course of the activity, placing the subject/canyoner at risk.
The tool that resulted from this process provides the scientific community with the way practitioners perceive the risk in canyoning. The information obtained through the application of this questionnaire will be useful to know the perception of risk. After this process, we arrived at the end with the PQRc validated with a total of 21 items, distributed in six dimensions. This study shows the importance of validation, since the results obtained and the conclusions drawn reflect a more assertive way to apply the questionnaire. Although the values showed fragility in the discriminant validity, implying that there may be problems in interpreting the results, it should be noted that no tool was found that could assess the perceived risk of canyoning by practitioners. This questionnaire can be seen as the beginning of a path to be developed. The results obtained can be used to practice the sport more safely, and can assist the coaches, monitors and guides of this kind of activities, since they reinforce the way of acting in the field, with a more theoretical support and framed with the science.
The data from this study can reinforce the awareness of the need for a better understanding of the sport, as well as to point out some ideas to be developed, either by institutions, clubs, coaches, academics or by athletes who want to be more aware of the dangers to which they are subjected. It is important to point out that the tool developed by us may not generate consensus in all areas of the world. This was only developed and validated for the Portuguese and Spanish populations, knowing that other risk factors may be more relevant in other latitudes of the planet (Bentley & Haslam, 2001; Bentley, Cater, & Page, 2010). Further, research is needed to provide the feasibility analysis of this assessment and to adapt and replicate this tool to other circumstances.
Conclusion
With the internal validation process of PQRc, the latter is reduced from 49 to 21 items, showing the importance of this type of study. The results obtained and the conclusions reached reflect a more assertive form of applying the questionnaire. The fact the values presented weaknesses in the discriminant validity, implies that there may be problems when interpreting the results. However, it must be highlighted that no instrument was found that can evaluate risk perception in canyoning by those who practised it. For such a reason, this questionnaire can be regarded as the beginning of a means to be developed. It is also to be stressed that this questionnaire has only been developed for the Portuguese and Spanish population, with the knowledge that alterations may be possible in the dimensions in other countries. Additional research is required to provide the viability analysis of this evaluation and reproduce this instrument for other countries. Thus, for us, it makes sense to be able to strengthen this area of study, being a modality that is growing and that has been proving its risks in a more drastic way, with the increasing number of victims.
We intend to build a broader and more sustained knowledge, from a risk perspective to aid the comprehension of decision making, thus being able to develop another type of tool in order to help the practitioners to improve their performance in regard to their security. This proximity established with the various stakeholders allowed us to establish a very wide network of contacts, with several experts from the fields of intervention of canyoning, from practitioners, academics in the area, even the intervention and rescue groups in the national territory and Spanish, with whom we shared experiences and opinions resulting in a comprehensive set of information valid for future research.
REFERENCES
Acerete, R., Gastón, M., Marti, A., Ortega, J., Puyó, A., & Hidalgo, J. (2013). Descenso de barrancos técnicas avanzadas. Madrid: Ediciones Desnivel, [ Links ] S.L.
Ayora, A. (2011). Gestión del risco en montaña y en actividades al aire libre. Madrid: Ediciones Desnivel, [ Links ] S.L.
Ayora, A. (2012). Riesgo y liderazgo Cómo organizar y guiar actividades en el medio natural. Madrid: Ediciones Desnivel, [ Links ] S.L.
Bentley, T., & Page, S. (2008). A decade of injury monitoring in the New Zealand adventure tourism sector: A summary risk analysis. Tourism Management, 29, 857-869. https://doi.org/10.1016/j.tourman.2007.10.003 [ Links ]
Bentley, T., & Haslam, R. (2001). Identication of risk factors and countermeasures for slip, trip and fall accidents during the delivery of mail. Applied Ergonomics, 32, 127-134. https://doi.org/10.1016/S0003-6870(00)00048-X [ Links ]
Bentley, T., Cater, C., & Page, S. (2010). Adventure and ecotourism safety in Queensland: Operator experiences and practice. Tourism Management, 31(5), 563-571. https://doi.org/10.1016/j.tourman.2009.03.006 [ Links ]
Brandão, A. (2016). Perceção do risco e segurança no canyoning, a experiência e confiança necessária para a prática da modalidade (Tese de doutoramento em ciências do desporto). Universidade de Trás-os- Montes e Alto Douro. Vila Real. [ Links ]
Byrne, B. (2010). Structural Equation Modeling with EQS. Basic Concepts, Applications, and Programming (2nd edition.). Mahwah, NJ: Lawrence Erlbaum Associates, Publishers.
Colvin, G. (2010). O talento não é tudo. Lisboa: Lua de Papel. [ Links ]
Chen, F. (2008). What happens if we compare chopsticks with forks? The impact of making inappropriate comparisons in cross-cultural research. Journal of Personality and Social Psychology, 95, 1005-1018. https://doi.org/10.1037/a0013193 [ Links ]
Cheung, G., & Rensvold, R. (2002). Evaluating goodness-of-fit indexes for testing measurement invariance. Structural Equation Modelling: A Multidisciplinary Journal, 9, 233-255. https://doi.org/10.1207/S15328007SEM0902_5 [ Links ]
EEAM. (2001). Certificado de Iniciación al Montañismo.Huesca: Barrabes editorial. [ Links ]
EFDC, & FFE. (2001). Manual Técnico de Descenso de Cañones. Madrid: Ediciones Desnivel, [ Links ] S.L.
Ennes, M. (2013). Os fatores de risco real nas atividades de montanhismo. Cadernos UniFOA, 21, 37-52. [ Links ]
Fornell, C., & Larcker, D. F. (1981). Evaluating structural equation models with unobservable variables and measurement error. Journal of Marketing Research, 18(1), 39-50. https://doi.org/10.2307/3151312. [ Links ]
Green, B., Jones, M., Hughes, D., & Williams, A. (1999). Applying the Delphi technique in a study of GPs information requirement. Health and Social Care in the Community, 198-205. https://doi.org/10.1046/j.1365-2524.1999.00176.x [ Links ]
Hair, J., Black, W., Babin, B., & Anderson, R. (2014). Multivariate Data Analysis. In Multivariate Data Analysis (7th ed.). NJ: Pearson Educational, Inc. [ Links ] Seventh Edition.
Hardiman, N., & Burgin, S. (2010). Adventure recreation in Australia: a case study that investigated the profile of recreational canyoners, their impact attitudes, and response to potential management options. Journal of Ecotourism, 9(1), 36-44. https://doi.org/10.1080/14724040902863333. [ Links ]
Henson, R., & Roberts, J. (2006). Use of Exploratory Factor Analysis in Published Research. Common Erros and Some Comment on Improved Practice. Educational and Psychological Measurement, 66(3), 393-416. [ Links ]
Hill, M., & Hill, A. (2012). Investigação por questionário.Lisboa: Edições Sílabo. [ Links ]
Kline, R. (2011). Principles and Practice of Structural Equation Modeling. New York: The Guilford Press. [ Links ]
Martins, C. (2011). Manual de análise de dados quantitativos com recurso ao IBM SPSS. Braga: Psiquilibrios Edições. [ Links ]
Nevitt, J., & Hancock, G. R. (2001). Performance of bootstrapping approaches to model test statistics and parameter standard error estimation in structural equation modeling. Structural Equation Modeling, 8, 353-377. https://doi.org/10.1207/S15328007SEM0803_2 [ Links ]
Ortega, J. (2009). Manual de aguas vivas en barrancos. Madrid: Ediciones Desnivel, [ Links ] S.L.
Saint-maurice, F., Welk, J., Beyler, K.,Bartee, T., & Heelan, A. (2014). Calibration of self-report tools for physical activity research: the Physical Activity Questionnaire (PAQ). BMC Public Health, 14, 461. https://doi.org/10.1186/1471-2458-14-461 [ Links ]
Worthington, R., & Whittaker, T. (2006). Scale development research. A content analysis and recommendations for best practices. The Counselling Psychologist, 34(6), 806-838. https://doi.org/10.1177/0011000006288127 [ Links ]
Acknowledgments: Nothing to declare.
Conflict of interests: Nothing to declare.
Funding: Nothing to declare.
Manuscript received at August 8th 2017; Accepted at December 23rd 2017
[*] Corresponding author: Complexo Desportivo e de Lazer Comendador Rui Solheiro Monte de Prado, 4960-320 Melgaço, Portugal E-mail: antoniobrandao@esdl.ipvc.pt

