


Services on Demand
Journal
Article
 English (pdf)
 Article in xml format
 Article references
 Send this article by e-mail
Indicators
-
 Cited by SciELO
 -
 Access statistics
Related links
-
 Similars in
SciELO
Similars in
SciELO
Share

 Permalink
Motricidade
Print version ISSN 1646-107X
Motri. vol.14 no.4 Ribeira de Pena Dec. 2018
https://doi.org/10.6063/motricidade.15984
ARTIGOS ORIGINAIS
Data’s Hidden Data: Qualitative Revelations of Sports Efficiency. Analysis brought by Neural Network Performance Metrics
Ana Teresa Campaniço1[*], António Valente1, Rogério Serôdio2, Sérgio Escalera3
1INESC TEC - INESC Technology and Science and School of Science and Technology, University Trás-os-Montes and Alto Douro, Vila Real, Portugal
2Department of Matematics, University of Beira Interior, Covilhã, Portugal
3University of Barcelona and Computer Vision Center, Barcelona, Spain
ABSTRACT
The study explores the technical optimization of an athlete through the use of intelligent system performance metrics that produce information obtained from inertial sensors associated to the coach's technical qualifications in real time, using Mixed Methods and Machine Learning. The purpose of this study is to illustrate, from the confusion matrices, the different performance metrics that provide information of high pertinence for the sports training in context. 2000 technical fencing actions with two levels of complexity were performed, captured through a single sensor applied in the armed hand and, simultaneously, the gesture’s qualification through a dichotomous way by the coach. The signals were divided into segments through Dynamic Time Warping, with the resulting extracted characteristics and qualitative assessments being fed to a Neural Network to learn the patterns inherent to a good or poor execution. The performance analysis of the resulting models returned a prediction accuracy of 76.6% and 72.7% for each exercise, but other metrics indicate the existence of high bias in the data. The study demonstrates the potential of intelligent algorithms to uncover trends not captured by other statistical methods.
Keywords: artificial neural networks, confusion matrix, performance analysis, mixed methods, sports.
Introduction
When it comes to the study of the effectiveness and efficiency of an athlete’s performance, technology provides us with invaluable tools for the treatment and analysis of large amount of data with relative ease. Intelligent systems are particularly useful in the detection of patterns and extraction of other highly relevant information that cannot easily be determined through normal statistical means (de Souza et al., 2013; Whiteside et al., 2017). However these systems are not limited to work exclusively with purely quantitative, biometric data.
Machine learning algorithms are often used to automatically identify systems of movements, actions and behaviors based on a classification approach. Classes which can be defined not only by the distinct differences in the collected metrics, but by more abstract definitions of what they intend to teach the system how to identify (e.g.: detecting if the subject is standing, sitting or lying down) (Alpaydin, 2014; Lara & Labrador, 2013; Sammut & Webb, 2017; Taylor et al., 1994).
The same approach can be applied to the coach’s assessment. When performing a study in context of the actions performed by the athlete and measuring their performance, either during the competition or during practice, a coach performs a qualitative evaluation based on their highly honed, but ultimately subjective and empirical knowledge (de Souza et al., 2013; Whiteside et al., 2017). Which can be translated to a nominal measurement unit the intelligent system can use as an input variable. As such the performance analysis metrics used to evaluate the algorithm’s predictive ability can be used to analyze not only how well the system was able to correctly classify the given data, but those results provide important insight on the quality of the data itself (Alpaydin, 2014; Fawcett, 2006; Hlaváč, 2016; Lara & Labrador, 2013; Powers,2011).
In this article it’s exemplified the application of these metrics by using this system in the observation of the fencing practice, a sport highly characterized by its sudden, explosive speeds, wide range of position combinations and constant adjustment of the strategic, tactical and technical decisions to the surrounding context (Araújo, 2006; Barth et al., 2007; Czajkowski, 2005; José, 2018; Kimm & Thiel, 2015; Saucedo, 2000; Tarragó, et al., 2015; Torrents, 2005). Through a novel combination of the master’s (coach) qualitative assessment of the fencer’s efficiency and the data collected by an inertial sensor placed on the weapon hand, this Mixed-Method design approach (Anguera et al., 2018; Creswell & Plano Clark, 2011) allows the system to observe this highly variable sport and learn from the patterns hidden within the data what sets a good from a bad execution apart. Therefore the evaluation of its qualitative predictions, which were guided by the master’s observation criteria, reflect the behavioral patterns and cognitive biases and thus point out fallacies in the criteria items and the direction in which they should be fixed.
Method
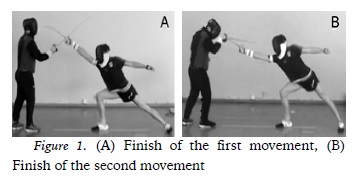
The study of the effectiveness of a single fencer’s training movements while in context was performed on two technical-tactical actions, a simple attack (sixth engagement lunge with point contact on the chest) (figure 1A) and a compound one (sixth engagement with a counter-action of the master with disengagement to low line, with an octave engagement and a lunge with point contact on the chest) (figure 1B), both falling within the Federation International Escrime (FIE, 2017) technical rules.
It follows a Nomothetic/Follow- up/Multidimensional design, focusing on the plurality of the units (actions performed by the fencer), adding the differentiation generated by the qualification introduced by the master (good and bad), as observed through specific actions in the ad-hoc instrument constructed through field formats. The observation registers the actions over several sessions carried out over time, with a multidimensionality of response levels co- occurring at the same time (Anguera et al., 2001, 2011; Anguera & Mendo, 2013; Portell et al., 2015).
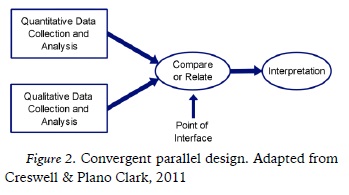
Its focus is to combine the qualitative (QUAL) evaluations obtained from Observational Methodology performed by the master and the quantitative (QUAN) information obtained from the inertial sensors through a QUAL/QUAN/QUAL Mixed-Methods approach (Anguera et al., 2017), as seen in figure 2.
This is achieved by training an Artificial Neural Network (ANN) on how to recognize the patterns that form the master’s decision process and thus provide us with valuable revelations that otherwise we would not normally be able to infer from the data (Hlaváč, 2016; Powers, 2011; Sammut & Webb, 2017).
Participants
Each exercise was performed 1000 and 700 times respectively in 2 daily sessions, with a 15 minute interval every 100 executions, by a single fencer. The inertial data was collected at a 100 Hz sample rate, while the qualitative evaluation of each execution was provided as a good/bad dichotomic variable, according to an ad-hoc observational instrument. The collected data (the sample) was conditioned to have a rate of ±60- 40% of good and bad executions respectively, in order to provide proper representation of either category to the learning system.
The fencer is among the top 20 of Youth (U19) World Ranking UIPM, with international level in Modern Pentathlon, while the master has 10 years of experience as a coach, with 6 of international level, teaching athletes of world level. The sensor was placed on a non-intrusive location on top of the glove and the whole data collection took place during the normal training context. Therefore the procedures performed in this study did not require an ethics approval at the time of the research, as per by the UTAD Ethics Committee’s rules and guidelines. All subjects gave written informed consent in accordance with the Declaration of Helsinki.
Measures
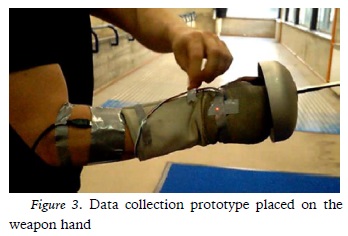
Competition The data was collected by a university laboratory developed device placed on top of the glove of the weapon hand of the fencer (figure 3), which respects the FIE technical regulations (FIE, 2017), created specifically for the purpose of this research.
The hardware is composed by an Arduino Nano and a single MPU-6050 inertial sensor, which contains an accelerometer and a gyroscope, set on a multi-sensor board GY-521 of 21.2 x 16.4mm. The 3-axis accelerometer was set at a range of 16g, with a corresponding sensitivity factor of 2,048 LSB/g, calibration tolerance of ±3% and cross-axis sensitivity of ±2%. The 3- axis gyroscope was set at a range of 2000 °/s, with a corresponding sensitivity factor of 16.4 LSB/(°/s), sensitivity tolerance of ±3% and cross-axis sensitivity of ±2% (Invensense, 2013).
The system is powered by, and transfers data through, an USB link to the computer.
The software is composed by a custom data collection application developed with C# in Unity3D (Unity®, 2017), while all the data processing was done in Matlab (Mathworks, 2017). A complementary data collection system, used exclusively to register the fencing context and allow a visual confirmation of the performed actions, was a Sony P250 camera positioned at a distance to allow enough zoom to capture the whole image plane. The recordings were made in the natural light conditions of the room.
Procedures
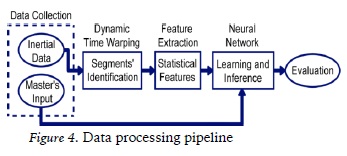
Because each exercise is composed by several independent actions that follow the same set sequence in every observed execution, but with different durations and levels of expression, each signal was divided into 6 key segments through the use of Dynamic Time Warping (DTW). This is a time series analysis method that can find the optimal alignment between two given sequences, independently of any time distortions between them, by determining the warping path that provides us with the smallest possible distance between all the points of both time series (Bautista et al., 2016; Kivikunnas, 1998; Ratanamahatana & Keogh, 2004; Reyes et al., 2011; Tang et al., 2018).
As seen in figure 4, this step is followed by Feature Extraction, a dimensionality reduction method that removes the redundant information in the data by extracting all the relevant statistical and structural features that describe the underlying phenomena without any loss of important information (Alpaydin, 2014; Bishop, 1995; Lara & Labrador, 2013; Rojas, 1996; Sammut & Webb, 2017). Each context requires different types of features, as there is no universal solution that portrays every single problem with the same level of relevance. Likewise some only become relevant descriptors when paired with other features, while others become irrelevant under certain combinations (Guyon & Elisseeff, 2006). There are multiple methods in this field of science regarding the feature selection process, but this is not the goal of this article.
Taking into account this signal observes human activity through an IMU, which is prone to high oscillation and fluctuations (Erdas et al., 2016; Lara & Labrador, 2013; Preece et al., 2009; Vital, 2015), and the resulting information will aid the ANN in its analysis of each execution, the combination of features that produced the best results this specific study were the median, root mean square, kurtosis, fast Fourier transform and principal component analysis. Which, combined with the duration of each segment, produced a total of 72 features for each of the two exercises. The next step in the data processing is the selection of the intelligent algorithm that will merge the QUAN and QUAL data through a Mixed Method approach in order to reach a QUAL output. Of the several branches of artificial intelligence, a machine learning approach works by acquiring new knowledge or understanding from its “past experiences” in order to form a “decision making” model that will give it the ability to predict future outcomes with increasing reliability (Alpaydin, 2014; Kim, 2017). Supervised learning specifically learning learns how to perform its task from not just the inherent patterns within the training data, but also from direct observation the desired output it must strive to achieve during its learning stage (Alpaydin, 2014; Bishop, 1995; Rojas, 1996; Taylor et al., 1994). Classification systems are a subgroup that takes the already known relationships (the classes) and predicts which of the discrete, or categorical, labels a new observation should fall into (Alpaydin, 2014;Taylor et al., 1994).
The ANN is a versatile artificial intelligent algorithm that uses multiple layers of interconnected artificial neurons to receive, process and transmit the provided input (the quantitative signal) based on a weight bias (the qualitative evaluation) and activation function that determine if each neuron is allowed to pass the information to the next layer or not (Alpaydin, 2014; Bishop, 1995; Rojas, 1996). As the weight of each neuron is adjusted over time based on their activation states, the desired connections between the neurons are reinforced, while the undesirable ones are suppressed. This leads to the ANN to adapt to the provided information and thus learn the patterns that lead to the sorting into each category (Alpaydin, 2014; Bishop, 1995; Rojas, 1996).
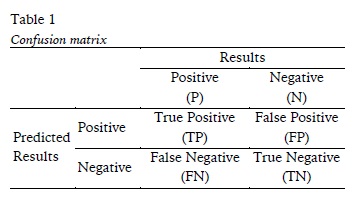
Depending on the quality of the selected training data in representing the problem the system is aiming to solve, in this case a wide variety of examples of both good and bad executions and their inherent variability, the model produced by the ANN may suffer from prediction errors that lead to Overfitting or Underfitting (Alpaydin, 2014; Fortmann-Roe, 2012; Kim, 2017; Kuhn & Johnson, 2013). The confusion matrix (table 1) allows us to detect such occurrences by measuring the performance of a classification model through how well it predicted the correct outcomes (Fawcett, 2006; Hlaváč, 2016; Lara & Labrador, 2013; Powers, 2011). In our case this also translates into insights on the master’s evaluation process.
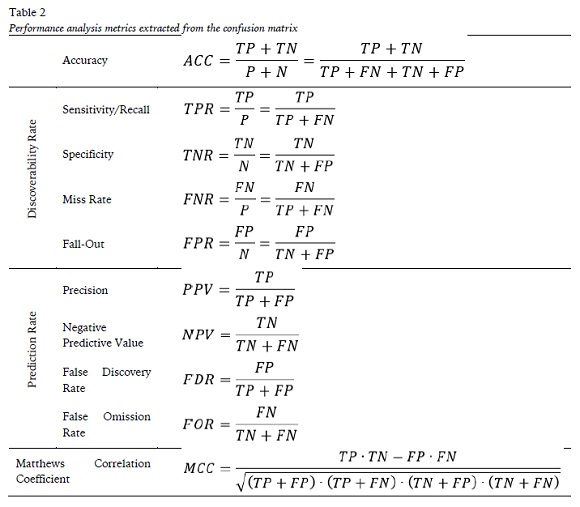
Multiple metrics can be calculated from this matrix beyond just the accuracy, a highly misleading metric of the model’s performance when dealing with an unbalanced dataset if not paired up with others to provide a full insight (Hlaváč, 2016; Powers, 2011).
As seen in table 2, the discoverability rate formulas focus on the classifier’s ability to identify the actual results, while the prediction rate ones measure the overall performance of the predictions themselves. The Matthews correlation coefficient measures the quality of the model, with the values ranging between -1 and +1, or complete disagreement between the variables and perfect prediction respectively (Fawcett, 2004, 2006; Powers, 2011; Sammut & Webb, 2017).
Results
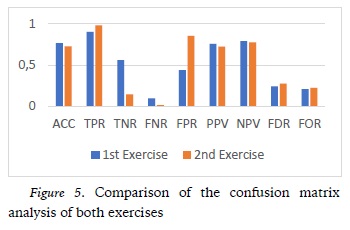
As it can be seen in table 3 our model has a prediction accuracy of 76.6% and 72.7% for the first and second exercise respectively, with a discoverability rate of 90.2% and 98.1% of the positive executions and 56.1% and 14.6% for the negative ones. However it also tends to misclassify good executions as bad 9.8% and 1.9% of the time, and 43.9% and 85.4% for the negative ones.
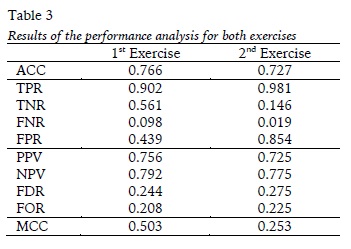
But in terms of prediction rate, the model has a 75.6% and 72.5% probability of predicting a good execution correctly for the first and second exercise respectively, and a 79.2% and 77.5% for the bad ones. In terms of misclassifications it has a 24.4% and 26.5% chance of mistaking a negative result for a positive one, and 20.8% and 22.5% for opposite outcome.
Discussion
For a qualitative focused tool, where high variability is to be expected, an ACC of ±80% is considered acceptable from an Observational Methodology perspective. Paired up with a high discovery rate of the positive results (TPR), which in a sport context is often the desired outcome, these metrics would point towards this model having a desirable performance. However the high FPR hints us towards some issues in the prediction of the good executions, especially in the second exercise.
The model having such a disproportionate high tendency to detect the positive results, including misclassifying negative ones as such, reveals an imbalance in the data which in turn led to the ANN to produce an Underfitting model that suffers from high bias. That is, the data lacks enough complexity for the system to properly capture the underlying relationships within the data that dictate what forms a bad execution (Alpaydin, 2014; Bishop, 1995; Fortmann-Roe, 2012). However the prediction rates have a similar performance when it comes to detecting either the good or the bad executions correctly, meaning the model has a low variance (Fortmann-Roe, 2012).
Such behaviors are often the result of an insufficient data sample size or an imbalance in the percentage of both types of executions. The ANN require a high volume of data and, more importantly, a proper representation of all categories to detect the underlying patterns accurately (Alpaydin, 2014; Bishop, 1995), as shown by the FPR. But it is important to remember these qualifications that guided the learning process of both models are the result of a human-made, empirical evaluation that has a natural tendency to adjust over time to fit the athlete’s level, especially when perception is under variations brought by fatigue.
The fact a traditional observation instrument is designed towards outlining all the items that form a correct execution also explains the behavior of both models. Besides fencing being a sport with an inherent high degree of variability in what is considered a correct execution, even when defined by strict qualitative criteria and the scope narrowed to a specific training exercise, with minimal external interaction brought by the opponent, any unfulfilled criteria within the full length of the execution automatically categorizes it as incorrectly performed.
This can be a strong source of confusion for the system in understanding what are the minute characteristics that set both categories apart, if for example an execution is correct by all accounts but one. And it explains why both models have such a strong tendency to signal so many results as positive, especially when the complexity was increased and thus the level of scrutiny followed, in order to pay attention to the growing amount of details taking place in the same amount of very short time. When no additional information is provided on where the fencer erred, as how it normally occurs in a training session, this dichotomic evaluation does not provide sufficient detail and complexity for the system to detect the nuances that set the categories apart.
However there is an external source of error within the evaluations that could not be accurately measured and thus removed that is likely playing a role in these results. Even if the study only focused the observation of the hand in context, information from other body segments was admitted to have been introduced. So, while the use of an inertial sensor can clearly capture valuable information from the hardest segment of the body to keep track of within fencing without the aid of a vision based approach, which is far more complex and demanding from a computational standpoint (Bradski, 1998; Diamant, 2008; Polak et al., 2015), this coupled with the metrics pointing to a lack of complexity means a lone sensor does not possess enough resolution to fully describe the context on its own.
The reason only a single sensor was used was because of the notion that any motions performed by the body will be expressed in the suspended hand, thanks to the sensor’s high sensibility. How much impact the fencer’s compensatory actions have in dampening such readings was not part of our focus, but the addition of another sensor to the leg would most certainly increase the level of resolution of the observational instruments’ criteria (Malawski and Kwolek, 2016) and allow easier creation of new categories, based on the discrimination of the location of the incorrect action.
As for the performance of the system itself, the prediction rates indicate both models have a fairly good probability of correctly predicting the class each execution belongs to, for both the positive and negative outcomes and in both exercises. That is, despite the data suffering from a high positive bias, or quantitively having a high selection of positive predictions, qualitatively both good and bad executions were fairly well distributed between both classes (Hlaváč, 2016; Powers, 2011; Sammut & Webb, 2017). Depending of the problem being solved often more relevance is given to one of either sides, although this only matters when the data is balanced (Fawcett, 2004, 2006). What this does show however is the data suffers from low variability and that this tool has potential in detecting the patterns that form the qualitative evaluations.
As for the Matthews correlation coefficient, while it is hard to pinpoint which of the multiple causes are affecting its measurement of the quality of the model itself without further investigation and experimentation, we can say with some certainty the clear difference between both exercises is tied to their respective levels of complexity and the impact of how hard it is to completely divorce the actions of the different body segments. It also serves as an illustration at how complex it is, in such a nuanced sport, to translate such qualitative criteria occurring in context into a more “transparent” format.
Conclusion
Our study showed how an artificial intelligence based system can be applied in fencing and, through the use of a single inertial sensor and a mixed methods approach, can capture information often not visible to the naked eye. More importantly it also provides vital insight on the quality of the data in regard to the qualitative observations performed by the master in context, achieved through a confusion matrix and several performance analysis metrics of the intelligent system.
Although the system has a 76.6% and 72.7% prediction accuracy rate, the performance analysis metrics revealed the data suffers from a high bias towards the positive results. That is, the data lacks enough complexity for the ANN to detect the patterns that distinguishes a good execution from a bad one, especially for the harder exercise. This points towards an imbalance in the representation of the bad executions in particular, as their definition is too broad in comparison to the good ones. This strongly suggests that a single sensor is unable to fully capture the context of the fencer’s weapon hand without taking the actions of the other key body segments into account.
Further research is needed by adding new sources of information, adjusting the observation criteria, increasing the data sample and likely also incorporating evaluations performed by other masters and patterns performed by other fencers, as to detect different behavioral and decision patterns.
REFERENCES
Alpaydin, E. (2014). Introduction to Machine Learning. Adaptive Computation and Machine Learning (Cambridge, Massachusetts: The MIT Press), third edn.
Anguera, M.T., Blanco-Villaseñor, Á. & Losada, J.L. (2001). Diseños observacionales, cuestión clave en el processo de la metodologia observacional. Metodología de las Ciencias del Comportamiento, 3 (2), 135-160. [ Links ]
Anguera, M. T., Blanco-Villaseñor, A., Hernández- Mendo, A., & Losada, J. L. (2011). Diseños observacionales: ajuste y aplicación en psicología del deporte. Cuadernos de Psicología del Deporte, 11(2), 63-76. [ Links ]
Anguera, M. T., & Hernández Mendo, A. (2013). Observational methodology in sport sciences. Observational methodology in the field of sport. E-balonmano.com: Revista de Ciencias del Deporte 9(3), 135-160. [ Links ]
Anguera, M. T., Camerino, O., Castañer, M., Sánchez- Algarra, P., & Onwuegzbuzie, A. J. (2017). The specificity of observational studies in physical activity and sports sciences: moving forward in mixed methods research and proposals for achieving quantitative and qualitative symmetry. Frontiers in psychology 8, 2196. DOI: 10.3389/fpsyg.2017.02196. [ Links ]
Anguera, M. T., Blanco-Villaseñor, A., Losada, J. L., Sánchez-Algarra, P., & Onwuegbuzie, A. J. (2018). Revisiting the difference between mixed methods and multimethods: Is it all in the name?. Quality & Quantity, 1-14.
Araújo, D. (2006). Tomada de decisão no desporto. Cruz Quebrada: Edições FMH. [ Links ]
Barth, B. (2007) The complete guide to fencing. Becks, Emil, Barth, Berndt Binding (Eds.) UK. Meyer & Meyer Sport Ltd.
Bautista, M. A., Hernández-Vela, A., Escalera, S., Igual, L., Pujol, O., Moya, J., & Anguera, M. T. (2016). A gesture recognition system for detecting behavioral patterns of ADHD. IEEE transactions on cybernetics, 46(1), 136-147. [ Links ]
Bishop, C. M. (1995). Neural networks for pattern recognition. Oxford university press.
Bradski, G. R. (1998) Computer Vision Face Tracking for Use in a Perceptual User Interface. Citeseer, pp.1-15. DOI: 10.1.1.14.7673.
Creswell, J. W., & Plano Clark, V. L. (2011). Choosing a mixed methods design. Designing and conducting mixed methods research, 53-106. [ Links ]
Czajkowski, Z. (2005). Understanding Fencing: The Unity and Practice. Staten Island, NY: SKA Swordplay Books.
Diamant, E. (2008). I'm sorry to say, but your understanding of image processing fundamentals is absolutely wrong. [ Links ]
Erdaş, Ç. B., Atasoy, I., Açıcı, K., & Oğul, H. (2016). Integrating features for accelerometer-based activity recognition. Procedia Computer Science, 98, 522-527.
Fawcett, T. (2004). ROC graphs: Notes and practical considerations for researchers. Machine learning, 31(1), 1-38. [ Links ]
Fawcett, T. (2006). An introduction to ROC analysis. Pattern recognition letters, 27(8), 861-874. [ Links ]
FIE (2017). Technical Rules for competitions.http://fie.org/fie/documents. [ Links ]
Fortmann-Roe, S. (2012) Understanding the Bias- Variance Tradeoff. Available: http://scott.fortmann-roe.com/docs/BiasVariance.html. [ Links ]
Guyon, I., & Elisseeff, A. (2006). An introduction to feature extraction. In Feature extraction (pp. 1-25). Springer, Berlin, Heidelberg.
Hlaváč, V. (2016). Classifier performance evaluation. Czech Technical University.
InvenSense (2013) MPU-6000 and MPU-6050 Product Specification Revision 3.4. https://www.invensense.com. [ Links ]
José, J.P.R. (2018). As ações táticas da esgrima em contexto competitivo: Métodos de observação de padrões temporais de ação e caracterização da variabilidade de execução. Dissertação Mestrado. (obra não publicada). Repositório UTAD. Vila Real. [ Links ]
Kim, P. (2017). MATLAB Deep Learning: With Machine Learning, Neural Networks and Artificial Intelligence. Apress. [ Links ]
Kimm, D., & Thiel, D. (2015). Hand speed measurements in boxing. Procedia Engineering 112, 502-506. DOI: 10.1016/j.proeng.2015.07.232. [ Links ]
Kivikunnas, S. (1998). Overview of process trend analysis methods and applications. In ERUDIT Workshop on Applications in Pulp and Paper Industry (pp. 395- 408). [ Links ]
Kuhn, M., & Johnson, K. (2013). Applied predictive modeling (Vol. 26). New York: Springer.
Lara, O. D., & Labrador, M. A. (2013). A survey on human activity recognition using wearable sensors. IEEE Communications Surveys and Tutorials, 15(3), 1192-1209. [ Links ]
Malawski, F., & Kwolek, B. (2016). Classification of basic footwork in fencing using accelerometer. measurements, 6, 20. [ Links ]
Mathworks (2017) Global Optimization Toolbox: User’sGuide (r2017a).
Polak, E., Kulasa, J., VencesBrito, A., Castro, M. A., & Fernandes, O. (2015). Motion analysis systems as optimization training tools in combat sports and martial arts. Revista de Artes Marciales Asiáticas, 10(2), 105-123. [ Links ]
Portell, M., Anguera, M. T., Chacón-Moscoso, S., & Sanduvete-Chaves, S. (2015). Guidelines for reporting evaluations based on observational methodology. Psicothema, 27(3), 283-289. [ Links ]
Powers, D.M. (2011). Evaluation: from precision, recall and F-measure to ROC, informedness, markedness and correlation. International Journal of Machine Learning Technology 2, 37-63. [ Links ]
Preece, S., Goulermas, J. Y., Kenney, L. P., & Howard, D. (2009). A comparison of feature extraction methods for the classification of dynamic activities from accelerometer data. IEEE Transactions on Biomedical Engineering, 56, 871-879. [ Links ]
Ratanamahatana, C. A. and Keogh, E. (2004). Everything you know about dynamic time warping is wrong. In 3rd Workshop on Mining Temporal and Sequential Data, in conjunction with10th ACM SIGKDD Int. Conf. Knowledge Discovery and Data Mining (KDD-2004) (Seattle, WA: Citeseer).
Reyes, M., Dominguez, G., & Escalera, S. (2011). Featureweighting in dynamic timewarping for gesture recognition in depth data. In Computer Vision Workshops (ICCV Workshops), 2011 IEEE International Conference on (pp. 1182-1188). IEEE. [ Links ]
Rojas, R. (1996). Neural networks: a systematic introduction (Berlin, Heidelberg: Springer-Verlag). DOI: 10.1007/978-3-642-61068-4. [ Links ]
Sammut, C. & Webb, G. I. (2017). Encyclopedia of machine learning and data mining (New York: Springer Publishing Company, Incorporated). [ Links ]
Saucedo, M. F. (2000). Deporte: Mecánica, Táctica o Metodología. [ Links ] I Congreso de la Asociación Española de Ciencias del Deporte. Cáceres.
Tang, J., Cheng, H., Zhao, Y., and Guo, H. (2018). Structured dynamic time warping for continuous hand trajectory gesture recognition. Pattern Recognition 80, 21-31. DOI: 10.1016/j.patcog.2018.02.011.
Tarragó, R., Iglesias, X., Michavila, J. J., Chaverri, D., Ruiz-Sanchis, L., & Anguera, M. T. (2015). Análisis de patrones en asaltos de espada de alto nivel. Cuadernos de Psicología del Deporte,15(1), 151-160. [ Links ]
Taylor, C., Michie, D., & Spiegalhalter, D. (1994) Machine Learning, Neural and Statistical Classification. Ellis Horward Series in Artifical Intelligence 1994, New York. [ Links ] ISBN 0-13-106360- X.
Torrents, C. (2005). La teoría de los sistemas dinámicos y el entrenamiento deportivo. Unpublished. Doctoral dissertation. INEFC. Universidad Barcelona, Lleida.
Unity® (2017). Technologies, Unity. https://unity3d.com/ [ Links ]
Vital, J. P. M. (2015). Análise do movimento humano: classificação temporal de ações humanas (Doctoral dissertation). [ Links ]
Acknowledgments:
We are grateful for the support of the Spanish Government’s projects: The role of physical activity and sport in the promotion of healthy lifestyle babits: The evaluation of sport behaviour using non-intrusive methods (Secretary of State for Research, Development and Innovation of the Ministry of Economy and Competitiveness) during the period 2016-2018 [DEP2015-66069-P; MINE-CO / FEDER, EU]. This work has been partially supported by the Spanish project TIN2016-74946-P (MINECO/FEDER, EU) and CERCA Programme/Generalitat de Catalunya.
We also thank the collaboration of Fencing Master João José and fencer Hugo Morais who have made themselves available for the different phases of this work.
Conflict of interests: Nothing to declare.
Funding: Nothing to declare.
Manuscript received at October 20th 2018; Accepted at December 19th 2018
[*]Corresponding author: Email: catpixels.studios@gmail.com

