Services on Demand
Journal
Article
Indicators
-
 Cited by SciELO
 -
 Access statistics
Related links
-
 Similars in
SciELO
Share
Revista Encontros Científicos - Tourism & Management Studies
Print version ISSN 1646-2408
Encontros Científicos no.5 Faro 2009
Features and significance of the value-based method for quantitative measurement of competitiveness in tourism
Ventsislav Statev
PhD Assistant Professor at the Faculty of Economics
St Cyril and St Methodius University of Veliko Turnovo, Bulgaria
ABSTRACT
The small and medium tourist enterprises managers, while estimating the expected future profits, should take into account not only firm competitiveness, but also regional competitiveness and the competitiveness of the country as a tourist destination.
Not only are Bulgarian scientists improving the already existing models, but they also aim at developing their own original models as a result of the analysis of the development of the tourism sector under the present conditions in Bulgaria. The present article aims at drawing the attention of the readership to three Bulgarian models for competitiveness, which comprise the main sections of the analysis of competitiveness (model 1: regional level, model 2: municipal level, model 3: firm level). The foregoing models involve either analysis of the quantity indicators, or analysis of the quality indicators or analysis of both the quantity and quality indicators. The application of the models results in defining general comparative indicators of competitiveness.
The article is focused on the prospects for including the measurement of the weight of each of the quantity indicators through the application of the value-based method while measuring the general comparative indicators taking into account quantity indicators as well. A computational comparison of the statistical data from Marinov’s model, based on both the application and the exclusion of the value-based method, is provided as an illustration.
Keywords: Competitiveness, Models, Quantity Indicators, Tourism, Value-Based Method.
Caracteristicas e significado do “value-based method” para a medição quantitativa da competitividade no turismo
RESUMO
Na estimativa dos lucros esperados, os gestores de pequenas e médias empresas deveriam ter em conta não apenas a competitividade da empresa mas também, entre outros aspectos, a competitividade regional e a competitividade do país enquanto destino turístico.
Os investigadores búlgaros estão não só melhorando os modelos existentes, mas ao mesmo tempo desenvolvendo os seus próprios modelos originais em consequência da análise do desenvolvimento do sector turístico nas condições actuais na Bulgária. O presente artigo tem por objectivo chamar a atenção para três modelos búlgaros de competitividade, que incluem as principais secções da análise da competitividade (modelo 1: nível regional, modelo 2: nível municipal, modelo 3: nível da empresa). Os modelos antecedentes abrangem tanto a análise dos indicadores quantitativos, como a análise dos indicadores de qualidade ou a análise de ambos, ou seja, dos indicadores de quantidade e de qualidade. A aplicação dos modelos resulta na definição dos indicadores gerais de comparação da competitividade.
O artigo concentra-se nas probabilidades de inclusão da medição do peso de cada um dos indicadores quantitativos através da aplicação do método baseado no valor (value-based method) para a medição dos indicadores comparativos gerais considerando igualmente os indicadores quantitativos. Uma comparação computacional dos dados estatísticos do modelo de Marinov, baseada em ambas as aplicações e na exclusão do método baseado no valor, é fornecida como exemplo ilustrativo.
Palavras-Chave: Competitividade, Modelos, Indicadores Quantitativos, Turismo, Método Baseado no Valor.
1. INTRODUCTION
Having preferred to develop manufacturing and trade in a given sector, in which the relative share of private property often exceeds 90%, tourist entrepreneurs are simply forced to deal with accurate and expedient information for the surrounding competitiveness. What is typical of this surrounding competitiveness is that in the course of time it is getting more and more complicated to analyze. And to a great extent the efficiency of the process of successful decision-making in the field of management depends on the accurate measurement of the surrounding competitiveness.
One of the reasons for the analysis to get more and more complicated is, for example, the significant increase in the influence of some public institutions, that haven’t been such an important factor so far, on the regional business activity. The decentralization of municipalities in Bulgaria provides a relevant example. The development of the local economy and the process of balance-formation in the sector structure depend on the adequacy of the decisions made by the local authorities (the municipal government, the town council). Thus, for example, the town of Veliko Turnovo, located in Bulgaria, widely promoted as a centre of cultural tourism and an ancient capital of the Republic of Bulgaria, according to the introduced strategic papers is confined to the sector of tourism mainly. However, it turns out that the building sector wins over because of the higher profit rate it reaches. It’s unnecessary to apply statistical data analysis to support the rampant development of that sector. The rapid and unattractive overbuilding of the whole territory of Veliko Turnovo provides a relevant example.
On the one hand, this fact exerts positive influence on the increase in the municipal revenue from taxes on real estate and the possibility for some of these funds to be properly used by the municipal government with the purpose of supporting the development of tourism in the region. On the other hand, however, this fact has a negative impact on the development of urban tourism because of the destruction and devastation of the local natural and anthropogenic resources and particularly the original planning and architecture of the ancient capital of Bulgaria. The immediate result of this devastation is the decrease in the town’s potential for intense cultural and cognitive tourism which often lacks proper development and decent appreciation (Markov and Statev, 2006, p. 56).
In the context of these considerations, the owner of a guest-house or the different hierarchy-level managers of any big hotel in Veliko Turnovo, i.e. the small and medium tourist enterprises managers (including the null size group) while analyzing the expected future profits, should take into account not only firm competitiveness, but also regional competitiveness, the competitiveness of the country as a tourist destination, etc. These considerations stand vice versa, too. If one of the elements of the system does not function well, it will significantly reflect on the other elements regardless of their position in the hierarchy level. Hence the foregoing entrepreneurs in the field of tourism are supposed to use in the analysis of their activity a suitable model or models of competitiveness which provide applicable and adequate output information that corresponds to their needs and peculiarities. The marked interest of the scientific and public sectors in these issues compensates the insufficient scientific and analytical potential of the foregoing size groups and results in developing and improving of the scientific models that aim at measuring competitiveness.
2. BULGARIAN MODELS FOR ANALYSIS OF COMPETITIVENESS
Not only are Bulgarian scientists improving the already existing models, but they also aim at developing their own original models which turn to be a result of the analysis of the development of the tourism sector under the present conditions in Bulgaria. These models have a different scope and degree of complexity. This complexity results from the application of the received results as well as from the prospects for a wider group of people, professionally involved in the field of tourism, to apply these results while solving current problems.
The present article is aimed at drawing the attention of the readership to three Bulgarian models for competitiveness measurement. According to the author, these models, when analyzed as a whole, comprise the main sections of the analysis of competitiveness that an entrepreneur (running a small or medium tourist enterprise) whose long-term business is related to this sector, needs in order to follow actively his competitiveness as far as possible. The models, introduced below, are not only presented in a system, but also revealed as unique patterns having their own shades of meaning, different scope and subject of research, namely: first model: regional level (national destinations), second model: municipal level, third model: firm (microeconomic) level.
2.1 FIRST MODEL
Stoyan Marinov is the author of the first model for analysis of competitiveness (Marinov, 2006, pp 93-95). In the full version of the scientific report the author introduces a marketing model for the competitiveness management of Bulgaria as a tourist destination on the basis of comparison with other tourist destinations such as Greece, Romania, Turkey and Croatia.
According to the methodology developed by Marinov:
2.1.1. 18 quantity indicators measuring the tourist destination performance on the international market are a subject of analysis. One of the basic criteria for these indicators to be chosen is the fact that they are supported by the latest statistical data provided by reliable international sources. The 18 indicators, defined by Marinov, are shown in table no. 1.
Table 1 - Indicators of quantitative measurement of the competitiveness of a tourist destination
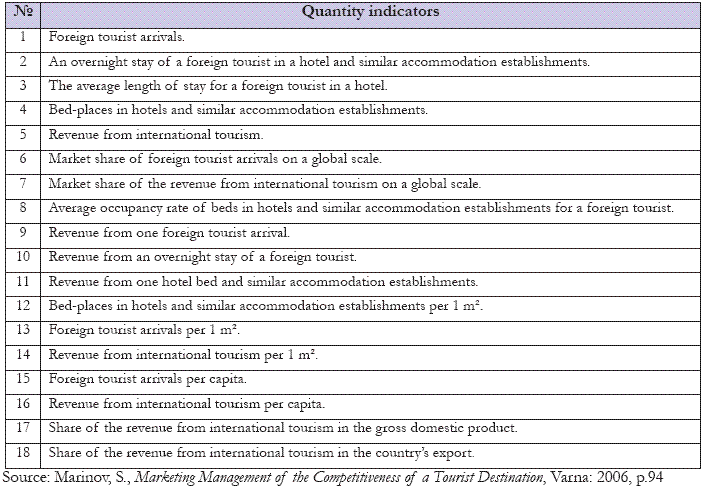
Marinov supports Doganov (Doganov, 2000, p. 101) in saying that the initial collection of statistical data, concerning the foregoing indicators, should be done in a ‘documentary-and-descriptive form’. Thus secondary sources of information such as statistical year-books and data from specialized researches are used.
2.1.2. The author suggests computing of individual indices of competitiveness for each of the competing tourist destinations so that the indicators can be compared. When the competitors are already surveyed, the tourist destination, having the highest value of the given indicator, is granted the index base of 100. The indices of the other tourist destinations are computed as a ratio between the values of the comparative indicators and the given index base.
Marinov suggests the computing of a common integral quantity index, based on the indices of the separate indicators, in compliance with the following equation:
IQC=(IaC+ IbC+ IcC+ IdC+ IeC+ IfC+ IgC +IhC+ IiC+ IjC+ IkC+ IlC+ ImC+ InC+ IoC +IpC +IqC+ IrC)/18 (1)
where:
IQC - common integral quantity index of a destination C as IQC Є (0,100);
IaC+ IbC +…. IrC - quantity indices of a country С based on the indicators a; b;…r;
Following the given common integral quantity index, the author gives arguments for the possible conclusion-making regarding the competitiveness of a tourist destination per years as well as per different periods of time.
2.1.3. Apart from quantity indicators, in the course of analysis of the competitiveness of a tourist destination, quality indicators are introduced as well which demonstrate the typical destination features and lay the fundamentals of a country’s competitive capacity. After discussing the problem with experts from different sector organizations, tourism associations, local tourism organizations, etc., Marinov comes to the conclusion that it’s hard to form a uniform system of quality criteria and indicators mesuring the competitiveness of a tourist destination. Each of the criteria for competitiveness measurement refers to a different number of indicators which can be used for measuring. According to this model, on the level of a tourist destination, the quality indicators can be summed up in the following group of criteria:
· tourist resources;
· material and technical resources;
· public sector;
· private sector;
· tourism industry cluster;
· marketing components;
· input resources.
Each criterion has a different number of subcriteria. The author makes provision for the values of the indicators of qualitative measurement of competitiveness to be determined through the application of the value-based method.
2.2 SECOND MODEL
The second model for analysis of competitiveness is a part of the scientific-and-research project of the Institute of Economics at the Bulgarian Academy of Sciences (BAS), called Monitoring of the social, economic and environmental differences between municipalities in Bulgaria between 2000 and 2002 (Yankova, 2005, p. 3). The project is predominantly aimed at measuring the level of social and economic development of municipalities in Bulgaria between 2000 and 2002. According to the developed model, the factors used for measuring the competitiveness of municipalities, are:
· the natural and anthropogenic potential;
· the level of social and economic development;
· the human development (Yankova, 2005, p. 15)
The final values of the examined indicators serve for the municipalities rating and classifying. This measuring enables comparisons with previous periods as well as conclusion-making for the emerging trends and problems. The taxonomic method, used nowadays in mathematics and statistics, serves mainly for achieving the initially set objectives (Yankova, 2005, p. 5).
In compliance with the outlined methodology, municipalities are presented as multidimensional objects which are compared to an imaginary municipality characterized by extreme (maximum or minimum) values of the separate indicators. The applied method is based upon the principle of clustering and it refers to the mathematically determined methods which provide a quantitative measurement of similarities.
According to the analytical expression of the taxonomic method, the set of m multidimensional objects, each of them characterized by n indicators, is a subject of analysis (Yankova., 2005, pp 19-20). The following type of analytical matrix is to be drawn:
 (2)
(2)
where:
Xij - the value of the j indicator for the i object.
The most commonly examined indicators are measured in different units as they are standardized in order to be properly compared. Thus the following formula is used:
 (3)
(3)
where: 

The J set of applied indicators is divided into two subsets: J1 subset of stimulating indicators and J2 subset of restraining indicators. This grouping enables the formation of an abstract entity, called ‘standard ’, its co-ordinates being determined by:
Zoj = max Zij for j from J1 (6)
Zoj = max Zij for j from J2 (7)
According to the outlined values, the distance between the i multidimensional object and the ‘standard ’is determined by the following formula:

In compliance with the defined Ci0 distances, the di taxonomic measure indicator is determined by:

where:
![]()


The method of formation of the C0 rate they can exceed 1 as long as the objects tend to suffer a sharp drop. The closer to the standard the object is, i.e. when the taxonomic measure indicator has a lower value, the higher its position in the hierarchy is.
According to the outlined methodology, the taxonomic method is applied two times, namely:
2.2.1. The taxonomic method is applied for measuring the separate aspects of the development of municipalities, namely:
· the economic status;
· the local finance;
· the social status of the municipality;
· the rate of unemployment;
· the infrastructure;
· any change in the number of the municipality citizens
which results in the formation of the corresponding general evaluations (Yankova, 2005, pp 3-4).
2.2.2. Thus the formation of the integral evaluation, which characterizes the level of social and economic development of any given municipality, is based upon the general evaluations and the application of the taxonomic method as well. Both the integral and the general evaluations vary from 0 to 1 as only those municipalities which suffer a sharp drop in their development take values exceeding 1.
2.2.3. The determining of an integral evaluation per years regarding the period between 2000 and 2002 enables the formation of the corresponding transformed evaluations. The average transformed evaluation for the surveyed period is based on those values. The different values of the average transformed integral evaluation characterize the different levels of social and economic development of municipalities.
2.3 THIRD MODEL
The third model is associated with the name of Manol Ribov who is the author of the concise theory of the tourist product quality and the management of competitiveness in tourism1.
In an attempt to make his method more specific, Ribov analyzes the specific hotel features and determines the main groups of indicators of qualitative measurement of competitiveness (Marinov, 2006, p.58) 2 , namely:
· Basic characteristics: location, the main services provided, the extra services offered, human resources, hotel infrastructure, working conditions;
· Place of service: building architecture and construction, equipment and furniture;
· Surroundings: hotel infrastructure, general infrastructure, green and water areas;
· Urban environment: cultural and historical monuments, green and water areas, recreation and sports facilities, industrial and tourist objects as well as business centres, transport and postal services, which can be classified as: superstructure, nomenclature and assortment, quality, price, catering, working conditions, time of service, place of service, staff image and customers treatment, tourist infrastructure, sights and environmentalism.
According to the author, the generalized complex indicator, measuring the hotel product competitiveness, is based on the indicators mentioned above.
2.4 CONCLUSIONS FROM THE ANALYSIS OF THE METHODS
There are several conclusions, which can be drawn from the analysis of the methods examined above:
· either quantity indicators (the second model) only or quality indicators (the third model) or both types of indicators (the first model) can be applied in the analysis of competitiveness;
· no agreement regarding the uniform application of indicators in standard situations (no matter whether quality or quantity indicators) is reached;
· in the course of the complex analysis of the indicators measuring competitiveness, one method used for defining an average general evaluation, can be successfully applied several times;
· most of the quality indicators are enough generally determined which provides possibilities for their differing and grading in compliance with the characteristics of the analyzed segment of the tourism sector and the application of the value-based method;
· to a great extent the choice of quality indicators depends on the opportunities for providing reliable and permanently updated statistical data;
· the substitution of quality indicators with their corresponding quantity indicators does not seem to have significant impact on the extreme mean quantity values of competitiveness (Yankova, 2005, p.5). This enables transformation of the final results from the models, using quality indicators only, into quantity results which can be applied even in models of competitiveness using both types /i.e. a quality indicator from a given model is transformed into a quantity indicator thus becoming a part of the quantity not the quality section of the model /;
· the output results from a given model of competitiveness /mainly models using only one type of indicators/ can be successfully applied in models using both types of indicators.
These conclusions, discussed in the context of the already introduced model which requires measurement of the weight of each of the quantity indicators in the computation of the common integral quantity index in the first model (Markov and Statev, 2006, p.58), support the possibility for including the value-based method in the given context. According to the author, the application of the value-based method would contribute to achieving:
· higher accuracy when determining the common integral index;
· additional model flexibility;
· higher degree of uniformity and effectiveness of the model when used in the analysis of the different hierarchy levels;
· application of the final results from one model as output results in other models of competitiveness;
· partial difficulty management when providing reliable statistical data to meet the needs of a particular case from the field of tourism, i.e. indicators which are not supported by confirmed statistical data, will play a less significant role.
3. APPLICATION OF THE VALUE-BASED METHOD IN THE ANALYSIS OF THE QUANTITY INDICATORS
Pricing (including tourist product pricing used for determining its competitiveness: Stoyanov and Ribov’s model) is one of the fields in which the value-based method is widely applied.
In Pehlivanov’s view ‘though the application of this method involves processing of significant amount of information together with the use of the knowledge of highly-qualified experts: experts in theory and practice, representatives of manufacturing enterprises and customers, the final results are good enough for subjectivism to be overcome in the process of pricing’ (Pehlivanov et al, 1992, p.52).
The foregoing considerations, applied in the field of tourism, reshaped in compliance with the conclusions drawn above together with the suggestion put forward, support the prospects for successful application of the value-based method measuring the weight of the quantity indicators in the tourism sector. The application of the method in this part of the analysis will facilitate the representatives of the small and medium enterprises in determining the competitiveness of the tourist enterprises they run. This facilitation results from the fact that the method gives opportunity:
· for choosing among the variety of available quantity indicators only those which most accurately characterize the manufacturing or business activity;
· for measuring the weight of these indicators again in compliance with the essence of the activity which would enable the use of some already developed and to a certain extent standardized scientific models;
· for successful application of the theoretical knowledge and professional experience of the people involved in the small and medium enterprises regarded as ‘highly-qualified experts’;
· for increase in the costs (if there are any costs at all) for foreign consulting services;
· for better planning of the financial flows and the investment program;
· for change in the scope (regional, intra-firm, etc.) as well as in the segmentation of the performed analysis in reference to the target groups: for example, the target group of a hotel, involved in international import tourism, is that of German tourists who can choose between destinations which compete with Bulgaria for cultural tourism: for example Greece or Turkey and the target group of the same hotel only, this time for domestic cultural tourism only: one can choose between the municipality of Veliko Turnovo and the municipality of Plovdiv. One of the differences between the target groups results from the income level of the tourists who have different nationalities.
To a great extent the use of the outlined options ensures compliance with the implementation of the main requirement, defined by Pehlivanov, regarding the application of the value-based method, namely the right choice and the adequate representativeness of the indicators which influence the formation of the tourist enterprise competitiveness (in compliance with the considerations in the present article) and the weight attached to these indicators. Pehlivanov applies the following expression of the value-based method in the process of pricing:
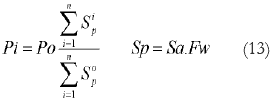
where:
Pi - the price of the new product;
P0 - the price of the base product;
Sip и S0p - the corresponding provisional ranking score quantity values for the indicators of the new product and the base product;
Sa - the actual number of scores;
Fw - the weight factor of the scores of the different indicators.
The transformation of (13) according to the arguments in (1) follows the algorithm: the actual number of scores Sa includes the corresponding values of the quantity indicators of a country C- a; b;…r/n. Fw is the corresponding weight of the quantity indicator. The value of the provisional ranking scores S0p is the weighed quantity index a; b;…r/n. The tourist destination having the highest value of the respective indicator and granted the index base of 100, 00 according to Marinov’s model, is taken for a base product Sip. When there is regularity in the analysis of competitiveness, based on a certain quantity indicator, the computed value for the previous period occupies the position of P0 - the price of the base product, i.e. the weighed common integral index will be computed in compliance with the following formula:
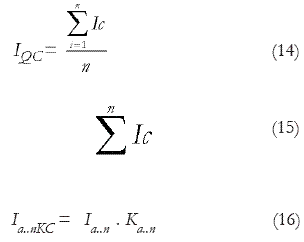

where:
IQC - common weighed integral quantity index of a destination C as IQC Є (0,100);
Ia..nC - quantity indices of a country С in a comparative form, based on the indicators a; b;…n;
Ia..n100 - value of the respective indicator a…n, being the highest one in comparison with the values of the considered competitors after being weighed;
Ia..n - absolute value of the respective quantity indicator a…n;
Ka..n - weight of the respective quantity indicator a…n;
Ia..nKC - weighed respective quantity indicator Ia..n, its respective weight being Ka..n;
Ia..n/rC0 - weighed integral quantity indicator of a destination C for a previous period.
The present article should provide an example of the empirical application of the value-based method in the analysis of the quantity indicators of competitiveness. Due to the altogether conceptual style of the present article, the data from Marinov’s model should serve as a source of output information.
The 18 quantity indicators, analyzed by Marinov, will be reduced to 9 so as for the Table 2, given to provide more succinct information. In terms of the specific features of relatively small destinations as well as in terms of the private sector (small and medium enterprises) the indicators, measuring the competitiveness of the five competing countries: Bulgaria, Greece, Croatia, Turkey and Romania, shown in Table 2, will be hypothetically analyzed.
Table 2 - Quantity indicators measuring the competitiveness of Bulgaria, Greece, Croatia, Turkey and Romania
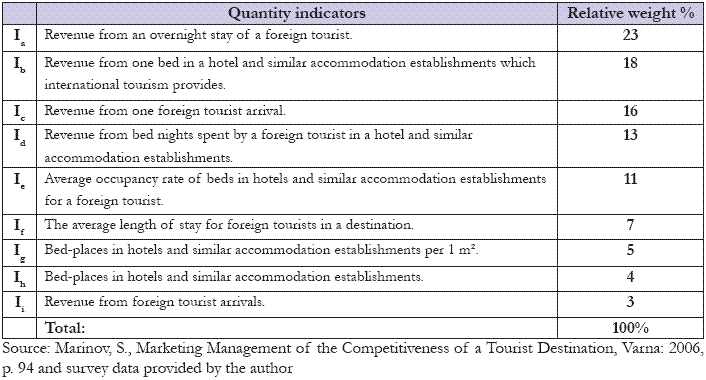
The values of the indicators Ia..nKC, outlined in Tables 3-7, are weighed in compliance with the relative weight, given in Table 2.
Table 3 - Weighed quantity indicators of the competitiveness of the Republic of Greece for 5 years1
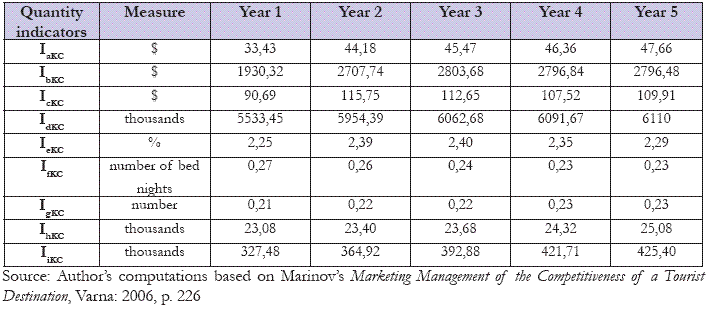
Table 4 - Weighed quantity indicators of the competitiveness of the Republic of Romania for 5 years
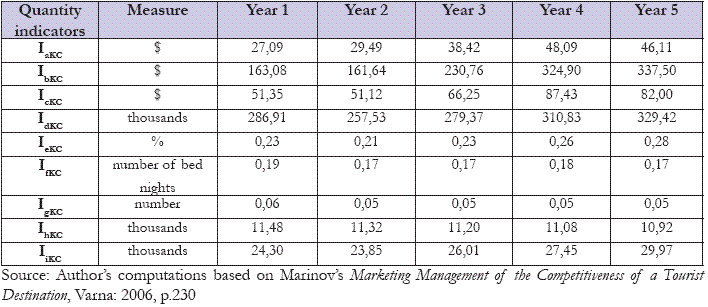
Table 5 - Weighed quantity indicators of the competitiveness of the Republic of Turkey for 5 years
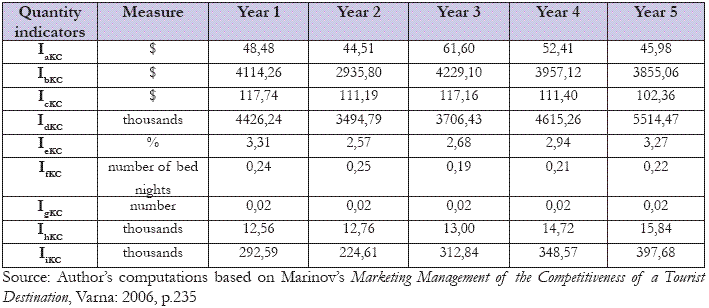
Table 6 - Weighed quantity indicators of the competitiveness of the Republic of Croatia for 5 years
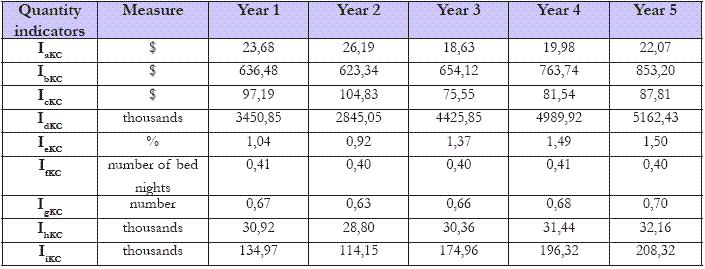
Table 7 - Weighed quantity indicators of the competitiveness of the Republic of Bulgaria for 5 years
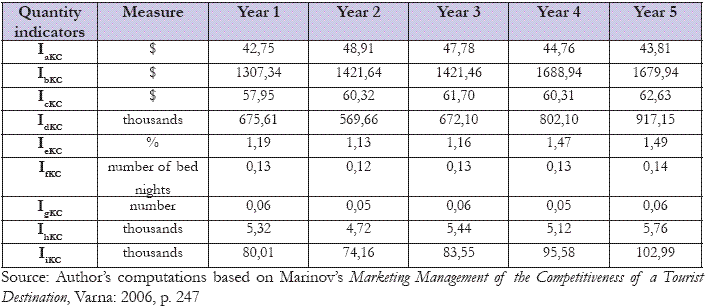
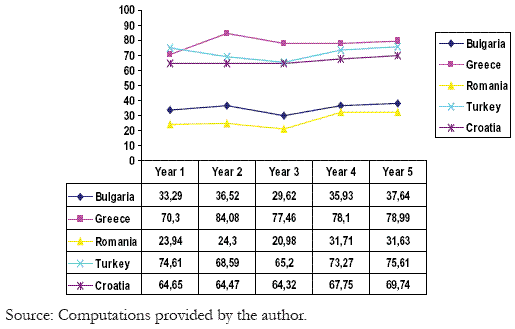
The computation of the quantity indices (these computations are not provided in the present article) for a country C in the comparative form Ia..iC is followed by the computation of the common weighed integral quantity index IQ for the different destinations /figure no. 1/. When certain regularity in the research is followed, according to (17), Ia..iC is regarded as Ia..nC0.
Figure 1 - Integral quantity indicators of the competitiveness of the given countries /through the application of the value-based method
The integral quantity indices of competitiveness are graphically displayed in Figure 2 as the value-based method is not applied.
Figure 2 - Integral quantity indicators of the competitiveness of the given countries/not involving the application of the value-based method
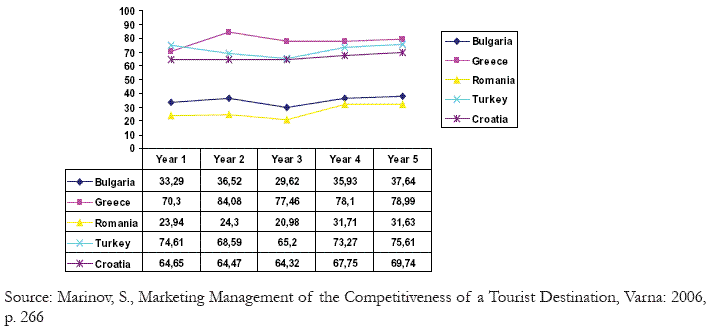
The analysis of Figure 1 and Figure 2 leads to the following conclusions which serve as an illustration:
1. When more weight is attached to the revenue from international import tourism generated by entrepreneurs in the tourism sector, Turkey dominates over Croatia; when there is a change in the weights of the different indicators, it may turn out that Croatian tourist entrepreneurs, unlike their Turkish rivals, have reacted more adequately to the specific economic characteristics of the sector and its involvement with the situation in the tourism-related sectors;
2. Towards the end of the examined illustrative period, the integral quantity indices measuring the competitiveness of Greece, Croatia and Turkey, on the one hand, reach very close values /in the interval 70-79 points/. On the other hand, Bulgaria and Romania reach such values /in the interval 32-38 points/; during other periods of time which illustrate situational changes /of regional significance for instance-the period before Bulgaria and Romania’s accession to the European Union and after the recognition of the two countries as member states or the duration and the effects of the world economic crisis and their impact on the development of the tourism sector in the countries which are compared/, the change in the indices will be indicative of the adequacy of the political measures which aim to reinforce the economic development, especially that one, in the sector of tourism.
3. In terms of arrivals and generated revenue, Romania is getting really close to Bulgaria as any possible rapid economic rise of our northern neighbour could make Bulgaria occupy the last position in terms of competitiveness as long as regular research on competing destinations is provided.
4. The foregoing conclusions illustrate the analysis on a regional level, which involves application of Marinov’s model only / model 1/. It is necessary to note that there is a difference between the discussed competing countries in terms of the peculiarities of their activities which cannot be completely covered by the standard statistics /i.e. quantity indicators in their absolute form/. Thus for instance a high-quality hotel in Turkey offers tourist services at lower prices as compared to the prices of lower-quality hotels in Bulgaria. Moreover, high-quality hotels in Bulgaria are chosen mainly by tourists from the West European countries /incoming international tourism/, which belong to a lower income group /in terms of hierarchy level, not income level/ as compared to the analyzed group of Bulgarians /national tourism/ in the same hotels. These ‘irregularities’ can be compensated by the application of quality indicators transformed into quantity indicators from the third model in the quantity section of the first model. The possibility for giving weights to the indicators provides additional flexibility.
5. In the analysis of competitiveness on a municipal level, the entrepreneurs in the field of tourism can compare their own competitiveness with that of other entrepreneurs from other municipalities using the final results from the model based on the taxonomic method /the final results from the second model are used as output results in the first model/. These final results are included as quantity indicators in Marinov’s model /using both quality and quantity indicators/, as suitable weights are applied. While comparing the tourist activity in two municipalities focused on the development of marine mass tourism for instance, one of the municipalities may have better reputation than the other ones, which gives certain ‘credit’ to the entrepreneurs involved in the development of tourism in that municipality. Thus for instance, a hotel-keeper from a municipality having ‘high credit rating’ /according to the analyzed group of tourists/, can perform worse as compared to another hotel-keeper from a municipality having ‘lower credit rating’ which can result in higher income for the person showing low working performance and lower income for the person showing high working performance only because the first municipality is more attractive than the second one.
4. CONCLUSION
The possibility for weighing the different quantity indicators is a prerequisite for the private entrepreneurs, the central and local authorities, the sector organizations, the international analysts, etc. to receive more accurate results when determining the specific objectives, lying in their researches.
This step would lead to accurate decision-making in management and initiation of successful management policy, especially under the present conditions in Bulgaria, since the rampant overbuilding of Bulgarian resorts and towns as well, will seriously impede tourism development due to the lack of adequate and practical methodologies for analysis.
The different methodologies for computation of the integral indices of competitiveness, introduced in the article, seem to be a challenge in reference to the entrepreneurs running small and medium enterprises in the field of tourism. The opportunities, offered by the Microsoft Excel and Access software products, serve as a prerequisite for the solution to this problem. Their application involves only initial input of more intense creative work for the development of the respective tables and the inclusion of the respective formulae and correlations. The rest of it depends on the updating of the values of the examined indicators and the adequacy of the analysis.
ENDNOTES
1The present article is focused on that part of Ribov’s method which is particularly relevant to the main idea of the author.
2 S. Marinov’s arguments are based on two of Manol Ribov’s articles, namely: Tourism in the Age of Quality, Sofia, 2003, pp 527-544 and Management of Competitiveness in Tourism, Sofia, 2003, p. 582
3 Marinov’s analysis of the indicators refers to the period between 1990 and 2002. The present article covers the period between 1998 and 2002 with the aim of illustrating the results of both the application and the exclusion of the value-based method.
BIBLIOGRAPHY
Doganov, D. (2000): Marketing in Tourism, second edition, Sofia. [ Links ]
Marinov, S. (2006): Marketing Management of the Competitiveness of a Tourist Destination, Slavena,Varna.
Markov, I., Statev, V. (2006): Regional Competitiveness of a Tourist Destination Veliko Turnovo, The 28th Exhibition of Tourism and Leisure Time, a collection of reports on Competitiveness of the Tourist Destinations in Southeastern Europe, Slavena, Varna.
Ministry of Tourism of the Republic Croatia (2001): Croatian tourism in Figures 2000.
Ministry of Tourism (2004): Greek National Tourism Organization, http://www.gnto.gr/, jully, 2004.
Pehlivanov, V., Grivekov, D., Yordanov, Y. (1992): Prices and Price Policy, Galaktika, Varna.
Ribov, M. (2003): Management of Competitiveness in Tourism, Sofia.
Romania. Factbook 2003. Tourism, http://www.factbook.ro/countryreports/ro/Ro_tourism.htm, august 2003.
TURSAB. Facts and Figures, http://www.tursab.org.tr/english/engrapor.htm, 19 august, 2003.
WTO, Yearbook of Tourism in Statistics, Vol. I, 45-53, Ed. Madrid 1993-2002.
Yankova, N. (2005): Differences in the Development and Competitiveness of Municipalities in Bulgaria between 2000 and 2002, Economic Researches, year XIV, Book 3, Sofia.
Recebido: 03.09.2009; Aceite: 06.10.2009


