


Servicios Personalizados
Revista
Articulo
 Inglés (pdf)
 Articulo en XML
 Referencias del artículo
 Enviar articulo por email
Indicadores
-
 Citado por SciELO
 -
 Accesos
Links relacionados
-
 Similares en
SciELO
Similares en
SciELO
Compartir

 Permalink
Observatorio (OBS*)
versión On-line ISSN 1646-5954
OBS* vol.10 no.1 Lisboa ene. 2016
Influence of the graphical layout of television news on the viewers: An eye tracking study
Rui Rodrigues *, Ana Veloso **, Óscar Mealha ***
* Professor Adjunto Convidado. Instituto Superior Miguel Torga, Largo da Cruz de Celas, 1 3000-132 Coimbra (ruipcrodrigues@gmail.com).
** Professora Auxiliar. Universidade de Aveiro, Departamento de Comunicação e Arte, Campus de Santiago, 3810-193 Aveiro (aiv@ua.pt).
***Professor Associado com agregação. Universidade de Aveiro, Departamento de Comunicação e Arte, Campus de Santiago, 3810-193 Aveiro (oem@ua.pt).
ABSTRACT
Television news has continuously experienced several changes, especially related to graphic overlays. The problem with watching TV news is the way viewers receive and process information broadcast by these programmes, given the variety of visual and audio stimuli with which they are confronted. This study focuses on the influence of the graphical layout on the viewers. Specifically, it examines message recall related to TV news. These goals were achieved by means of a case study using eye tracking, applied in two types of TV news broadcasts: one with graphical elements and another with a clean feed (only with the anchor). Finally, participants answered a questionnaire on the contents within the various graphical elements overlaid on the TV news viewed.
Keywords: Television News, eye tracking, graphical layout, attention.
Introduction
The understanding of how TV viewers receive and process the information contained in a news story has received far less attention than one might have expected of an information based society (Bergen et al., 2005; Drew and Grimes, 1987; Fox, 2004; Grimes, 1991; Josephson and Holmes, 2006; Reese, 1983).
Several authors (Bergen et al., 2005; Drew and Grimes, 1987; Fox, 2004; Grimes, 1991) have studied message distribution and processing in the last 30 years. In a TV context viewers deal with the reception of complex stimuli, which can either complicate or support the decoding of multiple messages. Nevertheless, little is known about the consequences of these changes in viewers’ attention and their visual and audio processing, or about the impact they have on the quality of information reception.
The research findings in this area are far from convergent and therefore further investigation on TV news is necessary, specifically because graphics are a reality that will endure (McClellan and Kerschbaumer, 2001). The visual composition considered in this study includes several elements such as ticker, over the shoulder, station logo, lower thirds, the anchor, the news story as well as the TV studio’s entire physical space, which in some situations is considered in the background. According to Josephson and Holmes (2002), in this area the use of eye tracking can be very important for the study of TV news.
Eye tracking technology allows the detection and recording of viewers’ eye movements in a specific visual environment. Technically, eye tracking records the (visual) behaviour of a user through an infrared beam directed to the eyes, which causes a reflection in the pupil, and is then captured with a sensor that calculates exactly where the person is looking at (Duchowski, 2007).
Studies related with eye movements had a very close connection with the development of eye tracking technology. These studies began to be developed more than a century ago, more specifically in 1878 by Louis Javal. Javal noted that reading was not linear, but through a series of short breaks and saccades (Jacob & Karn, 2003). Through these concepts Dodge & Cline, in 1901, developed the first non-invasive techniques. These techniques used lights that were reflected by the cornea of the human eye (Jacob & Karn, 2003). Until the 70s, other techniques were improved and other equipment were developed. However, thanks to the significant advancement of digital technologies and image processing in the 70s (Richardson & Spivey, 2004), eye tracking became a more influential tool in several scientific areas, as was the case of cognitive psychology. These researchers began to relate the data obtained from eye tracking with cognitive activities (Jacob & Karn, 2003). Until now, many developments have been made, but much of the technological advancements during this time are still applied in modern eye tracking equipment.
Today, eye tracking is frequently used as an analysis tool in areas such as psychology (Gredebäck et al., 2009; Heuer and Hallowell, 2009), audio-visuals (Marchant et al., 2009), video games (Alkan and Cagiltay, 2007; El-Nasr and Yan, 2006), but essentially it is employed in usability studies applied to the web or user interfaces (Fleetwood and Byrne, 2006; Josephson, 2008; Kammerer and Gerjets, 2011). This multiplicity of uses allows eye tracking to be a relevant instrument in the evaluation of both human behaviour and user interaction with a specific product or service. The inclusion of eye tracking is relevant to observe and analyse not only the final result as well as the entire process. In the context of this study eye tracking is a crucial technology that clarifies the influence of visual composition on the decoding of messages conveyed in TV news.
Literature review
Television news programmes have seen significant changes over the last few years. One of the most important changes has been in the scenography used in TV newsrooms, which today have been transformed into a large stage of images and icons. Another important change is the introduction of on-screen graphic elements (oracles, cookies, tickers) during news broadcasts, thereby creating new ways of conveying information. This information reception context has increased in complexity and visual stimuli are variously presented in visual space and in most situations, and simultaneously. The commonly used graphical overlays are in fact visual stimuli with content that may or may not supplement the classical visual stimuli consisting of the anchor, news video and even live studio background information.
Studies which are specifically related to visual and audio attention issues as well as message processing in TV news have been published by quite a few authors (Bergen et al., 2005; Brosius, 1989; Brosius et al., 1996; Drew and Grimes, 1987; Edwardson et al., 1992; Fox, 2004; Fox et al., 2004; Grimes, 1991; Lang et al., 1999; Lang et al., 1996; Reese, 1983; Son et al., 1987).
TV news is not an area that has been widely studied, but existing work does in fact date back to the 1980s. Elements such as the attention given to and news story messages present in in this genre of TV programme have been analyzed. Some studies focused on audio/video redundancy (Bergen et al., 2005; Brosius, 1989; Brosius et al., 1996; Drew and Grimes, 1987; Fox, 2004; Josephson and Holmes, 2006; Reese, 1983; Son et al., 1987), others on the processing and recall of television news messages (Brosius, 1989; Edwardson et al., 1992; Fox et al., 2004; Lang et al., 1999; Lang et al., 1996; Son et al., 1987), and others specifically on the graphics that appear during a television news broadcast (Edwardson et al., 1992; Fox et al., 2004; Josephson and Holmes, 2006; McClellan and Kerschbaumer, 2001). More recently, as technology has advanced, not only has the digital scenography in TV news developed but new ways for engaging in a more detailed and rigorous study have surfaced, too.
Drew and Grimes (1987) looked at the issue of memorization by the visual and auditory channels, and observed that the lack of audio and video redundancy has implications for audio memory performance but not for understanding the news stories. The findings supported the idea that a redundant condition causes greater audio attention while perceiving the visual channel. In the case of dissonance between channels, viewers pay greater attention to audio messages.
Grimes (1991) conducted another study with similar objectives to those in Drew and Grime’s earlier study (Drew and Grimes, 1987). However, he presented a novelty: the notion that two separate stimuli are perceived as one. Thus, it was taken as a hypothesis that dissonant messages are seen as two distinct messages, which may exceed attention capacity. Results based on the reaction time show that participants prefer the auditory channel, while the visual channel was assimilated in a more selective way. A second experiment, designed to evaluate memory preloads, concluded that with a medium level of redundancy there is a variation between the auditory and visual channels, as greater attention is given to the auditory channel, thereby demonstrating that attention capacity is limited.
More recently, Fox (2004) conducted a study on the redundancy between audio and video messages, as well as memorization performance. However, this study had a different focus since it took into account the ‘signal detection theory’i , and therefore compared the memory performance of viewers in terms of redundancy and dissonance messages. The author’s hypothesis, based on signal detection theory, was that viewers who watch news stories in a redundant condition have a more accurate recognition than those who watch news stories in a dissonant condition. Results revealed that participants who watched news stories with redundant messages remembered a more of the content than those who watched the news stories with dissonance messages, although the difference is not very significant. Finally, other findings show that memory sensitivity was better in viewers that watched news stories in a redundant condition.
Bergen et al. (2005) conducted research with the intention of testing the attention of younger viewers by presenting them with two versions of TV news: i) a version with graphics and news crawls, and ii) a version without graphics (clean feedii ), where only an anchor is present. The authors started with some assumptions, such as the theories of attention and the concept of perceptual groupingiii . In this context the authors developed an experiment using the CNN programme Headline News. They selected 60 students on a mass communication survey course in order to study differences in the understanding of news story content, and audio and visual attention. Participants were then presented a version with and without graphics. The authors concluded that the graphics in TV news distract the participants on a visual level, but that there is no such distraction with respect to auditory channel. Furthermore, they also concluded that “multimessage format exceeded viewers’ attentional capacity” (Bergen et al., 2005: 1).
Another study on TV news was carried out in 2006 using eye tracking technology, with the aim of measuring the participants’ attention in different areas of TV news (crawler, headline, title, globe and main area). Josephson and Holmes (2006) noted that people increasingly process simultaneous visual and audio stimuli, and they prepared a study using eye tracking technology to understand how these stimuli are processed. They were able to understand the various sensory stimuli to which an individual is exposed. This study presented three versions of TV news with: i) video and audio redundancy without textual content; ii) video and audio redundancy and unrelated textual content (crawler) and iii) video and audio redundancy with related and unrelated textual content (crawler and headline). The authors concluded that news stories become visually more complex, and viewers can process visual and audio elements separately. This study, with the help of eye tracking technology, was also able to verify that the greatest percentage of visual attention to be on the main screen (equivalent to the anchor).
Research hypothesis and goals
Like Bergen et al. (2005), we also chose to test the viewers’ attention with two versions of TV news: a version with graphics overlay (dirty version) and a version without graphics overlay (clean feed version). Three levels of redundancy were used: high-redundancy; medium-redundancy; and no-redundancy. High-redundancy considers that all the messages (anchor, lower thirds, ticker and over the shoulder) presented are redundant. Medium-redundancy considers different ticker messages in a same thematic context as the other elements, for example, same theme (ex. sport), but different topics (ex. football, basketball…). No-redundancy considers different ticker messages in a completely different thematic context from the other elements.
Our work differs from that of Bergen et al. (2005) and Josephson and Holmes (2006) in that it introduces the development of four related and controlled sets of SN specifically considering the graphics overlay and the anchor message. It also tests the reception of different messages in a similar thematic context and introduces innovative validation data obtained with eye tracking technology.
Goals
The main goals of this study are to:
-
identify the graphics elements present in TV news that have greater visual attention and information recall;
-
measure the effectiveness of message recall considering audio and video redundancy in clean feed and dirty versions;
Research hypothesis
The research developed and reported in this paper is based on 5 hypotheses:
-
the auditory channel is not affected by graphics overlay in Lead-in context;
-
effective message recall information is higher with high-redundancy than with medium-redundancy and no-redundancy, in both Lead-iniv and Packagev;
-
the anchor is the most viewed element in both versions (dirty and clean feed version);
-
besides the anchor, the ticker is the graphic element that attracts most attention;
-
viewers recall a larger number of messages in clean feed version.
Method
For this work, a case study was the most convenient approach, since it set out to study a specific case of a particular context. The procedure used consisted of participants watching TV news through an eye tracking technology monitor (Tobii T120 eye tracker). A convenience set of eighty Portuguese university students took part in the study, ranging from 18 to 30 years in age ( M = 22.5; Mdn = 21.5%). Forty were male (40) and forty were female (40). The students were from the University of Aveiro and the University of Porto
Sample and Study Object
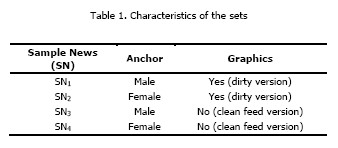
The sample news broadcast used (SN) was assembled from stories developed at the University of Aveiro9’svi “3810” television programme, while the anchors were students from the Communication Sciences graduate programme. The aim behind the production of this video was to prepare a set of potentially appealing news stories whose content was unfamiliar to all the participants in the study, in order to avoid possible bias from previous knowledge about the topic. Four sets of SN were used. All were composed of 6 news stories and had the same overall length. Each of the news stories had the same messages but the composition was different in each set, as shown in table 1. Each set was nine minutes and fifty-two seconds (09:52). The same anchor is used throughout a 9 minutes’ compilation.
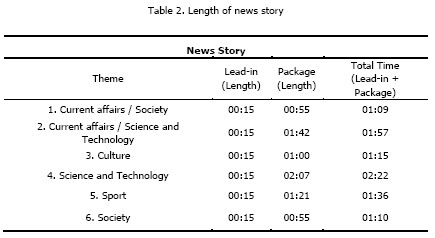
The thematic alignment for each set of 6 news stories and the respective length (table 2) is in two parts:
-
The anchor in the studio labelled as ‘Lead-in’ context.
-
Video on-location events and reports, labelled as ‘Package’. Those parts also vary the presence/absence of graphics overlay, as can be seen in table 1.
An Area of Interest (AOI) in this study represents a small area of the TV screen layout that contains specific visual information that will be analysed. In the dirty version, besides the anchor (AOI1), a set of four areas of interest (AOI) graphic elements are used, as can be seen in Figure 1, with, for example an anchorwoman.
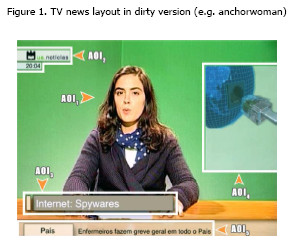
The TV station’s logo (AOI2) appears in the left superior corner of the screen and the clock is associated with it. The lower thirds (AOI3) appears in the lower area of the screen and has the intention of highlighting the news story being presented. In this case, short sentences with great impact are used. Concerning the over the shoulder (AOI4), it appears on the right side of the anchor and is accompanied with an image or icon, with the intention of establishing a link with the news story being presented. Finally, the flipping ticker (AOI5) appears in the bottom of the screen and has the intention of displaying short messages. This ticker, instead of crawling or sliding across the screen, shows a short message on the screen for 8 seconds before alternating to the next message, from bottom to top. All of these are still graphics, with absence of motion graphics that affect attention differently.
Finally, each participant only watched one set of SN, selected at random. Nonetheless, the selection fulfilled the requirement of each video being watched by an equal number of female and male participants. The length of the package was between 1 minute and 2 minutes (approximately), and all of the lead-ins have exactly 15 seconds.
Concerning the content of the stories, general themes were chosen, trying to cover the maximum possible content. Since this work does not aim to study the content of the stories, news that did not have major differences in terms of media exposure and took into account the tastes of the participants was selected.
Tools
A pre-session and post-session questionnaire was used for data collection. The pre-session questionnaire, composed of closed questions, aimed to gather each subject’s biographical information. The post-session questionnaire, also with closed questions, was used as an information recall test. For the post-session questionnaire participants could choose between “TRUE”, “FALSE”, and “DON’T KNOW” (the participant did not know if the statement was true or false).
Procedure
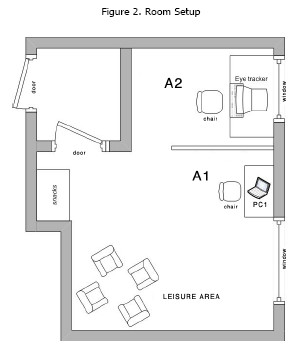
The case study procedure was undertaken in similar conditions in both universities. A room was prepared to receive the participants in a comfortable environment as represented in Figure 2. Each session started with the participants answering a pre-session questionnaire on a laptop computer set up in a specific part of the room for this purpose (A1). After answering the questionnaire, participants were taken to an area (A2) where the eye tracking equipment was installed. At that point, participants were told about the purpose of the study and then assigned one of the four sets of SN, which was set randomly before the beginning of this phase of the procedure. After watching the study object, participants were asked to answer a post-session questionnaire on the same laptop (A1). This questionnaire was different depending on whether the participant had seen the dirty version or the clean feed version of the study object. The length of each session was approximately 15 to 20 minutes.
Results
Results will be presented in three parts according to the different instruments used:
-
message recall
-
comparison of attention focus between clean feed version and the dirty version
-
comparison of messages redundancy in both the Lead-in and Package.
Message recall analysis
Regarding the data collected from the post-session questionnaire (questions related to sets of sample news’ content) the percentage of correct answers in the clean feed sets of SN (62.9%) was higher than the percentage of wrong and “Don’t Know” answers (37.1%). This percentage difference was expected, since the anchor was the only element in both these clean feed sets of SN and therefore participants’ information recall was higher. In the case of the dirty version sets of SN, the percentage of correct answers was a slightly lower than that in the clean feed version (56.7%). This percentage difference was also expected because the various elements were present in the SN (AOI1, AOI2, AOI3, AOI4 and AOI5), and therefore participants’ information recall was lower.
Clean feed version versus dirty version
Both male and female anchors recorded a very high mean percentage of fixation points and fixation time, M = 81.3%, Mdn = 79.9%, SD = 9.1 and M = 71.2%, Mdn = 73.6%, SD = 14.0 respectively (Figures 3(a) and 3(b)). Figures 3(a) and 3(b) represent the fixation points of all participants scattered around the anchor’s area. Specifically, within the area of the anchor’s face, the mean fixation time of all participants was 64.3% (Mdn = 67.2%, SD = 15.5), more than a half of the study object’s length.
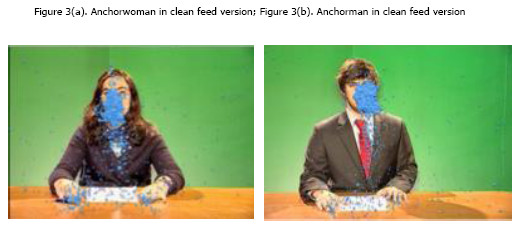
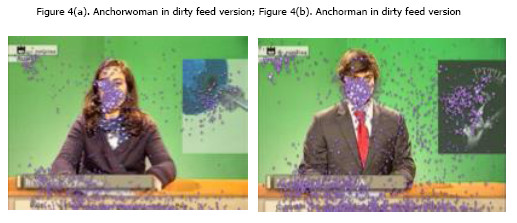
Now considering the dirty version, the total percentage of correct answers was quite similar to the clean feed version (64.2% and 62.9% respectively). Complementing these results, data gathered from the eye tracker reveals that the participants had more fixation time watching the anchor (M = 41.0%, Mdn = 37.7%, SD = 16.1) than the other overlaid graphics (station logo, lower thirds, over the shoulder and ticker). In the area of the anchor’s face, the mean fixation time of all participants was 34.1% (Mdn = 32.7%, SD = 14.5), approximately one third of the study object’s length.
Although these sets of SN have overlaid graphics, the anchor was still the element which participants spent most of the time watching (Figure 4(a) and Figure 4(b)).
Focus of Attention in Version Clean Feed and Dirty Version
With data gathered from eye tracker its possible to discern the main focus of attention of the viewers. Furthermore, in the dirty version it is also possible to analyse the differences between different graphics (station logo, lower thirds, ticker and over the shoulder).
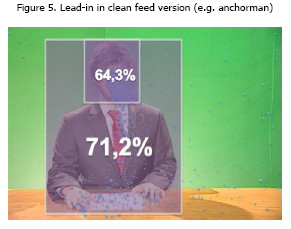
With respect to the clean feed version (Figure 5), the focus of attention in terms of fixation time was mainly the anchor (M = 71.2%, Mdn = 73.6%, SD = 14.0). It also denotes that there is a high mean percentage focus of attention on the face of the anchor (both anchorman and anchorwoman), showing that more than 60.0% of the total time is directed to the face of anchor (M = 64.3%, Mdn = 67.2%, SD = 15.5). The dirty version, in Figure 6, shows the different focuses of attention.
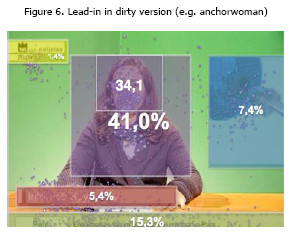
The anchor remains the element most focused on by viewers, in terms of mean fixation time (M = 41.0%, Mdn = 37.7%, SD = 16.1), and percentage of focus of attention on the anchor’s face (both anchorman and anchorwoman), showing that more than 30.0% of the total time is directed to the face of the anchor (M = 34.1%, Mdn = 32.7%, SD = 14.5).. However, the viewers’ attention was also dispersed by the other graphics display. In this context the ticker is the graphic with next highest mean of fixation time (M = 15.3%, Mdn = 14.7%, SD = 8.8) and the other graphics record a very low percentage, especially the station logo (M = 1.4%, Mdn = 1.2%, SD = 1.3). In conclusion, in the clean feed video version the focus of attention was mainly on the anchor, more specifically on her/his face. In the dirty version, the anchor and the ticker were the most viewed graphics and the logo was the least focused graphic.
Message redundancy
Another issue to be analysed is redundancy of messages in the various graphics present in TV news (table 3). This redundancy measure, as shown in table 3, compares the recall percentage of the ticker message with the other elements (anchor, over the shoulder and lower thirds). Furthermore, the redundancy was divided into three levels: high-redundancy, no-redundancy and medium-redundancy. Finally, with this approach, it is important to assess the difference in redundancy between the Lead-in and Package.
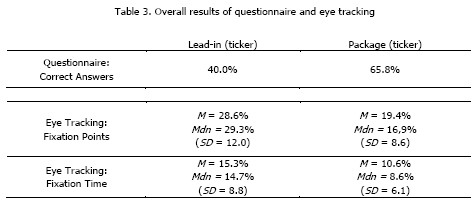
Table 3 shows 40.0% of correct answers associated with the ticker of Lead-in and 65.8% of correct answers to the ticker of Package. There is thus a marked difference between the Lead-in and Package. These results can be supplemented with data recorded with eye tracking. With regard to Lead-in, despite the 28.6% (Mdn = 29.3%, SD = 12.0) of mean of fixation points in ticker, the mean fixation time was lower (M = 15.3%, Mdn = 14.7%, SD = 8.8), demonstrating that although the participants looked at the ticker several times, they spent very little time looking on each occasion. For the Package, the mean percentage of fixation points and fixation time on the ticker was lower than that found in Lead-in, M = 19.4%, Mdn = 16.9%, SD = 8.6 and M = 10.6%, Mdn = 8.6%, SD = 6.1) respectively.
Furthermore, the difference observed in the percentage of correct answers on the Lead-in and Package can be explained by the number of elements on the Lead-in. In this context, in Lead-in the participants are confronted by the station logo, lower thirds, over the shoulder, ticker and the anchor. Except for the station logo, all other graphics are informative elements. Considering the Package, only the station logo and ticker are in view, and the first element is not relevant to the message being tested. Therefore and despite the fixation points and fixation time on the ticker being slightly higher in Lead-in, the presence of several graphics resulted in a lower reception and memorization of messages by participants. In the Package, the existence of only two graphics (ticker and station logo) allowed the participant to develop higher rates of message recall. After analysing the results of tickers in the Lead-in and Package, the level of redundancy of messages was examined, as shown in Table 4.
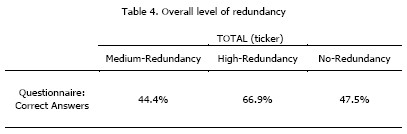
The results in Table 4 show that only the tickers with high-redundancy have a noticeable percentage of correct answers (66.9%), while in tickers with medium-redundancy and no-redundancy, the percentages are lower than 50.0%. These results seem promising and very conclusive but unfortunately they hide the correlation of two very different information contexts, as shown in Table 5.
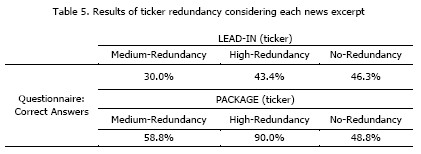
The two contexts examined here are the Lead-in and the Package and the level of message redundancy is considered from the point of view of the ticker with the other elements in each specific context. It is interesting to observe that in the Lead-in, whatever the redundancy, the percentage of correct answers is always less than 50.0%, while in the Package the percentages are above 50.0% in tickers with high-redundancy (90.0%) and medium-redundancy (58.8%). Even in the Package, the tickers with no-redundancy, the percentage of correct answers is higher than for any of the other redundancy situations observed in the Lead-in.
Discussion
The results obtained from the case study shed some light on the reception and processing of messages in TV news. One of the research hypotheses to be checked was whether the auditory channel is unaffected by the graphic elements present in the Lead-in context (hypothesis 1). The results indicate that the capacity to receive audio information in a clean feed version is similar to the dirty version (version with graphics), and it is concluded that the graphics are not enough to interfere in the processing of audio information in the Lead-in context (clean feed version versus dirty version section). The results for both the auditory channel and the visual channel corroborate the results reported in Literature review section of this article, and agree with Bergen et al. (2005), who concluded that the graphics found in TV news distract the participants on a visual level, but cause no distraction with regard to the auditory channel. However, a more detailed comparison between clean feed version and dirty version showed that viewers recall the messages of the clean feed version more effectively, since the viewer is not exposed to many graphics and only the anchor is present (Clean feed version versus dirty version section). These results bear out hypothesis 5.
Another research hypothesis to be checked is related to the global message recall (hypothesis 5). The results of this study demonstrate that the viewers recall a larger number of messages in a clean feed version than in the dirty version (Message recall analysis section). These results can be explained by the number of elements in the two versions, since in the clean feed version the anchor was the only element and in the dirty version there are more elements (AOI1, AOI2, AOI3, AOI4 and AOI5).
Furthermore, this article was intended to analyse the redundancy of messages between the ticker and the other graphic elements (hypothesis 2). Again, the results show that if there is message redundancy (high-redundancy) in all graphics elements, the information recall is better than when there is no-redundancy or medium-redundancy. It was also noted that there were no marked differences between medium-redundancy and no-redundancy in message recall results. Regarding the difference between Lead-in and Package, the results indicate that in Package, whatever the redundancy of the ticker, the message recall performance is higher than in Lead-in.
Another of the hypotheses tested concerns the focus of attention for the clean feed version and dirty version (hypotheses 3 and 4). High percentages of both fixation time and fixation points were registered in the clean feed version with the anchor as the only screen element. These percentages were substantially higher for the face of the anchor (male and female), as seen in Figure 7 (Focus of attention in version clean feed and dirty version section). In the dirty version, the least viewed graphic element was the station logo and the most viewed elements were the anchor and the ticker (Figure 8 in Focus of attention in version clean feed and dirty version section).
Conclusions and future work
The use of eye tracking technology has brought innovative aspects to this study, since it enabled the collection of specific data concerning visual information based on the subject’s eye behaviour. This methodological approach facilitated the understanding of the relationship between the arrangement of visual stimuli and information processing in TV news. In this field of research, eye tracking has proved to be a very useful instrument since it registers data that can be used as an evaluation technique in various contexts, specifically that of TV news.
The main purpose of this study was to understand how viewers process and recall the messages from various graphical elements presented in TV news broadcasts. The results are promising and represent a useful contribution, namely the redesign of television news layout. Furthermore, new prospects for future research have occurred. It would be interesting to carry out this study with a larger number of participants and introduce the age group variable. It would also be interesting to develop new study objects considering new layouts with different and/or additional graphic elements. Finally, further research should consider a study object developed in a professional TV studio context, while studying the relevance of the thematic and the length of the pieces, and how that can impact global results. This study only uses a descriptive analysis, nevertheless it reveals strong indicators for the design of further research taking into consideration meaningful statistical analysis techniques with appropriate study variables.
References
Alkan S and Cagiltay K. (2007) Studying computer game learning experience through eye tracking. British Journal of Educational Techonology 38: 538-542. [ Links ]
Bergen L, Grimes T and Potter D. (2005) How Attention Partitions Itself During Simultaneous Message Presentations. Human Communication Research 31: 311-336. [ Links ]
Brosius HB. (1989) Influence of presentation features and news content on learning from television news. Journal of Broadcasting & Electronic Media 33: 1-14. [ Links ]
Brosius HB, Donsbach W and Birk M. (1996) How do text‐picture relations affect the informational effectiveness of television newscasts? Journal of Broadcasting & Electronic Media 40: 180-195. [ Links ]
Drew D and Grimes T. (1987) Audio-Visual Redundancy and TV News Recall. Communication Research 14: 452-461. [ Links ]
Duchowski A. (2007) Eye Tracking: Theory and Practice.
Edwardson M, Kent K, Engstrom E, et al. (1992) Audio recall immediately following video change in television news. Journal of Broadcasting & Electronic Media 36: 395-410. [ Links ]
El-Nasr M and Yan S. (2006) Visual Attention in 3D Video Games. Proceedings of the 2006 symposium on Eye tracking research & applications. San Diego, California: ACM.
Fleetwood MD and Byrne MD. (2006) Modeling the Visual Search of Displays: A Revised ACT-R Model of Icon Search Based on Eye-Tracking Data. Human–Computer Interaction 21: 153-197.
Fox J. (2004) A Signal Detection Analysis of Audio/Video Redundancy Effects in Television News Video. Communication Research 31: 524. [ Links ]
Fox JR, Lang A, Chung Y, et al. (2004) Picture this: Effects of graphics on the processing of television news. Journal of Broadcasting & Electronic Media 48: 646-674. [ Links ]
Gredebäck G, Johnson S and von Hofsten C. (2009) Eye Tracking in Infancy Research. Developmental Neuropsychology 35: 1-19. [ Links ]
Grimes T. (1991) Mild Auditory-Visual Dissonance in Television News May Exceed Viewer Attentional Capacity. Human Communication Research 18: 268-298. [ Links ]
Heuer S and Hallowell B. (2009) Visual attention in a multiple‐choice task: Influences of image characteristics with and without presentation of a verbal stimulus. Aphasiology 23: 351-363. [ Links ]
Jacob, R., & Karn, K. (2003). Eye Tracking in Human–Computer Interaction and Usability Research: Ready to Deliver the Promises The Mind’s Eye: Cognitive and Applied Aspects of Eye Movement Research (pp. 573-605). Oxford: Elsevier Scienve BV.
Josephson S. (2008) Keeping Your Readers' Eyes on the Screen: An Eye-Tracking Study Comparing Sans Serif and Serif Typefaces. Visual Communication Quarterly 15: 67-79. [ Links ]
Josephson S and Holmes M. (2002) Visual Attention to Repeated Internet Images: Testing the Scanpath Theory on the World Wide Web.
Josephson S and Holmes M. (2006) Clutter or content? How on-screen enhancements affect how TV viewers scan and what they learn. ETRA 2006 Proceedings: 155-162. [ Links ]
Kammerer Y and Gerjets P. (2011) Effects of search interface and Internet-specific epistemic beliefs on source evaluations during Web search for medical information: an eye-tracking study. Behaviour & Information Technology 31: 83-97. [ Links ]
Lang A, Bolls P, Potter RF, et al. (1999) The effects of production pacing and arousing content on the information processing of television messages. Journal of Broadcasting & Electronic Media 43: 451-475. [ Links ]
Lang A, Newhagen J and Reeves B. (1996) Negative video as structure: Emotion, attention, capacity, and memory. Journal of Broadcasting & Electronic Media 40: 460-477. [ Links ]
Marchant P, Raybould D, Renshaw T, et al. (2009) Are you seeing what I'm seeing? An eye-tracking evaluation of dynamic scenes. Digital Creativity 20: 153-163. [ Links ]
McClellan S and Kerschbaumer K. (2001) Tickers and bugs: Has TV gotten way too graphic? Broadcasting & Cable.
Reese S. (1983) Improving Audience Learning from Television News through Between-Channel Redundancy. Annual Meeting of the Association for Education in Journalism and Mass Communication.
Richardson, D., & Spivey, M. (2004). Eye-Tracking : Characteristics and Methods Eye-Tracking : Research Areas and Applications Eye-Tracking : Characteristics and Methods Encyclopedia of Biomaterials and Biomedical Engineering (pp. 1-32): Marcel Dekker, Inc,.
Son J, Reese SD and Davie WR. (1987) Effects of visual‐verbal redundancy and recaps on television news learning. Journal of Broadcasting & Electronic Media 31: 207-216. [ Links ]
Date of submission: April 27, 2015
Date of acceptance: February 10, 2016
Acknowledgements
Thanks are due to the anchors Inês Pedroso and João Pereira, as well as to João Oliveira for providing the package from the University of Aveiro’s programme “3810”. Special thanks, too, to SAPO, (PT Comunicações), Ivo Gomes and Benjamin Júnior for facilitating their eye tracker equipment, and to our research colleague Carlos Santos, for the support from labs sapo/ua. Last but not least, we are grateful to Samuel Almeida for his help in setting up the experiment.
END NOTES
i According to Macmillan and Creelman (2004) the signal detection theory is not to give the signal strength full focus but take into account other variables such as the psychological state of the subject, their experiences and expectations.
ii This is the technical term used in TV to designate a programme that does not present any type of graphics coming from a mixing desk.
iii Concept introduced by Treisman, Kahneman and Burkell describing the process where messages of different channels, but semantically related, receive attention simultaneously, at the expense of minimal cognitive effort.
iv Broadcast term for beginning part of story news anchor reads introducing the story and/or person reporting story.
v A completed television news story pre-prepared for a news bulletin and ready for transmission.
vi The programme “3810” was a weekly programme of an institutional nature produced at the University of Aveiro and broadcast nationwide.

