


Serviços Personalizados
Journal
Artigo
 Inglês (pdf)
 Artigo em XML
 Referências do artigo
 Enviar este artigo por email
Indicadores
-
 Citado por SciELO
 -
 Acessos
Links relacionados
-
 Similares em
SciELO
Similares em
SciELO
Compartilhar

 Permalink
Revista de Gestão Costeira Integrada
versão On-line ISSN 1646-8872
RGCI vol.14 no.4 Lisboa dez. 2014
https://doi.org/10.5894/rgci458
ARTICLE / ARTIGO
Sampling and quantification methodology for floating solid wastes in beaches*
Metodologia para amostragem e quantificação de resíduos sólidos flutuantes nas praias**
Claudia Díaz Mendoza @, Juan Carlos Valdelamar 1, Gilma Rosa Ávila 1, Jhon Jairo Jiménez 1
@Corresponding author
1Fundación Universitaria Tecnológico Comfenalco, Cartagena, Bolívar, Colombia. e-mails: Diaz-Mendoza <cdiaz@tecnologicocomfenalco.edu.co>; Valdelamar <juvaldelamar@gmail.com>; Ávila <gram0412@hotmail.com>; Jiménez <jjjimenez1989@hotmail.com>
ABSTRACT
The suggested methodology aims to typify the solid waste found on the aquatic surface of the touristic beaches in Cartagena de Indias. In addition, it was designed and implemented water samplers for floating solid waste to evaluate, in a wide swath, the composition of the waste that is cast into the seawaters and affects the quality of the beach as a touristic attraction as well as disturbing a healthy aquatic ecosystem. Such developed methodology comprises both the optimal sampler´s size based on information from the waste accumulation curves, plus the sample´s size standardization for estimations of total waste content through statistical sampling techniques such as MAS and MSL. This sampling was performed in parallel and perpendicular to the coastline by using devices with specifications of 1.0 m, 0.75 m and 0.5 m width; therefore the 0.75 m width device came to be the most efficient one, whereas the movement is perpendicular due to the variety of solid waste collected. The results, along with the process of the Project implementation, provide valuable information for the development of protocols and new parameters according to environmental quality index for touristic beaches up-to-date; thus abiding by the environmental quality program framework for beaches in the Colombian Northern Caribbean area.Keywords: aquatic ecosystem, coastline, touristic beaches.
RESUMO A metodologia sugerida pretende tipificar os resíduos sólidos encontrados na parte aquática superficial de praias turísticas em Cartagena das Índias. Além disso, foram desenhados e implementados amostradores de água para resíduos sólidos flutuantes, visando avaliar, de forma ampla, a composição dos resíduos que são lançados na água do mar e que afetam a qualidade das praias e das atrações turísticas, assim como a saúde dos ecossistemas aquáticos. A metodologia desenvolvida compreende ambos, o tamanho ótimo do amostrador baseado na informação a partir de curvas de acumulação de resíduos, e a estandardização do tamanho amostral para a estimação do conteúdo total de resíduos através de técnicas estatísticas amostrais tais como MAS e MSL. A amostragem foi realizada paralelemente e perpendicularmente à linha de costa com o uso de instrumentos com 1,0m, 0,75m e 0,5m de largura, sendo que o amostrador com largura de 0,75m demostrou ser o mais eficiente entre eles para movimentos perpendiculares, devido à variedade de sólidos coletados. Os resultados, juntamente com o processo de implementação do Projeto, aportaram uma valiosa informação para o desenvolvimento de protocolos e de novos parâmetros, de acordo com o atual índice de qualidade para praias turísticas, atendendo, dessa forma, o contexto do programa de qualidade ambiental de praias para a área Colombiana no Norte do Caribe.
Palavras-chave: ecossistemas aquáticos, linha de costa, praias turísticas.
1. Introduction
Measurement of quality of waters on beaches is generally based on chemical and microbiological parameters; however, we must consider that the visitors perception of the beach has nowadays gained much value in the selection of it and its constant turnout (Palomino de Dios et al., 2012), so it is then when the presence of solid waste, either in the sand or seawater becomes a significant quality parameter (Araújo & Costa, 2006). Currently, there is a set up procedure to sort out the solid waste in the beach sand, by unit, amount and type of waste found with which it is determined the percentage of distribution of this throughout the sand as well as how hazardous it could be for visitors. Regarding the measurement of floating solid wastes, authors such as Botero (INVEMAR, 2007) have stated methods that suggest the use of multifilament devices by moving on a boat at a constant speed along the coast line in a parallel way in order to catch the floating solid waste in seawater.
According to the statement above, it was necessary to come up with a model which could be able to assess the efficiency of the method applied considering the sampling both in parallel and perpendicular to the coastline. Additionally, sample collection is proposed to be performed by a field auxiliary technician around the most crowded beach area and so the impact of a boat moving around may be diminished. Finally, as a last component, several size multifilament devices were tested (Zavala-García & Flores-Coto, 2005).
The main objective of the developed model attempted to find the effective combination among all the given variables in order to come with an easy process to monitor parameters in a reliable way.
Through this method, it is possible to get information with regards the type and percentages of floating solid waste at every beach in contrast with sanitary quality and the density of visitors in order to determine the nature of waste found in the seawater.
2. Experimental setup
The experimental setup was implemented within an area of 240 m along the touristic beach of Bocagrande in Cartagena de Indias, whose coordinates are 75º 33` 41.0``LO and 10º 28` 56.7`` LN (Google Earth). Three multifilament devices were used and assembled resembling the Bentos samplers with a 0.05 mm net and PVC piping of 0.5 inch-diameter, the net length is 2.5 in proportion to the device width (Donato, 2002), as it is shown in Figure 1.
Two movements were performed: parallel and perpendicular to the coast line, using the three different devices at each direction. The samplings were carried out in the morning before noon time, and in the afternoon before 5:00 p.m., for the beach to be analyzed from its initial and final conditions related to its users behavior.
Therefore, for the shifting in parallel to the coast line it was determined that the ideal depth to take the sample should be between 1m and 1.5m. as it evidenced the area where most visitors gathered. During the monitoring the net was immersed down to reach the calibration mark of 0.25m. Five sections to go across were marked off with a distance of 20 m approximately and a 10m gap among each other (Figure 3).
Likewise, the second type of displacement perpendicular to the coastline was traced from the shore to waters that may reach near 1m and 1.5 m. depth, plunging the device down to the calibration mark of 0.25 m. Five section routes were outlined corresponding to each sampling device at a 30 m gap length among sections (Figure 4).
Going across the outlined routes, the device is able to pick up every floating solid waste in the seawater which could be taken to the lab, labeled and stored for further classification and weighing.
For the developed model, five samples were carried out, between December 2012 and February 2013. The periods in which the research was conducted included both high and low season periods for tourism including the weather changes due to rains as documented on one of the monitoring.
Afterwards, in order to process and analyze the information statistically, the results were tabulated on an EXCEL data sheet and subsequently read through the R statistical software 3.0.2 version. Following the procedure, the density of waste average values were contrasted between sampling periods (morning and afternoon) as well as the two types of net dragging (perpendicular and parallel) by using the T Student test; unlike the comparison among net type (0.5, 0.75 y 1.0 m) and sampling periods for which it was applied the analysis of variance (ANOVA), one way. When comparisons were statistically meaningful with P-value < 0.05, Tukey test was employed for multiple comparison of means. (Gonzáles et al., 2011).
3. Results and discussion
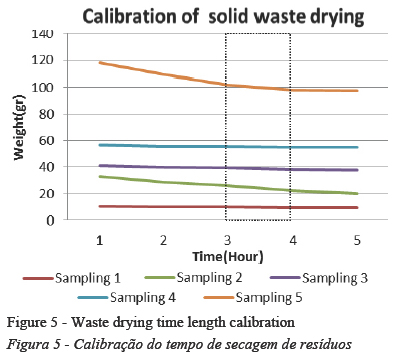
The samples collected along the monitorings, were transported to the laboratory for drying and weighing. In order to determine the drying time length of the collected waste, a set of representative samples were taken with a weight variety considering 10 gr the minimum average and 118gr the maximum average, also containing many kinds of waste such as organic matter, plastic, paper, cardboard and fabric which dried off in an electrical oven after 5 hours at a 60°C temperature. The relationship between waste dry weight and the drying time length was obtained as shown in Figure 5, in which it is observed how the very waste tends to stabilize its weight after 3 hours drying.
According to the variables taken into account for the project, such as the device width, displacement direction, and monitoring collection period, the analysis of data through parametric model determined that this did not adjust to normal distribution, hence non- parametric tests were then applied to each analyzed variable.
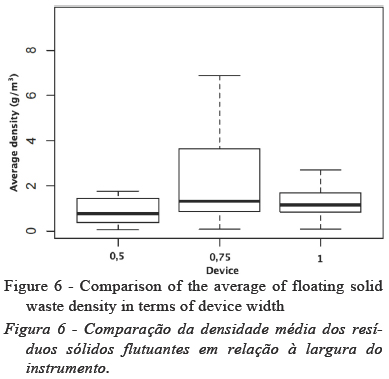
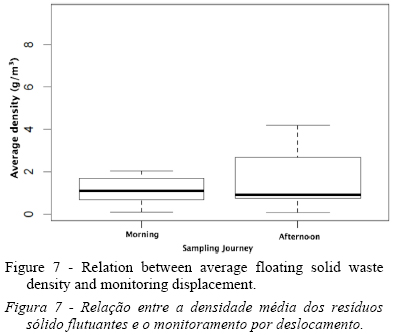
The behavior of floating solid waste average density in contrast with the net type revealed no significant statistical dissimilarity (F = 2.59; p-valor > 0.05) among the three different kinds of nets used as it is observed in Figure 6. Despite the former results, the same figure evidences that the 0.75 cm net can reach greater values The relation between of solid waste density average and sampling day monitoring generated an outcome that established it could be collected 1.49 g/m3 waste in the morning whilst in the afternoon this number may increase to 1.92 g/m3. Nevertheless the comparative analysis through the T test clearly evidenced there were no significant differences between them (T = 0.80; Pvalue > 0.05). The results are visualized on Figure 7.
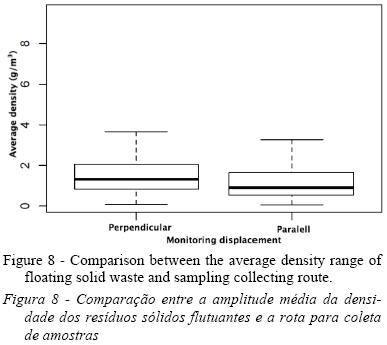
By analyzing the direction of the trip around the sampling route for floating solid waste, it was found that values of collected waste density registered 1.51 on the way parallel to the coastline and 1.87 g/m3 on the way perpendicular to the coastline; thus the relation between these values evidence there is no significant statistical dissimilarities for both mid points (T = 0.70; P >> 0.05), as it is shown in Figure 8.
The temporary behavior of average density range of floating solid waste in the samplings around bathing areas from the beaches of study, it was registered a significant increase of its values related to its last sampling; denoting additionally, based on ANOVA, the clear differences (P-value > 0.05; F = 3.27) among previous samplings; on the other hand, through the Tukey paired test it was proved such differences were only present between sampling five with sampling one, and sampling five with sampling two (Figure 9).
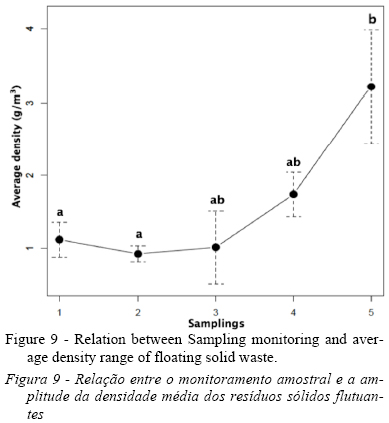
As a result from the five sampling monitoring carried out comprised the period from December 2012 to March 2013, variation on the density average it is demonstrated through the fourth and fifth monitoring. This variation is attributed to weather changes, such as the rain registered during the fifth sampling, as well as to the rough seas along the fourth one where there was an evident growth of plastic material found that could have been dragged from shallow waters disposal sites towards the sampling monitoring area.
According to the data obtained in the two previous sampling displacements evaluated, the parallel displacement showed the collection of mostly vegetable waste and plastic, while the perpendicular one showed a wide variety of matter containing plastics (Silva, 2008), vegetable waste, food waste and paper which presented the highest percentage of composition. These facts demonstrated that the perpendicular displacements generate a wider range of solid waste composition and covers an area that allows comparison between the solid waste composition found in the sand and into the water. Therefore it explains how efficient the perpendicular displacement sampling monitoring can be as it encompasses the greatest area for users and swimmers (Figure 10).

3. Results and discussion
The most effective width for the sampling device was found to be 0.75 m, since it obtained the highest floating solid wastes density range, in terms of weight per filtered water cubic meter, even the device turned out to be the easiest to handle compared to the others due to its ideal dimensions for the project.
The samples drying optimum conditions were proved to be during 3 hours and at a 60ºC temperature, for their further weighing.
From the technical point of view, the most favorable displacement for monitoring was the perpendicular to the coast line which covered a trajectory from the shore up to a 1m ± 1.5 m depth, by immersing the sampling device down to the calibration mark at 0.25 m depth within at least five sections with a 30 m gap separation.
The predominant solid waste found was plastic, which affects the recreational quality of beaches and the ecosystem equilibrium. However, a great amount of vegetable waste, generally algae was also collected and whose contaminants presence was related to the unhealthy sanitary quality of it.
Acknowledgements
The authors would like to take this opportunity to thank the collaboration throughout the development of this research process by Fundación Universitaria Tecnológico Comfenalco, ICAPTU program for the Touristic Beaches Quality Index, Engineer Shirchan Moreno and every student who belongs to the environmental engineering breeding ground of research on Sampling and quantification methodology for floating solid wastes in beaches and took part on such a project along sampling and process periods.
Referências bibliográficas
Araújo, M.C.B.; Costa, M.F. (2006) - Municipal Services on Tourist Beaches: Costs and Benefits of Solid Waste Colletion. Journal of Coastal Research, 22(5):1070-1075. DOI: 10.2112/03-0069.1 [ Links ]
Donato J.C. (2002) - Métodos para el estudio del fitoplancton en sistemas lénticos. In: Guillermo Rueda-Delgado (ed.), Manual de métodos de limnología, pp.23-28, Asociación Colombiana de Limnología, Bogotá, Colombia. ISBN: 978-9583334634 [ Links ]
Gonzáles, C.G.; Liste, A.V.; Felpeto, A.B. (2011) - Tratamiento de datos con R Statistica y SPSS. 996p., Ediciones Díaz de Santos, Madrid, Spain. ISBN: 978-8479789985. [ Links ]
INVEMAR (2007) - Ordenamiento Ambiental de la Zona Costera del Departamento del Atlántico. 588p., Instituto de Investigaciones Marinas y Costeras José Benito Vives de Andréis (INVEMAR), Santa Marta, Colombia. ISBN: 978- 9589810422. Available on-line at http://www.invemar.org.co/redcostera1/invemar/docs/zcatlantico.pdf [ Links ]
Palomino de Dios, A.; Cabrera, S.M.; Martinez, G.E, Sanchez, J.A. (2012)- Environmental quality of Sitges (Catalonia, NE Spain) beaches during the bathing season. Ocean & Coastal Management, 55:128-134. DOI: 10.1016/j.ocecoaman. 2011.10.004 [ Links ]
Silva, J.S.; Barbosa, S.C.T; Costa, M.F. (2008) - Flag Items as a Tool for Monitoring Solid Waste from Users on Urban Beaches. Journal of Coastal Research, 24(4):890-898. DOI: 10.2112/06-0695.1 [ Links ]
Zavala-García, F.; Flores-Coto, C. (2005) - Marco soporte para muestreo de plancton y nesuton en áreas someras canales. Ciencia y mar, (ISSN 1665-0808), 9(25):21-24, Universidad del Mar, Puerto Ángel, OAX, Mexico. Available on-line at http://www.umar.mx/revistas/25/nota25.pdf [ Links ]
*Submission: 16 FEB 2014; Peer review: 13 MAR 2014; Revised: 28 APR 2014; Accepted: 2 JUN 2014; Available on-line: 24 SEP 2014
**Portuguese Title, Abstract and captions by Marinez Scherer on behalf of the Journal Editorial Board

