


Serviços Personalizados
Journal
Artigo
 Inglês (pdf)
 Artigo em XML
 Referências do artigo
 Enviar este artigo por email
Indicadores
-
 Citado por SciELO
 -
 Acessos
Links relacionados
-
 Similares em
SciELO
Similares em
SciELO
Compartilhar

 Permalink
GOT, Revista de Geografia e Ordenamento do Território
versão On-line ISSN 2182-1267
GOT no.5 Porto jun. 2014
https://doi.org/10.17127/got/2014.5.006
ARTIGO ORIGINAL
Regional analysis of decoupling economic growth and pollutant emmissions into the air in Ukraine
Kokovskyy, Lyubomyr1
1Taras Shevchenko National University of Kyiv / U. Minho; Lubomir2005@ukr.net
ABSTRACT
The main goal of this paper is to examine the occurrence of a decoupling emerging tendency between economic growth rates and pollutant emissions in Ukraine, based on a regional analysis. Results indicate that between 2000 and 2012 gross domestic product increased in real terms by three-quarters, while the volume emissions into the air only one-fourth. This suggests that the long-awaited decoupling of economic and pollution emissions growth has begun. However, there are huge regional variations in decoupling processes in the country, which is important to understand and explain. In this paper regional analysis is used to comparatively evaluate the progress made in regions across the country in decoupling pollution emissions from economic growth, as a way to achieve some findings with significant implications for regional development policy, not only in Ukraine but in other countries facing the same challenge.
Keywords: decoupling, economic growth, environmental impact, regional analysis, Ukraine.
RESUMO
O principal objetivo deste artigo é analisar, numa perspectiva regional, a tendência emergente de decoupling – a dissociação ou afastamento entre as taxas de crescimento económico e as emissões de poluentes atmosféricos na Ucrânia. Os resultados indicam que, entre 2000 e 2012, o produto interno bruto aumentou em termos reais 3/4, enquanto as emissões de poluentes aumentaram apenas 1/4. Esta discrepância sugere que a desejável dissociação entre o crescimento económico e a poluição atmosférica já começou. No entanto, são perceptiveis, ainda, enormes variações regionais nos processos de decoupling entre estas duas variáveis, facto que importa entender e analisar. A análise comparativa dos progressos alcançados regionalmente e das causas que estão na génese deste inicio de decoupling entre o crescimento económico e a emissão de poluentes atmosféricos pretende constituir uma base de refelexão para a construção de políticas de desenvolvimento regional mais sustentáveis, não só na Ucrânia, mas também noutros países que enfrentam o mesmo desafio.
Palavras-chave: decoupling, crescimento económico, impacto ambiental, análise regional, Ucrânia.
1. Introduction
The main goal of a sustainable economy is simultaneously achieve an increase in the citizen’s quality of life, as well as a reduction of the environmental impact of their economic activities.
The strategy of the State Environmental Policy of Ukraine for the period up to 2020 determines the sustainable development of the country based on an economy impelled by the will to both satisfy the material and spiritual needs of the people, with a rational natural resources use and environmental management (Parliament of Ukraine, 2011). Thus sustainable development can only be achieved by separating economic growth from a progressive use of natural resources and its environmental impacts. This separation would be confirmed when the growth rates of resource use (or environmental impact) will be lower than economic growth rates and, ideally, when it would be possible to reach economic growth while decreasing environmental impacts.
The term decoupling refers to breaking the link between “environmental bads” and “economic good” (OECD, 2002). In particular, it refers to distinct growth rates of an environmental pressure and an economically relevant variable to which it is causally linked. For example, at the national and regional levels, the growth rate of emissions pollutants may be compared with growth rate of GDP (OECD, 2002).
In a Communication from the European Commission to the Council and European Parliament ‘Towards the Thematic Strategy on the Sustainable Use of Natural Resources’, decoupling refers to de-linking one parameter from another. There are two sets of parameters that are relevant in this Communication: economic growth versus resource use and economic growth versus environmental impacts. Decoupling resource use from economic growth can mean two things: 1) the economy grows faster than resource use, while the absolute quantity of resource input is still increasing; 2) the economy grows, while total resource input remains stable or decreases. These different degrees of de-linking are commonly referred to as relative and absolute decoupling, respectively. Similarly, decoupling of environmental impact from economic growth means that the economy grows at a faster rate than environmental impact (relative decoupling) or while environmental impact stabilizes or decreases in absolute terms (absolute decoupling) (EC, 2003).
Undesirable environmental impacts can arise from any part of the life cycle of resources use: in the phases of extraction, production/manufacture, consumption or post-consumption. These impacts may be caused by deliberate interventions into the natural system such as land cover change and resource extraction, or by unintended side effects of economic activities, such as emissions and wastes. Thus, a focus on decoupling requires attention both to the amount of resource use linked with the economic activity, and to the environmental impacts associated with this resource use at all stages of its life cycle (UNEP, 2011).
The main aim of this paper is to identify regional differences in the relationship between economic growth and the emissions of pollutants into the atmosphere, which has been a significant problem in Ukraine. During the URSS era political options of Soviet governments conducted to a huge development of pollutant industries in some Ukrainian regions. Metallurgy, chemistry, energy sectors and other heavy industries were responsible, in the 1980’s, for a significant proportion of all manufacturing employment in Ukraine, which was not so evident in other post-soviet countries. Those political options were responsible for an economic growth strictly linked to the exploration of non renewable resources, such as coal, oil, iron ore and others, with its consequent environmental impacts. This is particularly problematic in eastern regions, much more industrialized than the rest of the country. Such regional differences are not so evident in any other country of Eastern Europe. Under this context, since URSS collapse, one of the major challenges faced by Ukraine, as an independent country, has been the attempt to pursue a different economic development model, less depended of the use on non renewable resources. This study will use the decoupling analysis in order to reflect and discuss the results of 25 years of independence in this particular challenge.
The pertinence of this study relies not only in the lack of researches on the regional analysis of decoupling processes, but also because air pollution is an urgent problem for Ukraine that impacts human health through a sequence of changes in the natural environment. So, the contribution of this research is to provide new results with respect to the existence relationship between GDP and CO2 emissions for the period 2003–2012 in Ukraine in order to help policy makers design appropriate economic and environmental regional policies for Ukraine.
The structure of the paper is organized as follows: section 2 acquaints with the most relevant environmental and economic studies related with the decoupling concept; section 3 represents an overview of the proposed methodology for a regional analysis of decoupling; section 4 presents empirical findings and, finally, in section 5, the conclusions of the analysis are summarized.
2. Decoupling in environmental and economic studies
The term decoupling in environmental and economic studies was firstly used in a Chinese research (Zhang, 2000), however the presentation of the basic provisions of the decoupling concept were published in 2002 by the Organization for Economic Cooperation and Development in a report titled ‘Indicators to Measure Decoupling of Environmental Pressure from Economic Growth’ (OECD, 2002). Over the following decade after this report publication, there was conducted the first theoretical-methodological generalization of the concept (Tapio, 2005; Finel and Tapio 2012) and its foundations were used, in different regions and countries, to study the relationship of economic growth with carbon dioxide emissions (Zang, 2000; Vehmas, 2003; Lu, 2007, Charlita de Freitas and Kaneko 2011); waste generation (Sjöström and Östblom, 2010); transport (McKinnon, 2007; Kveiborg and Fosgerau, 2007; Sorrell et al., 2012) or energy consumption (Bithas and Kalimeris, 2013). Other researchers have chosen to develop a more narrow approach analyzing only the specific impact of a certain economic activity on energy consumption and CO2 emissions (Hatzigeorgiou, Polatidis and Haralambopoulos, 2011), or other environment impacts (Tapio, 2005; Diakoulaki and Mandaraka, 2007; Jun Li, 2011). Nowadays this concept and its elements are also widely used in a number of strategic policy documents, both by international organizations (EC, 2011; UNEP; 2011; BIO Intelligence Service, 2012) and by a number of political strategies for sustainable development of individual countries. Despite all these contributions, regional studies on this theme are just beginning to emerge (Coenen, Benneworth, Truffer, 2012) and Ukraine reality in this subject remains untouched.
Schematically, the concept of decoupling is shown in Figure 1. In this case, the environment is seen as a source of rights for ecosystem services, the quality of which can be significantly reduced due to the low efficiency of social and economic activity. On that figure (Fig. 1), resource decoupling is relative, since the rate of resource use is positive, but lower than the rate of economic growth, and the decoupling of environmental impacts is absolute.
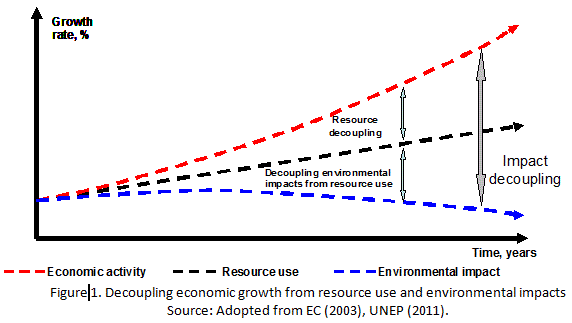
Building on such foundations, resource decoupling means reducing the rate of resource use per unit of economic activity. This ‘dematerialization’ is based on using less material, energy, water and land resources for the same economic output (UNEP, 2011).
Impact decoupling, by contrast, requires increasing economic output while reducing negative environmental impacts. Impact decoupling means using resources better, wiser or on more cleanly way. Reducing environmental impacts does not necessarily reduce resource scarcity or production costs, and may even increase them (UNEP, 2011).
In this paper we examine impact decoupling on regional level. Such impacts arise from the consumption of natural resources by pollutant emissions into the atmosphere. Impacts are decoupled when negative environmental impacts decline while value is added in economic terms.
3. Methodology for Decoupling Analysis
From the two set of parameters commonly used in the decoupling analyses (economic growth versus resource use and economic growth versus environmental impacts), this study will be focused exclusively in the comparison of economic growth and environmental impact.
Methodologically, the selected variables used in this study are:
- GDP (Gross Domestic Product) and GRP (Gross Regional Product) as a way to represent economic activity in Ukraine and its regions;
- Pollutants emissions as the contribution of the economy to the environmental impacts.
The empirical analysis has been carried out using annual data for the period 2003–2012 for Ukraine and its regions, collected from two complementary sources:
- GDP and amount of pollutants emission data are taken from State Statistics Service of Ukraine;
- GRP and amount of pollutants emissions data in regions came from Departments of Statistics of Ukraine Regions.
Environmental quality can be significantly reduced due to low efficiency of social and economic activity. In this study, environmental impact will be judge by pollutant emissions into the air, and economic growth by the volume of gross regional product (GRP). Thus, the decoupling of economic growth and pollutant emissions can mean two things:
- GRP is growing faster than emissions – relative decoupling;
- GRP increases and emissions remain at the same level or decreased – absolute decoupling.
There are a number of possible approaches to the comparison of economic growth and its impact on the environment. It is possible to use both absolute figures or, instead, relative values in per capita of total population. Each method has its advantages and disadvantages. At the regional level it is certainly advisable to use figures in per capita, as this will compare regions regardless of their size. However, the disadvantage of this approach is that with an increase or decrease in region’s population, these figures will give a distorted picture. Absolute values show the actual situation in the region, but do not take into consideration its size in population.
In what concerns to the time interval studied a long-term trend must be identified at least from a ten years period. The decoupling index is estimated as ratio of pollutant emissions and GRP at the end and the beginning of the selected periods. Mapping method can represent both degrees and indexes of decoupling.
One other coefficient that is used to study the decoupling is elasticity relationships between indexes, for example between the dynamics of emissions and GDP (Tapio, 2005). At the regional level it can be used GRP and emissions of air pollutants, and so the elasticity coefficient (Ð ) = %âemissions / %âGRP.
Elasticity 1.0 means that dynamics of emissions and GRP are the same. Decoupling can be expressed as elasticity values under 1.0, this means that the dynamics of the emission is lower than GRP, and otherwise the contrary.
Tapio (2005) proposes dividing the results using dynamic + / - 20% to analyze the size (strength) of changes. Taking into consideration the dynamic of main indicators and the slow transition processes in environmental policy in the case of Ukraine, it’s better to use 10% variation to interpret slight changes as significant.
Thus, regions will be accordingly divided into three groups:
- elasticity coefficient indices up to 0.9
- elasticity coefficient – between 0.9 to 1.1
- elasticity coefficient – 1.1 and more.
On the other hand, it is quite necessary to deal with the types of decoupling. “Strength” of decoupling can be absolute or relative, “direction” of decoupling – positive or negative and “form” of decoupling – recessive or expansive. According to this structure and basing on framework of Vehmas et al. (2003) and Tapio (2005), there can be distinguished eight logical states of decoupling (Figure 2).
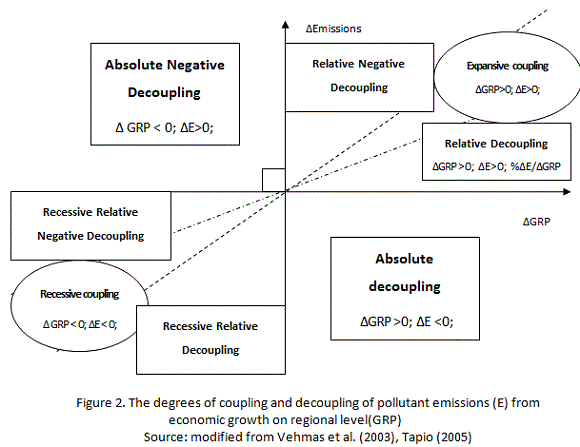
This theoretical and methodological model was called by Finel and Tapio (2012) as the Decoupling Diamond. The Decoupling Diamond model helps to identify the degrees of decoupling and to understand the essence of the processes taking place in the country regions.
Empirical results and discussion
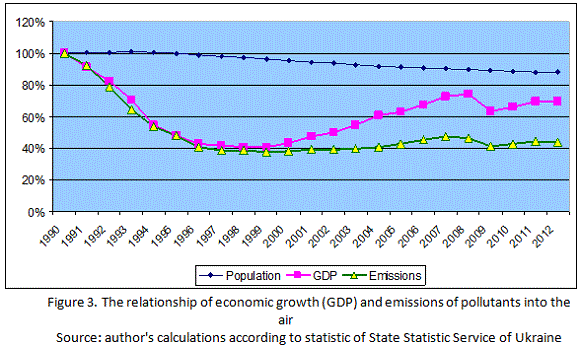
By analyzing the dynamics of the GDP, population, and emissions of pollutants into the atmosphere (Figure 3), it is observed different tendencies in the growth rates of economic activity and pollutant emissions in Ukraine from 1990 to 2012. Results indicate that there is correlative time series as well as a period of relative decoupling. Growth rate of emissions and GDP of Ukraine fully followed one another until 2000. Over the last twelve years, the GDP growth rate is significantly higher than those of emission reductions but in general the trend is positive, indicating the relative separation between these parameters. Between 2000 and 2012, gross domestic product increased in real terms by three-quarters, while the volume emissions into the air only one-fourth. This suggests that the long-awaited decoupling of economic and emissions growth has begun.
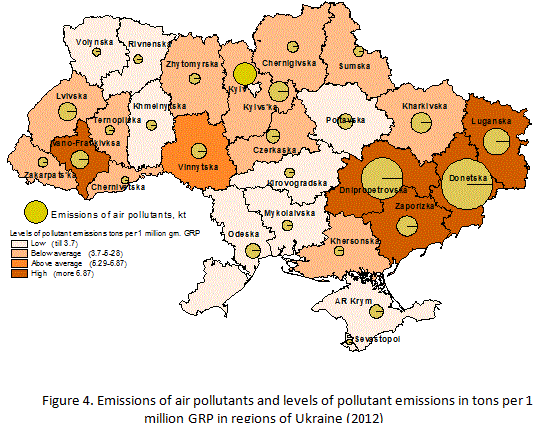
To study the current situation of pollutants in the atmosphere we conduct a comparison of the volume of GRP, population and the surface of regions. Comparative indicators make it possible to determine the eco-efficiently regional economies, as well as to identify the most environmentally polluting regions. Comparison between volume of pollutants with region’s inhabitants shows the magnitude of human impacts on atmosphere, with region’s area shows the concentration of pollutant emissions per square kilometer, and with GRP shows environmental friendliness regional economies.
For better understanding of the regional processes, it’s important to mention that Ukraine is composed by 24 oblasts (provinces), two cities with special status (Kyiv and Sevastopol) and the autonomous republic Krym (AR Krym).
According to average level of pollutant emissions per 1 million GRP, regions could be divided into four groups, showing that volumes of pollutant emissions are regionally very different (Figure 4). The difference between the highest and the lowest value is around 10 times. Highest levels of emissions per 1 million GRP are in Donetska, Dnipropetrovska, Zaporizka, Luganska and Ivano-Frankivska oblasts. These five regions achieved 60% of cumulative emissions in the country. Only Vinnytska oblast is present in the second group, which values are between average and 30% more from it. The most numerous groups are the next two, which are characterized by low and lower than average values. The group of below average values consists of 11 oblasts, mainly western and central regions of Ukraine, which totally give 22% of country surface and their values are not lower 30% than average. Group of low values of emissions per 1 million GRP includes 10 regions from west, central and south parts of Ukraine (fig.4) and their share is only 16% of country.
To understand these differences the crucial factor of eco-effective region is the structure of the economy, namely the share of services, industry and agriculture. This can be verified by comparing the share of services in regions and the emissions of air pollutants per 1 million GRP (Figure 5). The correlation between these two indicators is strong, as the greatest value share of services in Kyiv region correspond to maximum efficiency, and the smallest share of services in the Luganska oblast corresponds to one of the greatest values of emissions.
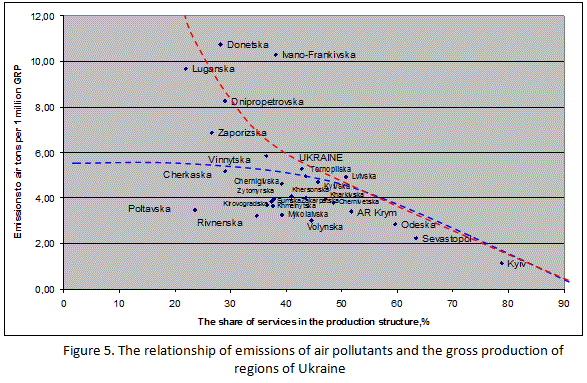
The correlation coefficient is 0.82 between the two indicators, as a result it indicates the existence of a strong relationship between them. A total correlation between those two indicators can not exist, because the final value is influenced by several other factors that are expressed in positive or negative deviations (Figure 5, red and blue lines). Some important factors to explain these deviations can be the following: location of power plants, metallurgy and chemical industries, use of different energy sources, outdated equipment of the Soviet Union etc. For example, at about the same share of services in Sumy and Ivano-Frankivsk regions, emissions to the atmosphere for 1 million GRP are different in more than 2 times. The lowest share of service is in Poltava and Luhansk regions, however, environmental effectiveness of their economies is significantly different.
Comparison of air pollutants emissions and GRP per capita allow to group regions (Figure 6). A group of 19 regions present values in both parameters that are less than the average for Ukraine. In this group, we found those regions with the low values of human impact on the atmosphere and that correspond to low values of GRP per capita.
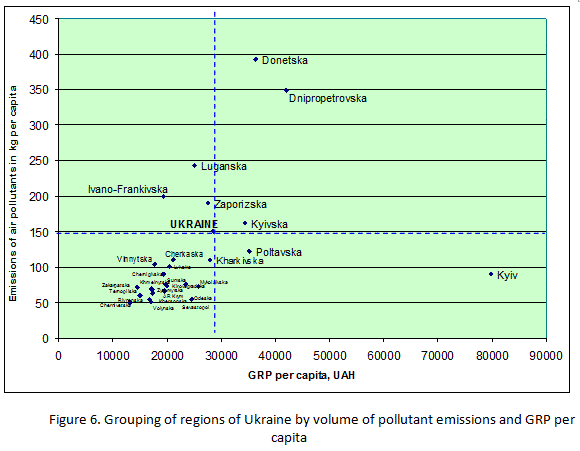
In the opposite situation we find Donetska, Dnipropetrovska and Kyivska oblasts, where a high GRP per capita is based on significant amounts of pollutant emissions. However, differentiation in the amount of exposure to the atmosphere between Kyiv and Donetsk and Dnipropetrovsk regions are very significant.
The less effective economic activity is in Zaporizska, Ivano-Frankivska and Luganska oblasts (Figure 6), where the values of both indicators are below the national average in GRP per capita despite being above Ukraine average in pollution emissions. The situation in the Ivano-Frankivsk region is especially difficult, where there is one of the greatest values of emissions per capita in the country to comply with one of the lowest values of GRP. Only two oblasts, Poltavska and Kyivska, are characterized by low emissions and high values of GRP per capita.
As mentioned, theoretically the Decoupling Diamond method can identify 8 types of decoupling states based on dynamics of two indicators. According to assessment for years 2003-2012, Ukraine regions can only be divided into four groups (Figure 7).
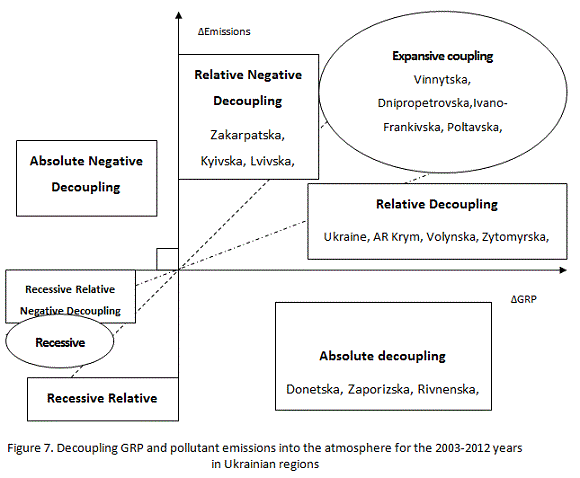
Group 1 corresponds to regions with a strong decoupling effect. This group represents regions that are characterized by absolute decoupling indicators: a growing economy ( ΔGRP Ë 0) with a reduction of emissions into the atmosphere ( ΔEmissions Ë 0; ΔEmissions / GRP Ë 0). This group includes four regions: Donetska, Zaporizska, Rivnenska oblasts and Sevastopol. The positive is the fact that this group includes two industrial regions of the country, but the rate of decoupling remains quite low (Figure 8). It is clear that eco efficiency improvements were higher in the most pollute sectors, especially in the ferrous metallurgy and chemical industry. All four regions are characterized by no high rates of economic growth over the period – in the range 115-125 %, which means that the distinction was achieved mainly due to some improvement of existing production processes.
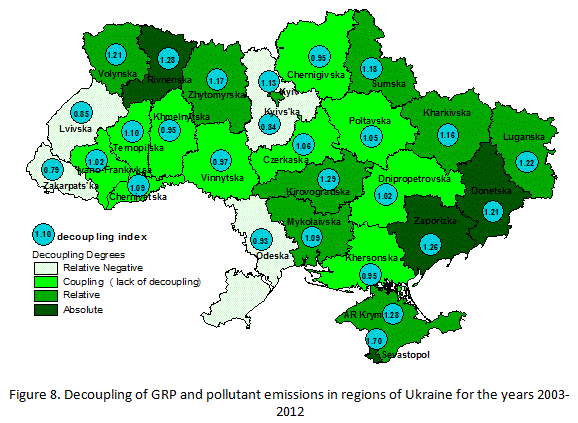
Group 2 corresponds to regions with a sufficient decoupling effect. This group is characterized by a relative decoupling indicators as economic growth proceeded at a faster rate than emissions: ΔGRP Ë 0; ΔEmissions Ë 0; ΔEmissions / GRP = 0-0,9%. These trends are observed in the AR Krym, Volynska, Zhytomyrska, Kirovohradska, Luhanska, Mykolaivska, Sumska, Kharkivska oblasts and Kyiv. This group (Figure 8) mainly includes regions that are characterized by relatively high rates of economic growth (over 125%), with the exception of Luhansk and Sumy regions.
Group 3 corresponds to regions with no decoupling effect. These regions are characterized by intense bond dynamics of pollutants in the atmosphere and GRP. Economic growth is accompanied by a corresponding negative impact on the atmosphere: ΔGRP Ë 0; ΔEmissions Ë 0; ΔEmissions / GRP = 0,9-1,1%. This group includes Vinnytska, Dnipropetrovska, Ivano-Frankivska, Poltavska, Ternopilska and Cherkaska, Chernivetska, Khersonska, Khmelnytska and Chernihivska oblasts.
Finally, group 4 corresponds to regions with a negative decoupling effect. This last group includes regions where there are negative relative decoupling indicators, as growth of emissions are exceeding the dynamics of economic growth: ΔGRP Ë 0; ΔEmissions Ë 0; ΔVAP / GRP Ë 1,1. This includes Zakarpatska, Kyivska, Lvivska and Odeska oblasts.
The regions presenting low pollutant emissions are expected to face more difficulties in promoting measures to reduce emission, compared to other regions with high emissions. Thus, it is necessary to rescale efforts across the Ukraine territory by taking into consideration regional differences in the pollutants emission. This is a challenge that must be faced as we now know that despite the above mentioned structural differences, some industrial regions have succeeded in reducing the overall emissions into the atmosphere. To plan this process it is important to know the regional decoupling indexes of the country, those values must be taken into consideration by the Government when defining the regional environmental and economic policies for Ukraine.
5. Conclusions
Ukraine economy, like the most other post soviet countries, has been undergoing a long-term structural change with a deep drop of industrial production and the formation of the new economy. This study concluded that in this economic restructuration process some Ukraine regions are clearly more eco-efficiently than others.
At present the environmental impacts of economy are completely different across Ukraine regions. A regional analysis of the causal relationships between GDP and pollutant emissions for the 2003–2012 time period, indicates that there is a group of five Ukrainian regions which achieved 60% of cumulative pollutant emissions in the country, and there are no reasons to believe that the transformation to an environmentally sustainable development of Ukraine implies any significant set back in citizen’s quality of life. The transitions will require an almost revolutionary change in economy of industrial regions, which is still based on soviet manufacture complex. But that is possible as we have detected trends stating that some industrial regions are pursuing growth by reducing environmental impact. Those regions are Donetska, Zaporizska, Rivnenska oblasts and Sevastopol, where absolute decoupling of GRP and pollutant emissions happened during last ten years. Possible reasons for the decoupling of emissions and economic growth in those regions are gradual investment in the renewal of Soviet technologies in the industrial sector, especially in metal and chemical industries.
Unfortunately, plenty of regions have economic growth given by activities that are more and more environmentally inefficient, especially in the manufacture sector. The worst situation is in Dnipropetrovska, Ivano-Frankivska, Kyivska, Lvivska and Odeska oblasts.
Dynamics of positive changes that occurred in the last decade with the decoupling tendency already observed in some regions should evolve in order to spread across the Ukrainian territory, especially to the eastern regions where the regional economic structure needs further changes. To manage these processes it is important to know the evolution of the regional decoupling indexes of the country, but apart from monitoring results it is also relevant to define goals to be achieved for next decade, that should be accomplished from a variety of actions developed by public authorities. However this is still a challenge as we concluded that the decoupling processes across this territory have been mainly chaotic without proper public control, support or coordination. Further decoupling processes depend on attractiveness of ecological investments and activities by local and state authorities. For that purpose, and based on the conclusions of this study, it is important that governmental authorities prepare development strategies for ecological public management on a regional level.
The analysis conducted in this study provides useful information to establish links between regional environmental policy and regional economic policy, but further studies from a sectorial-regional perspective would be useful to elucidate which sectors contributed more to the observed decoupling processes in Ukrainian regions.
6. References
BIO Intelligence Service, Institute for SE and SERI (2012). Assessment of resource efficiency indicators and targets. Final report prepared for the European Commission, DG Environment [ Links ]
Bithas, K. Kalimeris, P. (2013). “Re-estimating the decoupling effect: Is there an actual transition towards a less energy-intensive economy?”. Energy 51, 78-84
Charlita de Freitas, L. Kaneko, S. (2011). “Decomposing the decoupling of CO2 emissions and economic growth in Brazil”. Ecological Economics 70, 1459-1469
Coenen, L. Benneworth, P. Truffer, B. (2012). „Toward a spatial perspective on sustainability transitions”. Research policy 41, 968-979.
Diakoulaki, D. Mandaraka, M. (2007). “Decomposition analysis for assessing the progress in decoupling industrial growth from CO2 emissions in the EU manufacturing sector”. Energy Economics 29(4), 636-664.
EC (2003). Towards a Thematic Strategy on the sustainable use of natural resources. Communication from the Commission to the Council and the European Parliament, Brussels. [ Links ]
EC (2010), Preparatory Study for the Review of the Thematic Strategy on the Sustainable Use of Natural Recourses, Bio Intelligence Service, [ Links ] Final Report.
EC (2011). Roadmap to a Resource Efficient Europe. Communication from the Commission to the European Parlament, the Council, the European economic and social committee and the Committee of the region, Brussels. [ Links ]
Finel, N. Tapio, P. (2012). Decoupling transport CO2 form GDP, Finland futures research centre. FFRC eBOOK 1/2012 Finel, Tapio & Finland Futures Research Centre, University of Turku.
FGG, Federal Government of Germany (2008). Progress Report 2008 on the National Strategy for Sustainable Development. Berlin [ Links ]
Hatzigeorgiou, E. Polatidis, H. Haralambopoulos, D. (2011). “CO2 emissions, GDP and energy intensity: A multivariate cointegration and causality analysis for Greece, 1977–2007”. Applied Energy 88, 1377-1385
Jun Li (2011). „Decoupling urban transport from GHG emissions in Indian cities – A critical review and perspectives”. Energy policy 39, 3503-3514
Kveiborg, O. Fosgerau, M. (2007). “Decomposing the decoupling of Danish road freight traffic growth and economic growth”. Transport policy 14, 39-48
Lu, I. Sue J. Lin, Lewis, C. (2007). “Decomposition and decoupling effects of carbon dioxide emission from highway transportation in Taiwan, Germany, Japan and South Korea”. Energy policy 35, 3226-3235.
McKinnon, A. (2007) “Decoupling of Road Freight Transport and Economic Growth Trends in the UK: An Exploratory Analysis”. Transport Reviews: A Transnational Transdisciplinary Journal 27(1), 37-64.
Nufar Finel & Petri Tapio (2012). Decoupling transport CO2 form GDP, Finland futures research centre. FFRC eBOOK 1/2012 Finel, Tapio & Finland Futures Research Centre, University of Turku.
OECD (2002). Indicators to Measure Decoupling of Environmental Pressure from Economic Growth. Sustainable Development. SG/SD (2002) 1/Final. [ Links ]
Parliament of Ukraine (2011). Pro osnovni zasady (strategiu) derzavnoi polityky Ukrainy na period do 2020 roku (Basic Principles (strategy) of State Environmental Policy of Ukraine for the period up to 2020). Kyiv [ Links ]
Sjöström, M. Östblom, G. (2010). “Decoupling waste generation from economic growth – A CGE analysis of the Swedish case”. Ecological Economics 69, 1545-1552
Sorrell, S. Lehtonena, M. Stapletona, L. Pujol, J. Champion, T. (2012). “Decoupling of road freight energy use from economic growth in the United Kingdom”. Energy Policy 41, 84-97.
Tapio, P. (2005). “Towards a theory of decoupling: degrees of decoupling in the EU and the case of road traffic in Finland between 1970 and 2001”. Transport Policy 12(2), 137-151.
UNEP (2011). Decoupling natural resource use and environmental impacts from economic growth, A Report of the Working Group on Decoupling to the International Resource Panel. Fischer-Kowalski, M., Swilling, M., von Weizscker, E.U., Ren, Y., Moriguchi, Y., Crane, W., Krausmann, F., Eisenmenger, N., Giljum, S., Hennicke, P., Romero Lankao, P., Siriban Manalang, A., Sewerin, S. – 174p.
Vehmas, J. Malaska, P., Luukkanen, J., Kaivo-oja, J., Hietanen, O., Vinnari, M. Ilvonen, J. (2003). Europe in the global battle of sustainability: Rebound strikes back? – Advanced Sustainability Analysis, Publications of the Turku Scholl of Economics and Business Administration, Series Discussion and Working Papers 7:2003, Turku.
Zhang, Z. (2000). Decoupling China's carbon emissions increase from economic growth: an economic analysis and policy implications. World Development 28 (4), 739–752.

