


 Inglês (pdf)
 Artigo em XML
 Referências do artigo
 Enviar este artigo por email
 Citado por SciELO
  Similares em
SciELO
Similares em
SciELO 
 Permalink
1. Introduction
If, on the one hand, atmospheric discharges detection systems are quite expensive (Gomes et al., 2012). On the other hand, cargo and equipment exposed to lightning in mining areas are also quite expensive. In addition, the safety of workers in the mining industry must be considered (Berger, 2007).
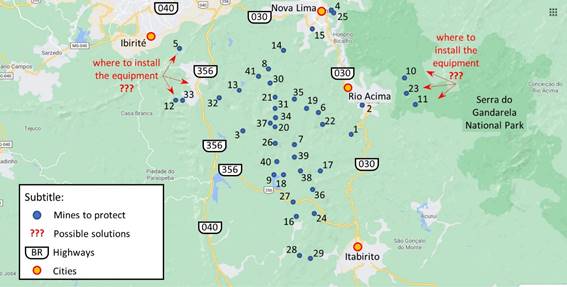
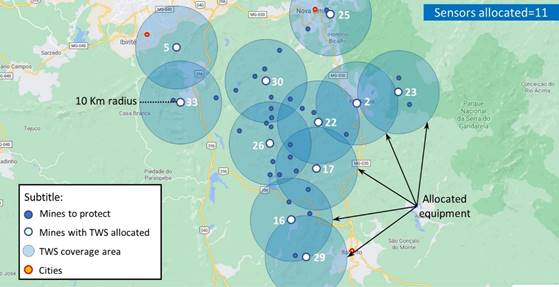
The geographic analysis of the elements that make up the context of this work, through the exchange of theories and concepts between mathematical and geographic sciences, can contribute to more rational decisions (Laudares, Laudares & Libório, 2016). For example, it can serve for minimizing the costs of deploying atmospheric discharge detection systems, protecting equipment, and ensuring the safety of workers in mines. Figure 1 illustrates the problem of the atmospheric discharge detection system allocation for 41 mines of a mining company. The question that arises with this problem is: where to install the atmospheric discharge detection systems to protect all mines with the fewest equipment?
This research reviews several methods of locational optimization (Church & ReVelle, 1974; Farahani, Asgari, Heidari, Hosseininia & Goh, 2012; Bergantiños, Gómez-Rúa, Llorca, Pulido & Sánchez-Soriano, 2020). Based on this review, an optimization method is developed and applied. The results obtained with its utilization are compared with the solutions generated by the use of other two optimization methods.
The solution contributes to the reduction of the costs of implantation of atmospheric discharge detection systems. This contribution may be especially relevant for the expansion of integrated networks of lightning detection sensors, such as, for example, the sensor network of the Metropolitan Region of Paraíba Vale (Magina et al., 2016) which is responsible for protecting the population and public facilities.
2. Thunderstorm Warning Systems
Atmospheric discharge is a natural, seasonal, and destructive phenomenon, occurring because of the accumulation of electrical charges in the atmosphere, usually when storms occurs (Visacro, 2005; Pinto Jr, 2005). The atmospheric discharge can be defined as an intense electric discharge reaching kilometers of extension, with peaks of the current intensity, being able to surpass 1 kA (Visacro ,2005). Atmospheric discharges occur when the electric field, produced by electric charges, exceeds the insulation capacity of the air. At this moment a rapid movement of electrons from a region with negative charges begins to reach a region with positive charges, producing the atmospheric discharge (Magina, Pinto Jr & Naccarato, 2016; Lopez, Perez, Herrera, Aranguren & Porras, 2012). As a result, atmospheric discharges from the cloud may in some cases reach the earth's surface (Pinto Jr, 2005).
Brazil is cited by Pinto Jr (2005) and Magina et al. (2016) as the country with the highest incidence of atmospheric discharges in the world, being reached by about 50 million lights per year each year. In particular, the lightning discharges are frequent, reaching, mainly, people who work outdoors (Pinto Jr, 2005). These accidents cause deaths in 20% of cases. Between 2001 and 2014, it was registered 1,792 deaths, representing 2% of the deaths due to lightning in the world (Berger, 2007).
The study of lightning discharge in urban areas has been gaining space in the specialized literature as urban heating and local physiographic specificities have been related to changes in the frequency and quantity of lightning discharge in urban areas (Stallins & Rose, 2008). Studies show that the increased lifetime of storms caused by the effect of urban heat islands and the concentration of pollution explain the increase in the number of lightning discharge in urban areas (Farias, Pinto Jr, Naccarato & Pinto, 2009). As a result, urban areas have the highest average of lightning discharge per square kilometer, with the frequency of lightning discharges being positively correlated with heat fluctuations (Sokol & Rohli, 2018).
Thunderstorm warning systems (TWSs) fit precisely in this context which the large amount of lightning discharges observed in Brazil exposes people to risks and public and private facilities to potential damage.
In mining industry, protection structures protect the equipment allocated to outdoor works, for example, construction works, drilling, environmental assessments, maintenance and operation of electricity or telecommunications networks, among others (Cooray, 2009; Leite, Modena & Sueta, 2007). The safety of workers in these operations can also be achieved through the use of structures such as detection and warning systems for atmospheric discharges (Lopez et al., 2012; Magina et al., 2016).
TWSs can serve as such system (Lundquist & Scuka, 1971). Unlike passive systems, which protect equipment through fixed bars, cages, lightning rods or grounding techniques (Cooray, 2009), TWSs detect and alert in advance possible atmospheric discharges (Lopez et al., 2012; Magina et al., 2016). Each sensor of TWS covers 10 km radius (Lundquist & Scuka, 1971).
Detection and warning systems monitor the electromagnetic field and the electrostatic field of the storm, detecting possible atmospheric discharges (Magina et al., 2016). Monitoring is performed by a system composed of a set of sensors interconnected to a central processing unit (Lopez et al., 2012). The sensors collect information from the storms that are sent and analyzed by the central processing unit. This analysis indicates the probability of an atmospheric discharge occurring. Risk situations trigger warning signals (Lundquist & Scuka, 1971).
The warning signals, once triggered, create a window, for places like this one, of 32 minutes Lopez et al., 2012). This allows performing worker safety procedures (Berger, 2007; Gomes, Ab Kadir & Cooper, 2012) and protecting equipment (Cooray, 2009; Leite et al., 2007).
3. Optimal location problems
The problem of this research can be formulated as a problem of an optimal location identification. The first studies and theoretical results related to locational optimization problems can be found in Weber (1929). This work, dedicated to the theory of location in the industry, considers geographic factors in the search of the location that minimizes the costs of installation of factories. Later, methods derived from gravitational models emerged, such as the Gravity Point (Reilly, 1931), Inverse Distance Weighting (Converse, 1949), and the Area of Influence (Applebaum, 1966). Although widely used in locational problems in Geography, these methods do not perform any type of optimization.
In Ortiz-Astorquiza, Contreras, and Laporte (2018), several locational optimization methods are used to solve problems associated with the location of facilities. Optimal location methods have been applied to solve different problems in different fields. For example, to indicate the ideal locations of a sensor network for monitoring spatial phenomena (Nguyen, Kodagoda, Ranasinghe & Dissanayake, 2015) or to position sensors for surveillance and monitoring of environmental areas (Mathew & Surana, 2012). The results of (HassanzadehFard & Jalilian, 2018) are associated with determining of places of the installation and sizes of reactive power sources in electrical distribution systems. The authors of (Kuschel et al., 2019) consider a problem of defining the smallest number of radars, providing the maximal area aiming to maximize coverage of the monitored area, observing the positions allowed for their installation (Kuschel et al., 2019). The results of (Tong & Murray, 2017) are directed at configuring the locations of a hospital network to minimize distances between service units and locations, noting demand level at each location (Tong & Murray, 2017).
Another example is to identify optimal locations to install warehouses, observing that the installation costs are composed of fixed part of investment and variable part of investment that varies according to the number of customers to be serviced by the warehouse (Ivanov et al., 2019).
Church and ReVelle (1974) conceptualize the locational optimization problem as the maximization of facilities coverage, having as restrictions a critical distance and a specific number of installations. However, the most common locational optimization problem in actual life is demonstrated in Farahani et al. (2012) and Bergantiños et al. (2020). In these works, the presented coverage problem considers that all facilities must be serviced by at least one type of equipment. This equipment has, in turn, a maximum coverage radius. For example, the costs of deploying emergency facilities can be minimized, satisfying a maximum coverage radius, and the entire set of cities or locations must be met. In Owen and Daskin (1998), the best places to trade, should cover the entire consumer market, and its long-term growth, with the lowest operating costs.
The combinatorial optimization problems associated with localization have their common basis to the application of approximate methods (Blesa & Blum, 2018), in particular, the approximate methods of discrete mathematical programming (Cooper, 1963; Ivanov et al., 2019). The corresponding objective functions have a large number of local minimums, and the problem global solution is to be reached (Gill, Murray & Wright, 2019). The difference between these solutions is shown by Blesa and Blum (2018) as the optimization gap. This gap can be reduced with reallocations or substitutions (Ivanov et al., 2019).
The heuristic methods can be structured and constructed according to the boundary conditions of each problem (Salhi, 2017). Although stochastic methods (Owen & Daskin, 1998), linear programming (Ivanov et al., 2019) and genetic algorithms (Kuschel et al., 2019) can be used in optimal location problems, a heuristic designed specifically for the problem of minimizing the costs of implementing lightning systems can present more satisfactory results.
For example, the greedy methods presented by Church and ReVelle (1974), Owen and Daskin (1998) and Expósito-Márquez et al. (2019). The applications of these methods allows one, for example, to minimize the number of installations, covering the demand, without exceeding the maximum allowed distance using the Greedy Adding (GA) (Church & ReVelle, 1974) or Greedy Adding with Substitution (GAS) algorithm (Expósito-Márquez et al., 2019). The GAS algorithm is similar to the concepts of the traveling salesman and warehouse location, where optimization is also local and global optimization is not guaranteed (Church & ReVelle, 1974).
4. Materials and Methods
4.1. Allocation and Reallocation (AR) method
The Allocation and Relocation (AR) method developed in this research can be performed in three phases: data preparation, processing, and reprocessing.
In this case study, we had to minimize the costs involved in implementing a system for the lightning discharges detection in 41 mines from a private mining company. We highlight that the locations that can install the system have interconnection with the company's automation system, access infrastructure and availability of electricity.
The geographic coordinates of the possible installation points of the sensor system for the protection of the mines were collected. With these coordinates (longitude and latitude), the distances between the mines were calculated (Table 1).
Table 1 Distances between mines (Km)
| 𝑑𝑖𝑗 | n1 | n2 | n3 | n4 | n5 |
| n1 | 0 | 12 | 7 | 16 | 17 |
| n2 | 12 | 0 | 8 | 9 | 9 |
| n3 | 7 | 8 | 0 | 12 | 13 |
| n4 | 16 | 9 | 12 | 0 | 9 |
| n5 | 17 | 9 | 13 | 9 | 0 |
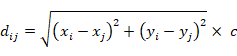
In order to calculate the distance 𝑑𝑖𝑗 Formula 1 was applied, where 𝑥𝑖 is the mine 𝑖 longitude, and 𝑥𝑗 and is mine j longitude and 𝑐 is Earth’s curvature adjustment (see Field, 2018).
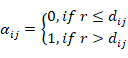
It can be attested that a mine is protected when the maximum system coverage radius (10 km) is less or equal the distance between two mines (Formula 2).
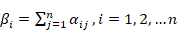
Through Formula 3 it is possible to calculate the system coverage potential for each mine, that is βi:
The use of Formulas 2 and 3 permits one to represent the system coverage potential for each mine, reflected in table 2 creation.
Table 2 System coverage potential per mine
| α𝑖𝑗 | n1 | n2 | n3 | n4 | n5 | βi |
| n1 | 1 | 0 | 1 | 0 | 0 | 2 |
| n2 | 0 | 1 | 1 | 1 | 1 | 4 |
| n3 | 1 | 1 | 1 | 0 | 0 | 3 |
| n4 | 0 | 1 | 0 | 1 | 1 | 3 |
| n5 | 0 | 1 | 0 | 1 | 1 | 3 |
In the AR method the sensors are initially allocated to mines with the lowest βi value. Therefore, when the mine coverage is equal to 1, we allocate a sensor for this mine and remove it from the resource available.
But, as seen, all βi are greater than 1. At the same time, the mine with the smallest β in Table 3 is n1. Next, it was seen that n3 is potentially reached by a sensor installed in n1. Therefore, the protection system allocation was evaluated if n1 is ADEQUATE. To do this it was checked if β3 ≤ β1.
Table 3 System's potential coverage per mine
| α𝑖𝑗 | n1 | n2 | n3 | n4 | n5 | βi |
| n1 | 1 | 0 | 1 | 0 | 0 | 2 |
| n2 | 0 | 1 | 1 | 1 | 1 | 4 |
| n3 | 1 | 1 | 1 | 0 | 0 | 3 |
| n4 | 0 | 1 | 0 | 1 | 1 | 3 |
| n5 | 0 | 1 | 0 | 1 | 1 | 3 |
Since the condition β3 ≤ β1 is FALSE, it is possible to confirm that regarding AR method the protection system allocation in n1 is NOT ADEQUATE. Therefore, protection system should be allocated from n1 to n1. Thus, the mines covered by the system installed in n3 (n1, n2 and n3) are taken from Table 4 and then the process is repeated.
Table 4 System's potential coverage per mine
| α𝑖𝑗 | n1 | n2 | n3 | n4 | n5 | βi |
| n1 | 1 | 0 | 1 | 0 | 0 | 2 |
| n2 | 0 | 1 | 1 | 1 | 1 | 4 |
| n3 | 1 | 1 | 1 | 0 | 0 | 3 |
| n4 | 0 | 1 | 0 | 1 | 1 | 2 |
| n5 | 0 | 1 | 0 | 1 | 1 | 2 |
The procedure is restarted identifying in Table 4 the mine with the lowest βi value. In this case, the sensor can be allocated in the mines n4 or n5. Therefore, we evaluate whether the allocation of the protection system in n4 or in n5 is ADEQUATE. For this, we check if β4 ≤ β5 and/or if β5 ≤ β4. As these relationships are TRUE, we can state that the allocation of the system in n4 or on n5 is ADEQUATE. The procedure repeats until all values are taken off the table.
4.2. Greedy Adding methods
Running the greedy adding method, we identify and allocate a system of sensors in the mine with greater value. Then we remove from the table all the mines served by the allocated system. The second system will always be allocated to the mine with the highest potential until all values are removed from the table.
Running GAS we identify and allocate the system in the mine with greater value. We repeat the procedure to find the location of the second and third sensor. After that, we removed the sensor from the second location and defined a new location for this sensor, looking for the largest mine. Then, we compare the two solutions generated, choosing the one with the largest number of covered mines. In summary, with the GAS method, we change the default locations with each new entry. Iterations are associated with replacing a chosen facility when its change improves maximum coverage.
5. Results and Discussions
In this section the results of the application of the methods: AR, GA and GAS are presented and compared, and then evaluated from the perspective of the assumptions adopted, resulting in a smaller number of systems, with the greatest possible redundancy and the ease of replication. Figure 2 shows the results of applying the GA method, which requires 11 sensor system to cover all the 41 mines.
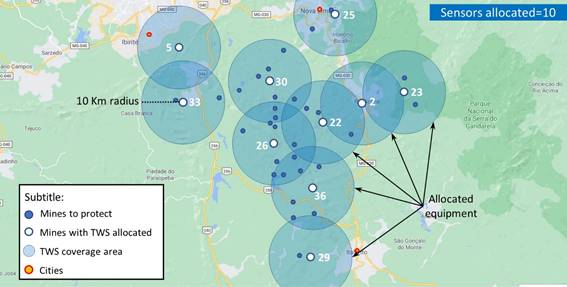
The results of using GAS method, shown in Figure 3, indicate that 10 sensor system are required to fully cover the mines.
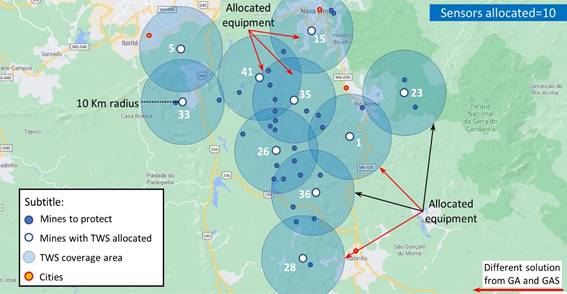
The results from using AR method presented in Figure 4, indicate that 10 sensor system are required to cover the total of mines.
To evaluate the system redundancy premise, we calculate the percentage of mines covered by more than one sensor system or redundancy rate. In order to do this, we identified, in the mine coverage potential table, the mines where the systems were allocated. Next, we select the lines corresponding to these mines, identifying the mines covered by more than one sensor system. From these cases we calculate the redundancy rates for each method. Therefore, GA, GAS and AR methods have respectively 32%, 22% and 32% of the mines covered by more than one sensor system.
Finally, to evaluate the premise of the ease of method replication we calculate the number of iterations required to process them and execute them. The number of iterations can be understood as a relation between effort (time) and complexity (risk of error). This relation is verified in Figure 5, in which we see the evolution of the number of interactions that each method demands to find the solution of the problem, where is the number of sensor system and the number of interactions.
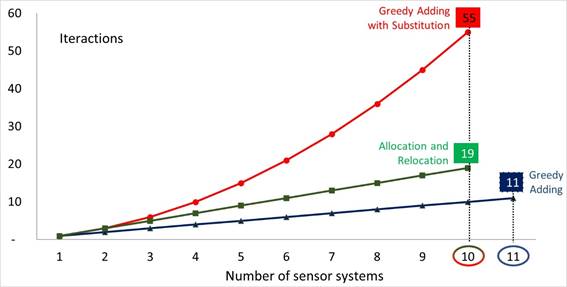
Considering that this iteration requires the approximate effort of 3 minutes, we estimate that the time taken to solve the problem through the GA, GAS and AR methods is 33, 165 and 57 minutes, respectively.
The results from the application of each method, which cover all the mines regarding the premises of minimizing cost, greater redundancy, and greater ease of replication, are summarized in table 5.
Table 5 Methods comparison analysis
| Premise | GA | GAS | AR |
| Solution cost | 11 | 10 | 10 |
| Redundancy rate | 32 | 22 | 32 |
| Replication difficulty | 11 | 55 | 19 |
Following Salhi's (2017) understanding, it was demonstrated that methods designed to deal with specific boundary conditions of the problem of interest produce better results.
The evolution of the number of iterations, which reflects the effort or complexity required for the execution of the AR method is linear with respect to the number of alternatives, allowing its replication for problems with a greater number of mines. Among the three methods, AR is the one with the lowest standard deviation between the systems installation sites. This is a consequence of a better geographic distribution of the systems. Therefore, the AR was obtained, with fewer systems in relation to GA, and a higher rate of redundancy. Finally, the AR was also efficient in the minimum equipment allocation. We found by AR, with greater ease and redundancy, a solution that minimizes the costs of the system implantation equals to that found in the GAS method.
5.1. Contributions, limitations, and future research
This research brings general contributions that will be described in this section. First, it reveals that heuristic methods can be constructed according to the boundary conditions of each problem (Salhi, 2017), but that this construction requires some type of programming (e.g. Blesa & Blum, 2018; Ivanov et al., 2019; Kuschel et al., 2019) that limit a broader replication of these methods in locational problems. Second, it offers a heuristic method that: 1) can be easily replicated without any programming; 2) produces an optimal solution to an area coverage problem with minimal resources; 3) can be adapted to similar locational problems, such as, for example, hospital location (e.g. Salgado et al., 2019), location of children’s schools (e.g. Libório, et al., 2020), location of supermarkets (e.g. Baños, Wandosell & Parra, 2016), micro power plants location optimization (e.g. Borges et al., 2019) among others; and 4) stands as an alternative to methods traditionally used in the area of Geography e.g. Reilly’s (1931) Gravity Point, Converse’s (1949) Inverse Distance Weighting and, Applebaum’s (1966) Area of Influence.
Two specific contributions can be cited. First, the application of the AR method reduces the mining company’s costs with TWS to protect workers and equipment exposed to lightning discharges. Second, cheaper TWS are of interest to governments concerned with protecting populations and public facilities in urban areas where there is a greater frequency and quantity of lightning discharges due to the presence of heat islands and pollution (Stallins & Rose, 2008; Farias et al., 2009; Sokol & Rohli, 2018).
This research has three main limitations. First, the method did not consider the relevance of upward electrical discharges in triggering the system alerts. Second, there is no redundancy constraints. Third, although the number of iterations to obtain the optimal solution by the AR method does not grow exponentially as by the GAS method, processing a large number of alternatives can be quite laborious. Exploring solutions for these limitations would be an interesting suggestion for future works. Researchers are also encouraged to implement the AR method for other problems such as environmental, engineering, logistics, marketing or urban problems.
6. Conclusions
The objective of this research was to develop a method for reducing costs of preventive lightning systems in an area containing 41 mines, considering that: the system's sensors have a range of 10 km; all mines must be covered by at least one sensor; the total number of sensors to be installed must be as small as possible; the method must be easy to replicate and should not require any programming; the redundancy of sensors per mine is not mandatory, but it is a desirable feature.
The achieved results show that the AR method developed in this research fulfilled the proposed goals. First, because all 41 mines were covered by at least one sensor. Second, because the solution obtained by the AR presented the best arrangement of sensors number, redundancy rate and replication difficulty. Third, because AR can be easily replicated without the need for programming, using spreadsheets such as Microsoft Excel. The number of sensors that determine the cost of the lightning detection system decreases from 11 to 10 sensors when using the AR and GAS methods. The sensor redundancy rate per mine increases from 22 to 32 when using the AR method instead of the GAS method. The difficulty of replication, the relation between time effort and complexity or risk of error, falls from 55 iterations using the GAS method to 19 iterations using the AR method.

