


 Inglês (pdf)
 Artigo em XML
 Referências do artigo
 Enviar este artigo por email
 Citado por SciELO
  Similares em
SciELO
Similares em
SciELO 
 Permalink
1. Introduction
The squares emerge from the Greek agora, as an open and central space in the cities where both market activities and democratic practices of public assemblies took place (Robba & Macedo, 2003). A similar model was applied by the Romans and, afterward, in the Renaissance these spaces were valued with better harmonization to the built environment (Paradeda, 2003). In the colonial cities of the American continent, the ordered structure proposed by the Law of the Indies stands out, whose urban design started from the determination of a central square (Rhoden, 2004). In colonial Brazil, open urban spaces stood out due to the churches, such as the churchyard, located in front of the chapels (Robba & Macedo, 2003). But it was with the arrival of the royal family and its court (in the transfer of the Portuguese capital to Rio de Janeiro in 1808) that, according to Paradeda (2003), the first gardens appeared (i.e., the squares with trees).
Following varied landscape influences, such as French, English, or Japanese gardens, with more or less afforestation, or with more or less structuring of paths, furniture, or support equipment, several open spaces are found in Brazilian cities, especially after the middle of the 20th century (Oliveira et al., 2013). However, the Brazilian city reflects the inequality of its society and the neighborhoods of the wealthier socioeconomic classes tend to be better structured and to concentrate the presence of green areas and leisure spaces, while the poorest localities tend to be relegated to the absence or disqualification of squares (Rodrigues & Barbosa, 2010). Brazilian legislation does little to help because the creation of “public leisure spaces and green areas” appears only in the article that deals with preemption in the City Statute (Brasil, 2001). The Federal Law that deals with the division of urban land (Brasil, 1979) does not consider green areas as basic infrastructure for areas of social interest (for low-income people), nor does it provide for minimum percentages of urban green areas for new subdivisions. It is indicated that the municipalities are responsible for defining the areas for free spaces and community facilities. However, many municipalities do not have rules for the distribution of green areas in their master plans or supplementary laws.
The typological framing of the term urban green area (UGA) is not considered consensual (Bargos & Matias, 2011; Silva et al., 2016). Green spaces can be considered any areas with vegetation in the urbanized environment, such as: parks, forests, lawns, open spaces, trees on sidewalks, or residential gardens (Kabisch et al., 2015); conservation units, central flowerbeds in interchanges and road roundabouts (Bargos & Matias, 2011); pastureland and cropland (Ghimire et al., 2017); vegetation internal to institutional compounds, also wetlands or any open and uncovered land around cities (Nero, 2017). Bargos & Matias (2011) reviewed several concepts and typologies used in Brazil to refer to green areas (or free spaces), pointing out the lack of consensus, among other things, about the need or not to: be a public space or private, having the presence of arboreal vegetation (and what should be the predominant size), having a permeability of the ground, exercising a leisure function for the population.
Considering that there is no conceptual consensus, for the present work some typologies were adopted, appropriate to the context of the case study. The squares, in general, according to Robba & Macedo (2003), are urban public spaces free of buildings with the possibility of pedestrians' free transit and social interaction among citizens. However, the typologies and nomenclatures of squares in Brazil are also cause for confusion among professionals. The dry squares (praças secas in Brazilian Portuguese) are generally called largos, and since their beginnings they are free and public spaces with little presence of vegetation. They make possible small commerce or political and cultural presentations in the cities (as, for example, the markets that already happened in the Middle Ages) and, therefore, they become a place for direct social interaction. The garden squares are, in general, those that have some vegetation and are usually intended for leisure, rest and contemplation, contact between citizens and nature. Therefore, the term square, in Brazil, is commonly associated with these gardened/landscaped spaces. However, for the present work, all types of urban public spaces intended for the population leisure and conviviality are being considered square, including the so-called dry spaces called largos (if they have some arboreal species).
Parks are also vegetated spaces, but according to Oliveira & Mascaró (2007), they differ from squares due to their larger size and closer proximity to the natural landscape, in contrast to their lower social function. In addition to squares, largos, and parks, green corridors are also highlighted, i.e., boulevards, or wide avenues with larger central flowerbeds and trees (which also have furniture for resting, or a walking path and/or bike lane, or sports courts, or kiosks).
In the cities where the devastation of the original vegetation occurs, giving way to the urban area - paved streets/avenues, buildings, among others - changes are observed in the microclimate (Oliveira & Mascaró, 2007) and the dynamics of flora and fauna (Pena et al., 2017). Green areas are remnants of the natural environment or urban afforestation projects that can help the microclimate and contribute to the ecological networks preserved added to the urban environment, such as the networks of birds, butterflies, bees, small primates. They are related to improvements in attention, mood, and physical activities, and decrease in mortality rates, cardiovascular problems, and violence (Kondo et al., 2018); also, a reduction in obesity (Ghimire et al., 2017) and stress (Mennis et al., 2018), with positive contributions also for active mobility/walkability (Goulart & Günther, 2018). According to Robba & Macedo (2003), green areas provide good environmental values, decisions, and aesthetics. Thus, they become places created or preserved to serve everyone: vegetation, animals, and citizens. According to Gomês & Soares (2003), these are some positive functions of urban green areas:
Atmospheric composition: purifying action by fixing residual materials, cleaning microorganisms, recycling gases through photosynthetic mechanisms, and fixing toxic gases.
Soil-climate-vegetation balance: vegetation softens hot temperatures by filtering radiation, contributes to the conservation of soil humidity, reduces wind speed, maintains soil properties (permeability and fertility), shelters existing fauna in the region, and influences the water balance.
Noise levels: dampens the continuous and discontinuous sound background noises that occur in cities.
Aesthetic: breaking the monotony of the landscape caused by large buildings, valuing the urban space, constitutes an element of interaction between human activities and the natural environment.
Recently, many studies have focused attention on the role of UGA in thermal comfort. The main interest is the urban heat islands (UHI), comparing temperature data with the transformation of vegetation cover in urbanized areas over a given time frame. Examples are studies for Colombo (Sri Lanka), Dalian and Nanchang (China), Columbus (USA), Berlin (Germany), and Lisbon (Portugal) (Ranagalage et al., 2017; Yang et al., 2017; Zhang et al., 2017; Chun & Guldmann, 2018; Sodoudi et al., 2018; Reis & Lopes, 2019). Apparently, there is no consensus on the amount of urban vegetation necessary to achieve these diverse benefits, although some institutions and authors make their proposals.
The ISO 37120:2018 standard brings indicators for quality of life in sustainable cities and communities. In item 21.1, the calculation of the green area (hectares) per 100,000 population is recommended for urban planning. This indicator includes private spaces and even green roofs, and excludes areas that are paved or impervious (i.e., excludes dry squares). Despite having guidelines for calculation, this standard does not provide any reference value to evaluate the result.
Mascaró (2005) mentions some technical guidelines for the amount of green areas that must be maintained in the urban space, which can be abstracted as indicators for calculation. They are an index of green area per inhabitant; a rate (or percentage) of green areas in the urban environment; and a rate of green areas within a given proximity radius. However, some original sources of reference values recommendations considered adequate for evaluating the results of these indicators were not found. For exemple, the area recommended per inhabitant appears in several studies as being attributed to the United Nations (UN) or the World Health Organization (WHO), or even to the United Nations Food and Agriculture Organization (FAO). Values appear as 9 m² (Kuchelmeister, 1998 apud Goméz et al., 2014), 10 m² (Mascaró, 2005) or 12 m² (De Arruda, 2013 apud Silva et al., 2016). However, according to Cavalheiro & Del Picchia (1992 apud Harder et al., 2006), the value is not recognized by these institutions.
Kabisch et al. (2015; 2016) cite some other examples of recommendations for Germany, the Netherlands, the United Kingdom, and general ones for the European context. For the Brazilian context, the reference value of 15 m² per inhabitant is indicated by the Brazilian Society of Urban Arborization (SBAU - Sociedade Brasileira de Arborização Urbana, 1996 apud Harder et al., 2006).
There are recurrent studies on urban afforestation using geotechnologies, such as Geographic Information System (GIS), geostatistics, remote sensing, spatial modeling, among other instruments. A commonly used indicator is the normalized difference vegetation index (NDVI), which can be correlated with other landscape ecology indicators, as applied in studies for cities in Asia (Ranagalage et al., 2017; Zhang et al., 2017). It is a procedure of greater complexity in the execution, generally requiring satellite images for the input database, higher knowledge for software operation, and the interpretation of outputs.
Also, with the support of geotechnologies for mapping, but with a simpler method, with input data more easily collected, speed of application, and uncomplicated interpretation of outputs, there are other procedures applied to UGA studies. From the calculation of areas (which can be separated by typologies) and areas of coverage, the indexes of the green area or vegetation cover are used in several other studies, applied through simple equations related mainly to the quantity of green area per inhabitant or to the percentage of urbanized area occupied by green areas. The total green area index (TGAI) also indexes for neighborhood parks, for usable green areas, for green areas by neighborhood, and the vegetation coverage index (considering tree canopy areas) appear, by example, in studies for the Brazilian cities of Vinhedo, in São Paulo state, and Gurupi, in Tocantins (Harder et al., 2006; Silva et al., 2016)1. In addition to the TGAI, calculations of accessibility to UGA using areas of influence (buffers) appear in studies outside Brazil, such as Coimbra (Portugal) and Salamanca (Spain) (Gómez et al., 2014); and Berlin (Germany), Malmö (Sweden), Ljubljana (Slovenia), Edinburgh (Scotland), Bari (Italy) and Lodz (Poland) (Kabisch et al., 2015, 2016). There are also studies dedicated to the calculation of micro-scale vegetation indices, squares, parks, or street afforestation indices, such as leaf area, shading, and density indices, used in studies for Cuiabá, in Mato Grosso (Brazil) and Gothenburg (Sweden) (Oliveira et al., 2013; Klingberg et al., 2017).
The case study for the city of Rio Grande, in the state of Rio Grande do Sul, Brazil, was initially carried out in 2015 and updated in 2020, considering the green areas of the new subdivisions implanted or under construction. The objective was to evaluate the relationship between urban green areas (UGA) and the effectively urbanized area (EUA) in order to meet the planning recommendations suggested by ISO (2018), and other international bodies and scientific literature, cited by Mascaró (2005). For this, using geotechnologies, it was necessary to carry out the mapping of the UGA, the EUA, and the urban perimeter in AutoCAD Map and systematization together with census data (2010 Census of IBGE, the Brazilian Institute of Geography and Statistics) in ArcGIS. Also in GIS, Voronoi diagrams were generated for the UGA centroids, making it possible to check the concentration or dispersion of green areas in the city space. The methodological outline and some results found are briefly described below.
2. Method and results
2.1. Study area and database
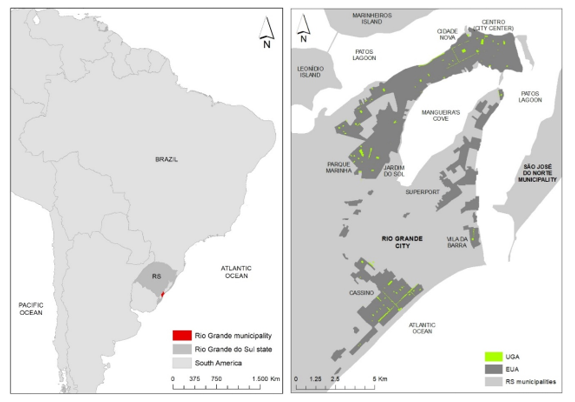
The study of the socio-spatial distribution of urban green areas (UGA) was applied to the case of the effectively urbanized area (EUA) of the city of Rio Grande. Founded in 1737, located in the extreme south of Brazil (in Rio Grande do Sul state) and with a strong connection with water bodies (Figure 1), Rio Grande has a current population projection of about 210 thousand inhabitants, flat topography, and subtropical climate (generally humid and with four well defined seasons). EUA is characterized by 3 main nuclei: (1) the historic center and main economic, commerce, and services area, and the adjacent residential neighborhoods implanted along a sandy cape/small peninsula; (2) the Superport, industries, the Navy, and a neighborhood connected to fishing located in another cape at the entrance of the Patos Lagoon; and (3) the center of commerce and services, and the residential areas of the Cassino Beach neighborhood at the Atlantic coast.
In this area, 221 UGA fragments are found (Figure 1), corresponding to squares, parks, largos and parts of green corridors. The data about the location and typology of the UGA was obtained from the Municipal Coordination and Planning Secretariat (SMCP - Secretaria Municipal de Coordenação e Planejamento) in 2015. It was complemented and updated by surveys in loco and/or with the help of Google Earth carried out by the team of the extension program Geotechnologies in Municipal Management (GeoGM - Geotecnologias na Gestão Municipal) of the Federal Institute of Rio Grande do Sul (IFRS - Instituto Federal de Educação, Ciência e Tecnologia do Rio Grande do Sul), mapped in AutoCAD Map and systematized in the shapefile format for ArcGIS. Census data (2010 Brazilian Census), the shape of Census sectors, the fabric of municipalities and the perimeter of EUA were obtained from the IBGE homepage2 and systematized in GIS. It is noteworthy here that were not considered the green areas inside the private lots, in the sidewalk beds, and the non-urbanized lands on the city edge.
2.2. Indicators
The urban green areas of the city of Rio Grande were evaluated using indicators according to ISO 37120:2018 and to Mascaró (2005), which provide a reasonable empirical basis for calculating urban green areas. Contrary to what is recommended by the ISO, private spaces (internal to lots) and sidewalk trees were not considered in this work. On the other hand, paved largos (dry squares) were considered if they contained at least one tree in flowerbeds.
The index of green areas per 100,000 population can be calculated using Equation 1. For the case of Rio Grande, the values used was: 111.07 hectares of UGA and the population of 185,670 inhabitants (in the census sectors that make up the EUA, according to the 2010 Brazilian Census). The result is 59.82 Ha/100,000 inhab.
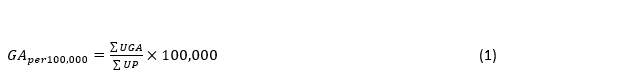
Where: GAper100,000= index of green area (in hectares) per 100,000 population; ∑UGA= sum of the areas of squares, parks, largos and green corridors in hectares; ∑UP= sum of the total urban population of the census sectors corresponding to the EUA.
Another way to measure the index of green areas can be done using the unit m²/inhabitant. Therefore, the total green area index per inhabitant can be calculated using Equation 2 (adapted from Harder et al., 2006), for a total of 1,110,728.16 m² of UGA and the same population. Was found the value of 5.98m²/inhab. This value is below the 15 m² per inhabitant indicated by the SBAU (1996 apud Harder et al., 2006).
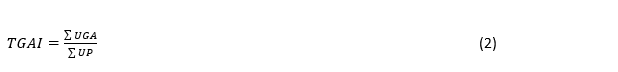
Where: TGAI= total green areas index, or amount of m² of green area per inhabitant; ∑UGA= sum of the areas of squares, parks, largos and green corridors; ∑UP= sum of the total urban population of the census sectors corresponding to the EUA.
The percentage of green area in the urban perimeter was calculated using Equation 3, for an EUA of 45,348,164.64 m². The result of 2.45% was found for Rio Grande.
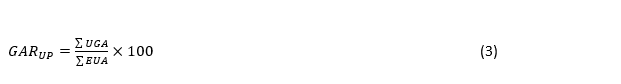
Where: GARUP= rate (percentage) of green areas in the perimeter of the urbanized area; ∑UGA= sum of the areas of squares, parks, largos and green corridors; ∑EUA= sum of the urban areas that make up the EUA.
Empirically, Equation 4 (similar to 3) was adopted to measure the percentage considering not the surfaces of the UGA, but the areas covered by them, according to the influence radius suggested by the literature. Different authors point to different values and here was adopted the influence radius of 600 m suggested by Gouvêa (2008), considering half of this value for high proximity (300 m) and twice for low proximity (1200 m) around of UGA centroids (Figure 2). Nilsson et al. (1997 apud Gómez et al., 2014) says that when the distance is greater than 300 m, daily one in four people stops frequenting these spaces. Therefore, proximity is related to the accessibility of UGA by the population. Considering the high proximity (or high accessibility), the area of influence covers 50% of the EUA in Rio Grande, while for low proximity it covers 84.13%. This shows that there are 15.87% of urbanized areas that are more than 1200 m away from a square or similar.

Where: GARbuf= rate (percentage) of green areas in the perimeter of the urbanized area considering their coverage areas (buffer); ∑BA= sum of the buffer areas around the UGA; ∑EUA= sum of the urban areas that make up the EUA.
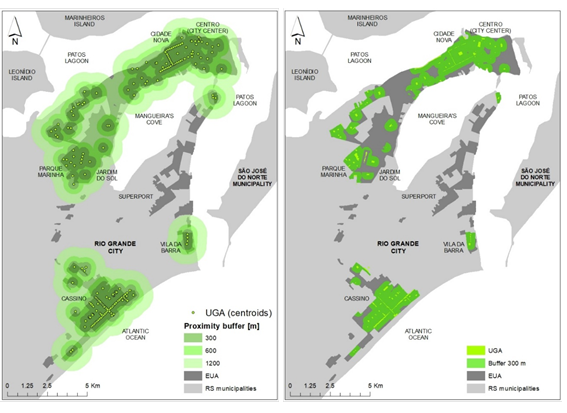
authors
Figure 2 Coverage areas (300, 600, and 1200 meters) around the centroids of the UGA, on the left; intersection of the high proximity areas (300 meters) around the UGA with the EUA on the right.
Afterward, the green areas with 1 Ha or more within a radius of influence of 1 km were measured. For this study, all 22 UGA with an area greater than 1 hectare (Figure 3, left) were used (regardless of the presence or not of recreation equipment), and disregarding the green corridors (due to fragmentation, even if they have recreational infrastructure), totalizing 50.57 Ha. Adopting the same Equation 4 was found that 67.59% of the EUA is in the vicinity of some UGA with more than 1 Ha.
Table 1 summarizes the results obtained with the adopted indicators:
Table 1 Summary of results of the UGA indicators for Rio Grande city.
| INDEX | CALCULATED VALUE |
|---|---|
| GAper100,000 | 59.82 Ha/100,000 inhab. |
| TGAI | 5.98 m²/inhab. |
| GARPU | 2.45% |
| GARbuf | 50% (buffer: 300 m) 84.13% (buffer: 1200 m) |
| GARbuf (for UGA>1Ha) | 67.59% (buffer: 1000 m) |
Source: authors.

2.3. Socio-spatial distribution
Finally, with ArcGIS support, Voronoi diagrams (or Thiessen polygons) were generated for the UGA centroids (Figure 3, right) to verify their concentration or dispersion in the city space. The Voronoi diagram is a space decomposition defined by the distances of a given set of points (Dinis, 2013). It is a method in which the area of influence of each point is determined in function of the others, from the halves of the distances between them in a system.
Even though the Voronoi result was tightly influenced by the fragmentation of the green corridors (partitioned due to the road system), these generally have furniture structures and support equipment. It includes sports courts and tracks (mainly in Cassino) in good condition, surpassing the quality and conservation of many squares and denoting the socio-spatial inequality in the city. Therefore, it can be noted an outstanding concentration of UGA in part of the Centro and Cidade Nova neighborhoods, at the tip of the cape/small peninsula; in the Cassino Beach neighborhood; and part of the Parque Marinha neighborhood (also known as COHAB III).
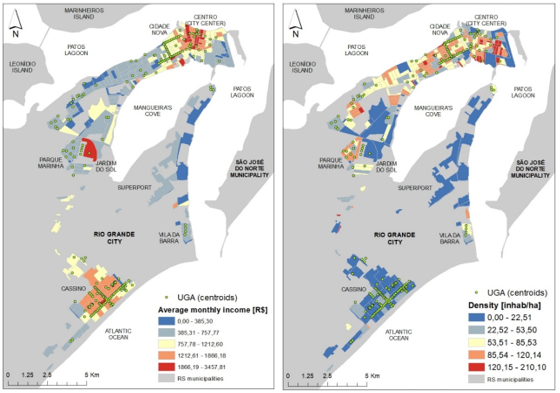
authors, based on data from the 2010 Brazilian Census
Figure 4 Relationship between the green areas centroids and the average monthly income per capita (in Real (R$), the Brazilian currency), on the left; and with the demographic density in the census tracts, on the right.
Visually comparing the result with the thematic map average monthly income per capita of the census sectors (Figure 4), areas with UGA concentration are mostly characterized by high or medium-income per capita; except for the Parque Marinha, with the opposite characteristics, with lower-income average. An exception also stands out for Jardim do Sol, the highest-income neighborhood in the city, which has only one UGA. As for demographic densities (Figure 4), the visual comparison showed greater inconsistency, with concentration both in areas of medium and medium-high density (such as Centro, Cidade Nova, and Parque Marinha) and in areas of low density (such as Cassino). The areas of higher density are apparently poorly served by UGA.
3. Discussion
As seen, apparently, there is no consensus on the amount of green areas needed for a city to achieve the benefits provided by them. Considering the 15 m² per inhabitant indicated by the SBAU (1996 apud Harder et al., 2006), the TGAI value found for Rio Grande is much lower (see Table 1). Low values were also found by other studies for cities in Brazil and Europe (mainly in southern countries) (Harder et al., 2006; Silva et al., 2016; Gómez et al., 2014; Kabisch et al., 2015, 2016), indicating that the theme of green areas remains relevant to urban design in planning actions for new expansions and rehabilitation of consolidated areas. Conversely, Kabisch et al. (2015) found values much higher for Edinburgh, Scotland (31.39 m²/inhab.), and Malmö, Sweden (89.99 m²/inhab.).
Even adopting proximity radius greater than the 300 m threshold alerted by Nilsson et al. (1997 apud Gómez et al., 2014), studies with areas of influence (buffers) make it possible to verify that accessibility does not cover 100% of the effectively urbanized area. I.e., there are still parts of the city with low accessibility. The 15.87% of the EUA that are outside the 1200 m radii (considered here as bad or no accessibility) are mostly located in the Superport, a place with no resident population to be served by UGA. Also, some diffuse nuclei located between the main center and the beach neighborhood are not served, as well as low-income peripheral areas in the south of the beach.
This is in line with the result also observed with the use of the Voronoi diagram. In comparison with the maps of average monthly income per capita, it is possible to verify that the UGA in Rio Grande are concentrated mostly in areas of better income (mainly due to the green corridors). It contributes to socio-spatial inequality in the distribution of green and active public spaces in the city. Green corridors are a nice type of UGA, allowing greater reach and shortening distances, making connections between squares and parks, and can function as corridors for fauna and flora throughout the urbanized territory. In the rest of the city, the scattered green areas without excellent accessibility impair urban vitality, keeping people away from social life, from walking as active and sustainable mobility, from the great benefits for physical and mental health.
4. Conclusions
The methods adopted in the present study can be considered extremely simple. It brings advantages due to the ease and speed of application by technical teams of municipal planning agencies, and for reproduction to constantly monitor and updates the spatial base. Although the method has been shown to be satisfactory, it is necessary to point out some limitations of the present study: (1) some indices were abstracted from recommendations by Mascaró (2005), based on reference values attributed to institutions and authors, but not confirmed as official guidance for urban planning activity; (2) the evaluations did not consider whether the UGA are in good condition, whether they are wooded, whether they have infrastructure for rest and leisure, etc., in order to differentiate from empty land without attractiveness for urban vitality; (3) the UGA were not differentiated between squares, parks, largos and green corridors, which would allow the adoption of other indexes; (4) green corridors were mapped based on the empirical criterion of greater widths and which have some type of leisure infrastructure, but there are other streets or avenues in the city with central beds with benches for resting (or other amenities), which could be included in the spatial base; (5) the partitioning of green corridors by the road system distorted the assessment of UGA concentration with the Voronoi diagram; (6) the evaluations with the thematic maps of demographic density and income were performed only with visual comparison, without mathematical accuracy.
For future work, it is suggested to: (1) use other indicators, such as the indexes for neighborhood parks, for usable green areas, for green areas by neighborhood, for vegetation cover, as adopted by Harder et al. (2006) and Silva et al. (2016); (2) review mappings from previous decades and check the temporal dynamics, assessing whether the situation is getting worse or better in the city; (3) apply the indexes in other cities in the region and compare them, in order to check if there is any regional pattern of green areas planning and distribution; (4) also compare with other cities in Brazil, or in Latin America (e.g., with Uruguayan cities, due to the spatial and cultural proximity), or even in other continents (e.g., with Portuguese cites, due to the colonial influence); (5) update the database with the types and infrastructural and conservation conditions, potentially disaggregating the results; (6) apply spatial correlation between the Voronoi result (or check the possibility of adopting a Kernel map) and the density and income data.
It is hoped that this work can contribute to the debate in the scientific community (as part of the set of case studies on the theme in Brazil), to raise awareness about the importance of green areas and their adequate size and distribution in cities, avoiding inequalities. Also, to raise awareness of the importance of official recommendations and reference values to support planning and scientific research. In addition, it also contributes as a specific result for Rio Grande and as a methodological design to help the Public Administration in decision making for actions that aim to improve the quality of green spaces in the city.

