Serviços Personalizados
Journal
Artigo
 Inglês (pdf)
 Artigo em XML
 Referências do artigo
 Enviar este artigo por email
Indicadores
-
 Citado por SciELO
 -
 Acessos
Links relacionados
-
 Similares em
SciELO
Similares em
SciELO
Compartilhar

 Permalink
CIDADES, Comunidades e Territórios
versão On-line ISSN 2182-3030
CIDADES no.35 Lisboa dez. 2017
https://doi.org/10.15847/citiescommunitiesterritories.dec2017.035.art01
ARTIGO ORIGINAL
A Critical Approach to the Demographics of Ageing: The Case of Oslo
Uma abordagem crítica para a demografia do envelhecimento: o caso de Oslo
Gustavo SugaharaI
[I]Oslo and Akershus University College of Applied Sciences, Norway. e-mail: Gustavo.Sugahara@hioa.no
ABSTRACT
Demographic analysis is on the basis of every city plan. It is often regarded as a technical and indisputable tool to inform policy making. In a strongly contested political environment, information on population is crucial to set priorities and define goals. However, the frequently misinterpretation, or overinterpretation, of demographic information, might also support inadequate public policy design. The increased interest on ageing in the urban context has already resulted in various initiatives all-over the world. The idea of an unsustainable “elderly boom” is a powerful narrative that is frequently used to argue for the need of improved policies for older persons. The article argues that city planners and urbanists inadequate use of demographic assessment of ageing might generate policies that can ultimately work against the interests of the older persons. I use the city of Oslo as an example of the varieties of approaches that can be used to assess ageing on a specific population. Contrary to the general assumption that Oslo will face an “elderly boom”, the study shows that the city's ageing process today is less intense than the observed in the past. A particular attention is paid to the varieties of demographic trends observed within Oslo's different scales.
Keywords : Demography; City planning; Population Ageing.
1. Introduction
Basic information about population is perhaps the most important tool to inform city planners and urbanists. On the basis of every city plan there is a social demographic analyses. Demographic data is also crucial to determine the allocation of funds and to support all sorts of decisions such as the construction or closing of schools, hospitals and roads. City planners relies on current population estimates and long-term forecasts to advise the political debate. Moreover, most of the city standards are expressed in terms of population, for example, the number of students per class room, number of trash bins by resident, etc. (Schmitt, 1952).The Information and Communication Technology (ICT) revolution brought significant improvements to the dissemination, use and inquiry to demographic information. Forecast methodologies and complex statistical models can now be tailored to the city's precise needs, a luxury that was a priori restricted to big and “more important” national surveys. It means that planners can now have relatively easy access to very detailed information about the population they work for. However, the frequently misinterpretation, or overinterpretation, of demographic information, might also support inadequate public answers.
The increasing share of older dwellers is an unprecedented phenomenon. Cities across the globe are waking-up to the new challenges posed by population ageing. The impact of this demographic change in terms of use, construction and adaptation of cities have already caught the attention of city planners (World Health Organization, 2007). Nevertheless, this relatively “new interest” also exposed “a new gap” between demographic knowledge and city planners' needs. When planning for the old, urbanists and city planners frequently forget to ask themselves important questions such as: What are the limitations of demographic knowledge to assess the impact of population ageing?
The idea of an unsustainable “elderly boom” is a powerful narrative that is frequently used to argue for the need of improved policies for older persons. The article argues that city planners and urbanists inadequate assessment of ageing might generate policies that can ultimately work against the interests of the older persons. My main question of inquiry for this article is: “How can a critical approach to the demographics of ageing better contribute to city planning?” As an example, I apply the critical demographic perspective to the city of Oslo, answering a recurrent and apparently simple question that often confronts city planners: “Is this city's population ageing?”
In short, the article arguments that demography knowledge is important for planning and design of public policies in cites. Moreover, it emphasizes the need for a historical, critical and contextual awareness when interpreting and using population statistics.
2.Methods and Structure
A particular attention is paid to the varieties of demographic trends observed within Oslo's different scales. From a metropolitan perspective to a district analysis, the article will present the demographic facts of the population ageing in Oslo and possible explanations for the observed phenomena. Beyond demonstrating the conceptual framework potential, my intention is to offer concrete tools (a blueprint) to anyone intended to assess ageing of a particular population.
The second section presents a discussion about the implications of missuses of demographic information and the methodological challenges brought by the use of chronological age. I start with the conceptual basis for a critical demographic approach on ageing and conclude with a succinct recollection of an extreme case of misuse of demographic information.
The following section applies the critical demographic approach on ageing to the city of Oslo unravelling an apparently simple question: Is Oslo getting older? Using secondary data from Statistics Norway, I will present population indicators based on individual's chronological age divided in three main groups of indicators: (i) the evolution of the population in two specific age groups (67 to 84 years old and 85 years old and above) and the share of persons above 67 years old; (ii) the old age dependency ratio (also based on the 67 cut-off); and (iii) a simple and effective away to assess the population ageing; the evolution of the median age. As Brown and Lynch (in Komp and Johansson, 2015, p. 15) point out, while the first two methods apparently measure the same process as the third, they may stem from very different variations in the balancing equation.
The analyses period is constrained by the information available on the Statistics Norway (SSB) website [2] . The historical data available for municipalities goes back to 1986 and the projections to 2040, SSB use the cohort component method when projecting the population [3] . The information for basic units was collected at the Oslo city's statistics website [4] . All graphs and tables results from my own calculations except when I clear refer the source from where it was extracted.
The forth section will discuss the same phenomena from different geographic scales. I begin with a “macro” analysis of the Oslo Metropolitan Region and continue by a “micro” perspective, focusing on the districts of Oslo. I compare the districts in terms of annual growth rates of the total population and the older population. The variation in the share of older persons is also analyzed.
The last part of chapter four focuses on three districts: Nordre Aker, Frogner, and Sagene. Here, I introduce the gender differences (gap) within the districts. Although the scope of this article does not allow for a deeper analysis of the gender gap, I believe gender is perhaps the most important contextual variable to have in mind when assessing population ageing. Age and old age are strongly framed by gender differences (see for example: Folbre et al., 2006, 2005, 2004; Sara et al., 2003; Spedale et al., 2014). In this sense, when assessing population ageing under a critical demographic approach this particular aspect cannot be ignored.
This point is particularly relevant for city planners as an imbalanced longevity in terms of gender raise completely different policy challenges. To highlight the specific challenges faced by older women it might be sufficient to call attention for the fact that all-over the globe, including most of European countries, poverty rates among older people are consistently higher for women than for men (United Nations, 2017). We can also use the example of health to illustrate that point. Usually woman's health focus has been on reproductive health and maternal health, leaving the growing field of chronic diseases and palliative care out of the radar. The so-called feminization of ageing demands new approaches and innovative policies in all different areas of city planning (see for example: Davidson et al., 2011; Saraceno, 2008).
The concluding chapter highlights the main findings and their relevance for academics and analysts. I suggest future research opportunities and elaborate on the impact of these findings.
3. Demographics of Ageing: A New Take on Apocalyptical Demography?
Different perspectives can be adopted to define old age (e.g. Infeld, 2002; Jan et al., 2014; Komp and Johansson, 2015; Walker, 2014). The critical perspective acknowledge the fact that age and old age are relational processes deeply imbedded in specific relationships among people and places (Cole et al., 2010, p. 19). It also recognize that gerontological knowledge can be used to discipline or control older people and the meanings they make of age (Katz, 1996).
A demographic textbook on population ageing would start by defining population change. Such change is a result of three demographic phenomena: (i) fertility; (ii) mortality; and (iii) migration, the three components of the balancing equation [5] . As explained by Brown and Lynch (in Komp and Johansson, 2015, pp. 13–18), population ageing can result from any changes in that equation.
Population ageing can be defined as the growth in the proportion of a population that is above a particular age (Martin,, 2011, pp. 33–45; Komp and Johansson, 2015). The main driver of ageing globally is the demographic transition from high to low birth and death rates (UN, 2015; United Nations, 2005, 2002a). However, in specific contexts, like a city or country, the immigration variable might prove to be of considerable relevance.
The use of demographic analysis to support catastrophic predictions was inaugurated by Thomas Malthus in his “Essay on the Principle of Population” (1798). His influential work survived the failure of his apocalyptical projections by inspiring new theorists and movements. With the publication of “The Population Bomb” (1995) in the end of the 1960s, biologist Paul Ehrlich became one of the most infamous “prophets of doom”, after Malthus. [6]
Such apocalyptical narratives proved to be a fertile environment for all kinds of policies of population control (Connelly, 2009). In this category, three ideas constitute the backbone of the mainstream perspective on population control: (i) Rapid population growth is a primary driver of the problems of developing countries; (ii) People must be persuaded or even forced to have fewer children; and (iii) Birth control services can be simply delivered “to the poor” in a top-down fashion and in the absence of a basic health care system (Hartmann, 1995, p. xix). Although the general perception towards these policies have significantly changed during the last decades, with many countries reverting them, they will have lasting impacts on population dynamics.
More recently, the “new take” on apocalyptical demography seems to evolve to include only one specific age group: older persons (Robertson, 1997) [7] . After passing the demographic transition and the consequent exponential population growth, a decline in fertility, coupled with an increase of life expectancy has already resulted in significant changes in the age structures of most of developed countries. Since the 1980s, the number of people aged 60 and above has more than doubled, and for the first time in human history, the number of adults aged 65 and above now outnumber children under the age of 5 (UN, 2015). In the face of this new situation, the fine line between analytical facts and an apocalyptical discourse is often crossed.
From a demographic perspective, the growth of the share of older persons is a new and somehow unforeseen event. The industrial revolution and the improvements in health observed since the beginning of 19th century allowed the world population to live longer. After centuries of a virtual stagnating population growth, the world population began to grow exponentially. After reaching its peak in the late 1960s, the annual growth rate of the global population has decreased significantly. The population more than doubled, but did not “explode”.
Population ageing is now one of the main concerns of developed countries. Policymakers worry about an increasing demand for public services, coupled with a reduction in tax revenues (Spijker and MacInnes, 2013). During the post 2008 financial crises, turned economic crises, pension cuts have been omnipresent on austerity programs (Walsh et al., 2015). A thorough summary of the most recent studies on the impact of an ageing population on economic growth is offered by Nagarajan et al. (2016). Although the authors recognize the existence of disputed methodological perspectives, their conclusion is uncompromising: population ageing is a problem of severe gravity [8] .
In order to avoid the apocalyptical perspective I suggest a critical approach to the demographics of ageing. One of the main challenges when defining what it means “to be old” is the simple and uncontroversial fact that chronological age and biological age are not the same. There is no international standard to define old age by a specific age cut-off. However, the UN uses 60 years and above in most of the reference literature (e.g. United Nations, 2011, 2008, 2007, 2005, 2002a, 2002b, 1995), and 65 years is the most common age cut-off used in developed countries.
Age is a critical element in the social organization of individuals and an important tool for understanding, assessing and defining policies, such as the allocation of certain social benefits and the focus on specific needs. For practical purposes, the demarcation of population groups is important, both in analytical terms and for the formulation of public policies. It is through such demarcations that it becomes possible to identify beneficiaries, to focus resources, and to grant rights. In the specific case of the age cut-off for defining older persons, it is argued that the main advantage is its ease of verification and monitoring (Camarano, 2004).
Within academia, the use of age cut-offs has proved to be a very useful tool. Researchers from different traditions of the social sciences have found that such cut-offs provide fertile ground for all kinds of empirical tests. The flexibility allowed by such a definition makes it possible to construct different groups of “older persons” that are in line with the objectives of the different experiments. The development of different perspectives, such as cohort analyses, age stratification, and longitudinal analyses, have been instrumental to reveal, among other things that: (i) Individuals who live under different conditions develop and age differently; (ii) Age is a feature not just of individuals, but of social organization; (iii) Age is used politically and bureaucratically as a principle of social organization and social control; and (iv) Age is also a feature of culture, carrying the force of meaning and power back into the minds and bodies of citizens (Baars et al., 2006).
Despite the fact that chronological age is a major parameter in the organization of most contemporary societies, some argue that an age cut-off, without an appropriate context, offers very little - some will say no - support to improve our understanding of a socially constructed category (Cole et al., 2010; Jan et al., 2014; Komp and Johansson, 2015; Walker, 2014).
In my view, the use of demographic data and age cut-offs are not necessarily incompatible with a critical perspective on ageing. Conversely, as highlighted by Baars et al. (2006) it can be a fundamental tool to highlight the relational and contextual aspects of ageing and old age, core features of the critical approach. With this paper I do, however, call for more nuanced and critical interpretations of demographic information.
4. Is Oslo getting older?
The awareness of the importance of planning for an ageing population has prompted Oslo to increase its commitment to its present and future older dwellers. On May 16, 2014, Oslo was accepted as a European member of the WHO Global Network of Age-friendly Cities and Communities (GNAFCC) [9], which represented a firm political commitment to the values and principles of the WHO program. On the official website dedicated to the network (“Oslo | Age-Friendly World,” n.d.), the main highlights are the (i) report adopted in 2014 [10] and (ii) the national “Action Plan for Increased Accessibility for People With Disabilities”(BLID, 2009).
The first document is a strategic plan for the city of Oslo. It highlights the priorities and necessary changes to promote an active and healthy ageing in the municipality until the year 2024. The second is another plan that envisions Norway as accessible for everyone by 2025 by implementing universal design principles to all public services including: transports; buildings and outdoor environments; communications; and information.
While the strategic plan for older residents unambiguously sustain that the number of older dwellers living in Oslo will continue to grow, and consequently, that there will be an increasing and “unsustainable demand for municipal services”, no further analysis of this important demographic change is offered. In fact, one paragraph from a blog post from 2007 (Brunborg, 2007), and another paragraph from an economic report referring to the Oslo county published in 2015 (Halvorsen et al., 2015) indicates that Oslo is the “youngest” city in the country. It is precisely this knowledge gap regarding population ageing in Oslo the main impulse to write this section. The main objective is to use the critical approach to answer the question: Is Oslo's population ageing?
To assess the dynamics of a determined population, the two most important delimitating variables are: (i) time and (ii) space. Although the city of Oslo is the focus of this article, I will also assess population ageing from a metropolitan perspective (“macro”), and from district [11] and sub-district [12] perspectives (“micro”). The period is constrained by the information available from Statistics Norway [13] . The population indicators for municipalities available on the Statistics Norway website dates back to 1986 and the projections go forward to 2040. The information for sub-districts was collected from Oslo city's statistics website [14] .
Two variables are decisively affecting the balancing equation in Oslo: fertility and migration. The fertility trends in Norway follow a similar pattern to that observed in other European countries. The most influential event is the so-called “baby boom”, which occurred after the Second World War. Although the baby boom occurred in many developed countries, it did not happen at the exact same time. In countries like Norway, Bulgaria and Finland, the Baby Boom happened just after the war. However, it occurred almost thirty years later in countries such as Spain (Ellingsæter and Pedersen, 2015; Marin and Zaidi, 2007, p. 66; Johnsen, 2006 in Ringard et al., 2013, p. 2).
The duration of the baby boom also varied. In Norway, it lasted until the mid-1960s, reaching its lowest level around 1985 (see Figure 1). After a slight increase, the fertility rate remained stable. Figure 1 shows that there are currently no significant differences between the fertility rates nationally and in Oslo County.

The contribution of immigrant women to the fertility rates in Norway has increased over the last decades. According to Tønnessen (2014), the growth of the number of immigrant women of childbearing age (15-49 years) living in Norway is driving the increase in the share of babies born to immigrant women, nearly one in four. The group of immigrant women has quadrupled, from just below 50 000 in 1990 to over 200 000 in 2013. Although the share of babies born to immigrant women has increased, the fertility rate among the same group has not increased.
The same report highlights another interesting fact about the contribution of immigrants to the fertility rates. Since 1990, the number of women of childbearing age who are Norwegian-born by two immigrant parents has risen sharply. This group is dominated by young women who have parents from western Asia, a result of the long-lasting immigration from Pakistan to Norway (Tønnessen, 2014).
Immigration is perhaps the most important variable affecting the equation. Andreassen et al. (2013), highlight an important aspect of the immigration analysis: the existence of a great diversity of categories in which to place an individual. In fact, the same report published by Statistics Norway has thirty different categories that combine the country of birth of children, parents and grandparents.
According to the same study, only five of these thirty categories have more than 100 000 persons. In 2013, individuals born in Norway to two Norwegian-born parents and four Norwegian-born grandparents, count for 76.8 per cent of the population. Statistics Norway defines immigrant as a foreign-born individual with all their parents and grandparents born outside Norway. It is the largest group among persons with an element of foreign background over three generations, representing 12 per cent of the population in 2013.
In 2013, Oslo was home to 24 per cent of all immigrants in Norway and only 9 per cent of individuals born in Norway to two Norwegian-born parents and four Norwegian-born grandparents. The largest neighbouring county, Akershus, had another 13 per cent of all the immigrants in the country. However, although the number of immigrants in Oslo and Akershus is increasing in line with the increasing immigration, the share of immigrants who settle in Oslo and Akershus has fallen steadily over the past ten years (Andreassen et al., 2013, p. 16).
When we look at mobility statistics Oslo's pattern confirms the overall perception that an ageing population is a less mobile one. Despite the consistent negative influx, it is important to point out that the values are not significant in terms of demographic impact as shown on Table 1.
In Norway, the most common age cut-off to define the older persons group is 67 years or above. Although most international studies use the 60 or 65 years to mark the beginning of old age, most Norwegian institutions uses the 67 mark, as this is the age when everyone who has lived in Norway for the last 40 years (after the age of 16) is entitled to a minimum pension.
Another common age-based category used in Norway and in most of European surveys is the Oldest-Old group. The definition of a distinctive group among older persons can trace back to the pioneer work of Bernice Neugarten (1974). One of the main arguments for this distinction is based on the fact that with advancing age, older people suffer more from various conditions. This group can be defined as the population with 80 years or above (Andersen-Ranberg et al., 2005) or 85 years or above (Suzman et al., 1995).
According to the Statistics Norway, individuals above sixty-seven years currently represent some 10.6 per cent of Oslo's population. In absolute terms, older persons in Oslo account for some 39 000 women and 29 000 men, representing 57 per cent and 43 per cent of the older persons group respectively. By 2025, the share of older persons in Oslo will increase to 11.9 per cent, and by 2040 this group will represent 15.2 per cent of the total population (Figure 2).
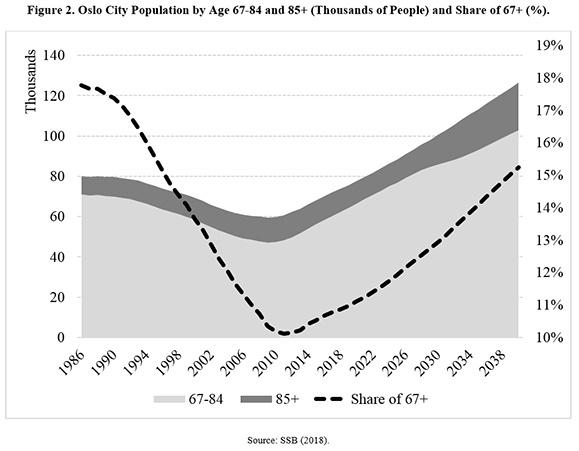
Nevertheless, Figure 2 shows that there are approximately 11 700 fewer older residents in Oslo in 2017 than there were nearly three decades ago. The share represented by older people is also significantly lower, a consequence of a faster increase of the younger groups.

If we disregard these historical statistics, the perspective can change completely. Assuming that the median variant of Statistics Norway's projections proves to be correct, Oslo will not only face a significant increase of the absolute number of older residents, but also a significant increase of the oldest groups (85+) during the course of the next 25 years. Although the share of older persons will remain significantly lower than the share observed at the end of 1980s, within the next ten years Oslo will have, for the first time, more than 80 000 older citizens (see Figure 2).
Not only will the share of older persons increase, but this group will also grow older, with a reduction of the share of the youngest cohorts and an increase of the older ones. By 2040, the age group 70-89 will represent 55 per cent of the older persons population in Oslo, a significant change vis–à–vis the current 43 per cent (Statistics Norway, 2014, Population projections, by sex and age, medium variant, own calculations).
After following a slow, but steady growth trend, reaching its peak in 2010 with 12 560 persons, Oslo's “oldest-old” population is declining. The 85 and over group, will continue relatively stable until 2022, when an exponential increase is expected to start: it will double in less than 18 years. Until now this group has been quite stable, counting some ten thousand individuals since 1986.
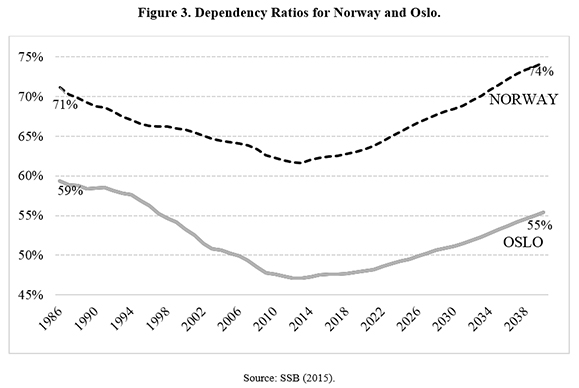
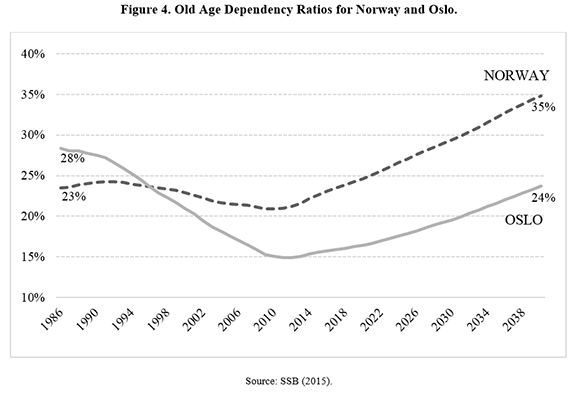
Another common indicator to assess population ageing is the dependency ratio; a simple ratio of the dependent group (children and older persons) to the working age group (here defined as 19-66). Figure 2 compares the dependency ratios for Norway and Oslo between 1986 and 2040.
The main purpose with the dependency ratio is to predict the possible consequences of changes in population age structures, and to measure the burden that specific groups would have to support. The indicator is controversial not only due to the already mentioned age cut-off issue, but also for automatically considering a specific group as dependent [15] .
Recognizing the limitations of the old age dependency ratios based on a standard cut-off point, Spijker and MacInnes (2013) suggest a different approach, based on the idea of remaining life expectancy, as advanced by Sanderson and Scherbov (2008, 2010; 2007). Another alternative is the “retirement dependency ratio”, developed by Allianz International Pensions. This ratio measures the ratio of people currently receiving pension benefits, regardless of age, to those actually working (Miksa, 2016). As these indicators are relatively new and do not bring substantial contribution to illuminate the scope of this article, they will not be analyzed.
As shown in Figure 3, Oslo is in a relatively comfortable position in terms of dependency. Oslo's dependency ratio will not only remain lower than the national level, but will also continue to contribute to a more balanced demographic distribution at the national level. In fact, the share of the so-called dependent group will increase in Oslo at a much slower pace than the observed at the national level (remaining lower than the peak observed in 1986).
Nonetheless, it is important to note that in typical dependency ratios, the dependent group is formed both by young and older citizens. The old age dependency ratio, Figure 4, is the ratio of older persons (67+) to the same working age group. The results reveal that since the early 1990's, the older citizens group as a proportion of the active population is growing faster at the national level than in Oslo. After inverting the positions in terms of old age dependency, the gap will slowly continue to broaden.
The final indicator in this series may offer a less problematic definition of population ageing, or, to be more specific, population distribution. The analysis of the median age of Oslo's population from 1986 to 2040 revealed that 2013 marked the lowest value for Oslo's median age. In this year half of the capital's population was 34 years old or younger, four years younger than the observed in 1986. When trying to answer the question title of this section, the median age can be an interesting indicator as it eliminates the disproportional influence that specific groups might have, such as the centenarians, thus given a better picture of the age distribution. Although the ageing process, in terms of share of population, restarted in 2015, it will not affect the population's median age until 2027.
At this point, it is important to highlight the existence of at least three other indicators commonly used to access population ageing: (i) The Age Index; (ii) The Longevity Index; and (iii) The Centenarian Headcount. The Age index and the Longevity Index are both calculations of the proportion of older persons in relation to another specific group of persons. The first, also known as elder-child ratio, is a defined by the number of people aged 65 (or 67, or 60) and over per 100 youths under age 15 [16] . The second, is the ratio of the number of the oldest old persons (for example aged 80 and over) to the number of older persons of an age when they are presumably economically inactive (aged 65 and over). The last one is often a subject of great curiosity, as it is a simple counting of persons 100 years or more. Those indicators can offer some interesting perspectives about population ageing, but would not provide a clear contribution to the scope of this article.
Figure 3 to Figure 4 present different perspectives to support the same fact: After a relatively long period of rejuvenation, Oslo's population is indeed getting older again. In addition to the national and historical context, another important perspective to improve our understanding of Oslo's demographic dynamics, is the international perspective. A recent report on Ageing in Cities, published by the Organization for Economic Co-operation and Development (OECD), offers a source of comparison (OECD, 2015). The report focuses on metropolitan areas rather than cities, an important territorial distinction that I will discuss in the coming sections. Although a direct comparison with the numbers presented in the previous paragraphs is not possible, the insights provided can be of great value. One of the main findings of the report is that the older population is growing faster than the total population in the OECD metropolitan areas. However, the population trends observed for Oslo differ significantly. Figure 5 shows the annual growth rate of older and total populations from 2001 to 2011 in selected OECD metropolitan areas. In contrast to the majority of the OECD metropolitan areas, Oslo is following a different trend, with a growth of the total population that is slightly higher than the growth of the older population.
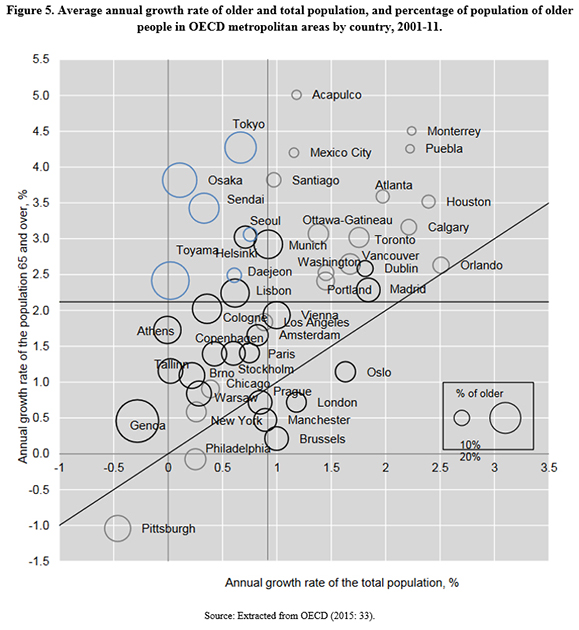
The international comparison corroborates the idea that Oslo is in a privileged position to face the potential challenge of population ageing. Although Oslo is facing a new and unprecedented growth of its older population, the proportion of this group is still lower, and will remain lower, than the same proportion in OCED metropolitan areas with similar characteristics.
5. Ageing in Oslo, using different geographic scales
The deep relationship between Oslo and the neighbouring municipalities of Akershus County is a good example of the importance of metropolitan dynamics. The exchange of residents between municipalities is also related to commuting patterns. In 2015, almost one in every four employees working in Oslo was living in a different municipality.
The Greater Oslo Region ("Stor-Oslo-regionen" in Norwegian) is a statistical metropolitan region, which includes the surrounding areas of the Norwegian capital. The region includes the city of Oslo (634 463 residents), the entire county of Akershus (573,326 res.) and several municipalities in the counties of Buskerud (150 709 res.), Oppland (8 552 res.), Vestfold (27 695 res.) and Østfold (102 808 res.).
Figure 6 introduce the metropolitan context to the city analysis. Even though the period of rejuvenation observed in Oslo also occurred in the surrounding municipalities, its effect was significantly subtler. The share of older persons dropped from 14 percent at the end of 1980s to 11 percent between 2008 and 2011. In absolute terms, the number of older dwellers living in the other metropolitan municipalities remained relatively constant.
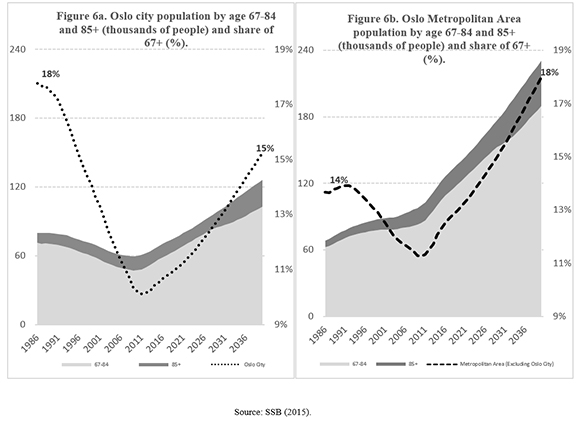
The surrounding metropolitan municipalities are likely to face a greater challenge than Oslo, with both their shares and the absolute numbers of older residents soon to reach unprecedented levels. The most noticeable trend is the accelerated growth of the oldest old group (85+). This group will double from the current 17 500 persons in less than 18 years.
Moving our imaginary lens in the opposite direction, we can observe the different demographic dynamics inside the city of Oslo. The division between East and West is a well-recognized characteristic of Oslo (Hagen et al., 1995; Kriznik, 2015). However, there are other levels of divisions in terms of the social landscape. As suggested by Brattbakk and Wessel (2013), Oslo is marked by two geographical divisions: (i) one between east and west and (ii) another one between the inner and the outer city.
Constructed as a working-class area, Oslo inner east experienced the classic phase of degradation in the period of suburban expansion (1950s-1980s). The outer city evolved with high-income suburbs in the west and low to middle-income suburbs (‘satellite towns') in the east. This basic structure has been reproduced to the present day, although two pronounced changes appear at a lower scale: (i) The variation of the inner east character through gentrification; and (ii) increase deprivation of the outer east, partly through the influx of poor immigrant families (Brattbakk and Wessel, 2013) [17] .
Oslo contains of 15 districts, plus a central region and the forest area (Marka) [18] . Figure 7 highlights the uneven proportion of older persons among Oslo's districts. With a ratio of 166.8 older persons per 1 000 residents, the district of Ullern has the highest incidence of older persons. Despite the fact that Ullern is one of the districts in Oslo with the fewest inhabitants (only 32 757 residents, 5 per cent of Oslo's population) it is the district with the highest share of older persons (16.7 per cent). Ullern is home to almost 8 per cent of Oslo's older citizens.
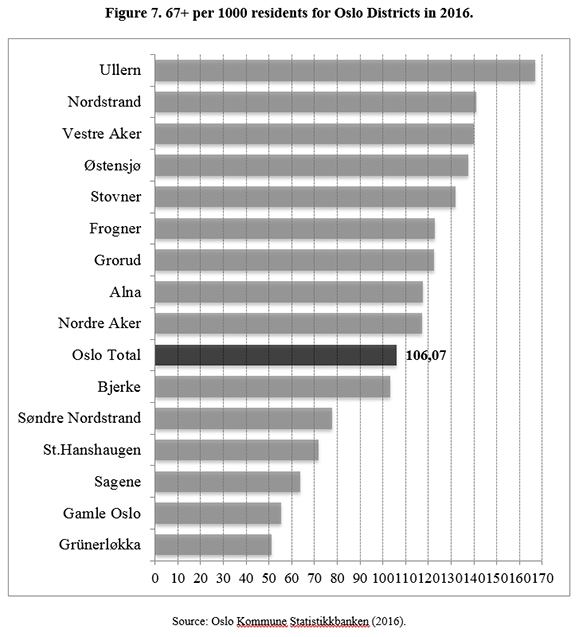
Nordstrand and Vestre Aker also have high incidences of older persons per 1 000 residents; 140.9 and 140.1 respectively. Nordstrand has the second highest share of older residents and is the district that hosts the largest number of older persons, totaling some 7 059, or 10.1 per cent of all older persons living in Oslo.
On the opposite side of the age spectrum, we have the central area and the inner-city districts of Grünerløkka, Gamle Oslo and Sagene. These districts have incidences of older persons per 1 000 residents of 22.2; 51.1; 55.2; and 63.7, respectively. The low number of residents in the Central area, around 1 170 persons, compels us to look at that area apart during our analysis.
Apart from the Central area, the four districts with the highest growth rates of the total population are Grünerløkka, Gamle Oslo, Sagene and St.Hanshaugen (Figure 8). Those districts are also experiencing a decreasing number of older persons. Another characteristic these districts have in common is that their share of older persons is below the city's average. The district of Grünerløkka has the largest difference between its contribution to the total residents in Oslo, 9 per cent, and Oslo's older residents, only 4 per cent.
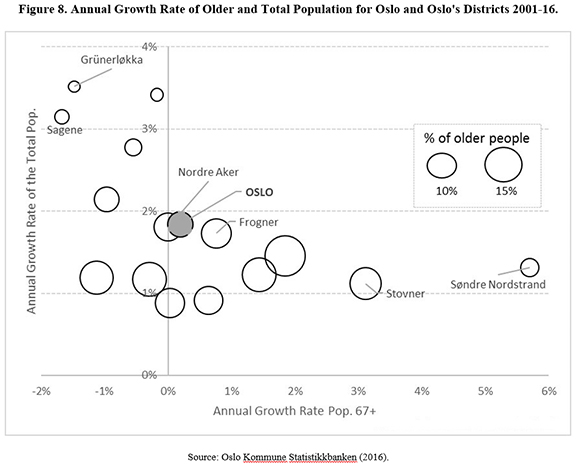
One possible explanation for the distribution observed could be related to the fact that older person's households are typically smaller than the young adults are. According to this logic, when the numbers of elderly fall in a specific district, the total number of inhabitants would grow.
Søndre Nordstrand and Stovner stand out compared to the other districts, with higher growth rates of older residents. In Søndre Nordstrand, the annual growth rate of the older population was 5.7 percent, while it was 1.3 percent for the total population. Stovner already has the 5th highest share of older persons (above 6 per cent), while it is home to less than 5 per cent of Oslo's total residents. Figures Figure 7 and Figure 8 lend support to the claim that geographical scales really matters when analyzing the demographics of ageing.
Ageing dynamics within Oslo's districts
The last part of our analysis explores differences within the districts of Oslo. The historical data available on the Oslo Municipality online database starts in 2001 and is consistent with the findings in chapter 1 for the entire city. There is no forecast data for districts and the age-range (grouping) available does not allow the calculation of median ages.
The scope of this paper does not justify an in-debt analysis of all of Oslo's 15 districts. However, in 2015, the district of Nordre Aker became the first district in Oslo to initiate an age-friendly program. Sagene and Frogner will also act as partners of this pilot program, which will last until 2017, when successful experiences are intended to be scaled up to the whole city (Ditt aldersvennlige Oslo - Oslo kommunes medvirkningskonferanse - 7 mars 2016, 2016). Given the interest these districts have shown for their older residents, it might be useful to use them as case studies.
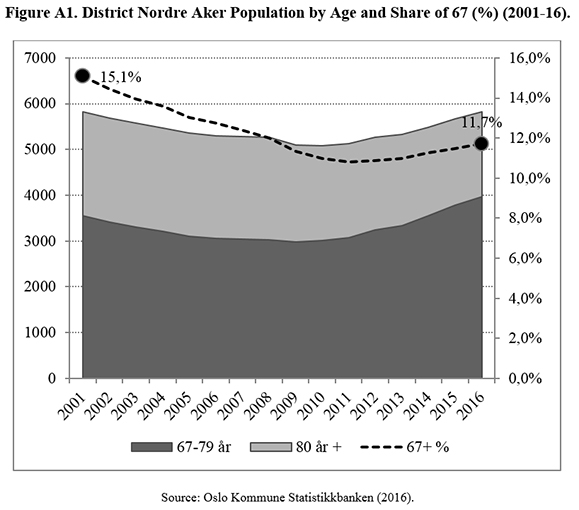
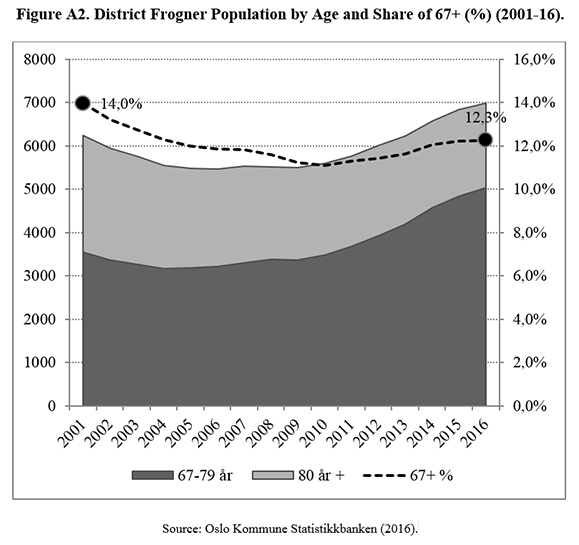
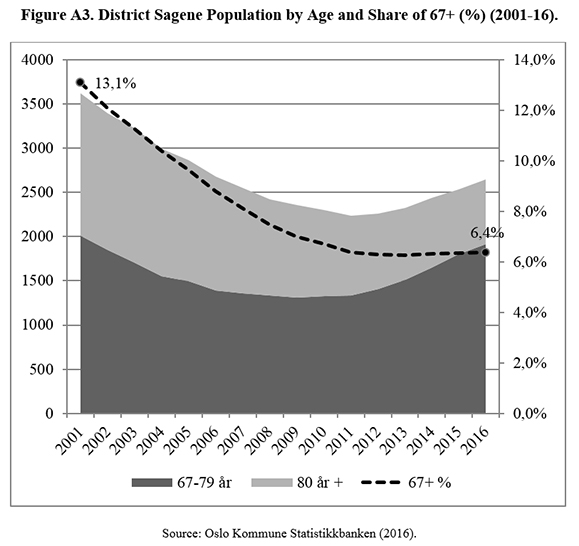
This section will focus on the three above-mentioned districts. Figure A1 to Figure A3 of the appendix show the evolution of the number of older residents since 2011. Although there are variations in terms of scale and speed, the share of the older persons declined in all the three districts. Nordre Aker and Frogner had a relatively stable population of residents aged 67 or above. The oldest group, aged 80 years or above, also remained relatively stable.
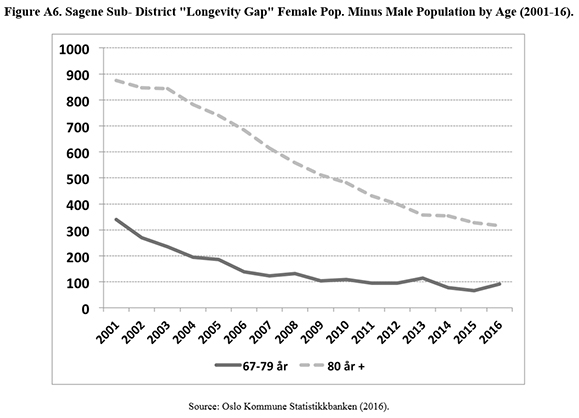
During the same period, Sagene had a more pronounced reduction of older persons. The share of residents aged 67 and above dropped from 13.1 to 6.4 per cent. The reduction of the oldest residents, with 80 or more years of age was the main contributor to this change. In other words, the main driver here was most likely the death or institutionalization of those persons.
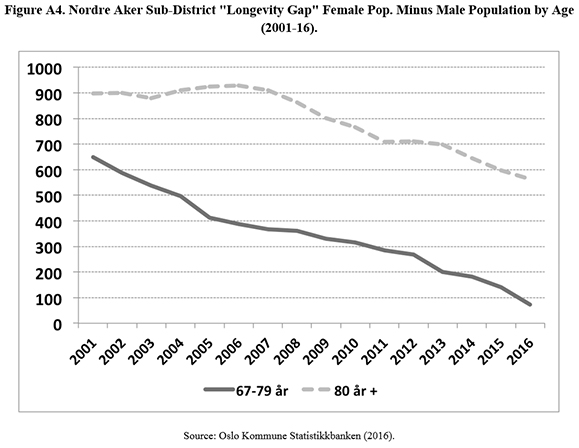
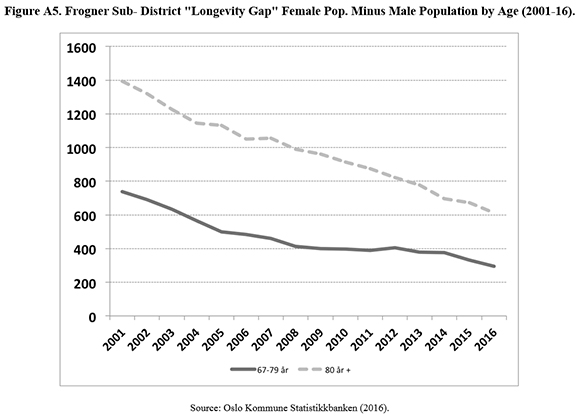
In Oslo women live longer than men, a pattern observed at the national level and in almost every single country in the world (Austad, 2006). The longevity gap and the consequent feminization of ageing is an important topic, which continues to be overlooked [19] . The final set of figures presented in this paper (Figure A4 to Figure A6 of the appendix), show not only the variety of ageing patterns within Oslo's districts, but also highlight the longevity gap.
While the older population remained relatively stable in Nordre Aker and Frogner, the longevity gap has consistently declined since 2001. In 2016, there were only 72 more women than men aged 67 to 79 years residing in Nordre Aker (in 2001, there were 649 more women than men living in this district). However, the gap between the number of women and men aged above 80 years, was more significant. In this age group, there were 563 more women than men (the difference amounted to 929 in 2006).
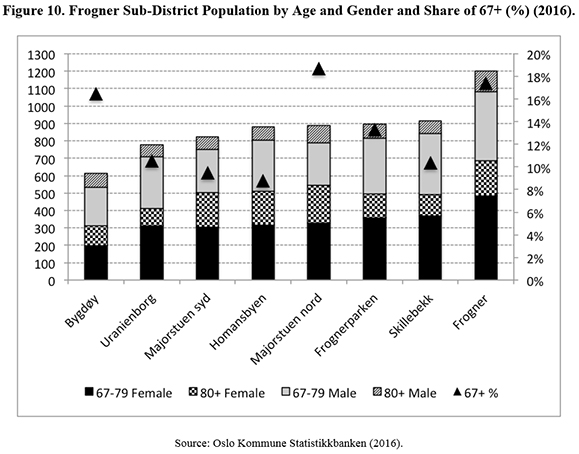
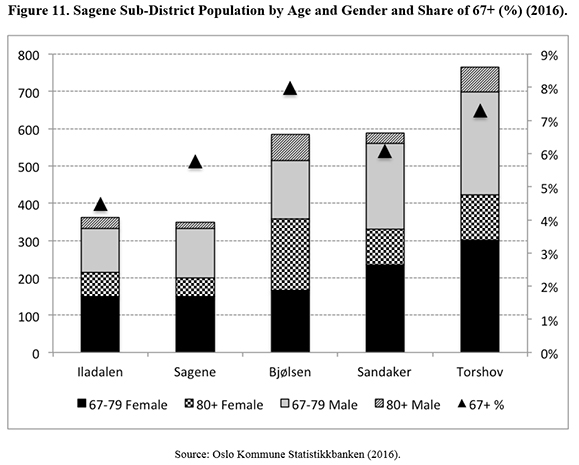
The closing of the longevity gap was even more pronounced in Frogner, with a reduction in both age groups. In 2001, the districts had 2 133 more women than men aged 67 or above. For the age group of 80 years and above, the figure was 1 394. The longevity gap decreased with more than 60 per cent, with a larger contribution from the 80 years or more parcel. A similar trend can be observed in Sagene. However, here it is more a result of the general decline of the older population than due to an increase of male longevity.
Although the historic data show a reduction of the feminization of ageing, the topic is still relevant. Not only because female residents in Oslo continue to live longer than men, but also because this phenomenon tends to become more pronounced as the population grow older.
Figure 9 to Figure 11 visualize the longevity gap within districts, and the variations in the proportion of older persons in relation to the total population living in the same sub-district. Sandaker and Sagene, sub-districts of Sagene, have the largest longevity gap for the group aged 80 years or above, with a ratio of nearly one man to four women. Both sub-districts combined have 15 731 residents, of which 147 women and 45 men aged 80 years or more.
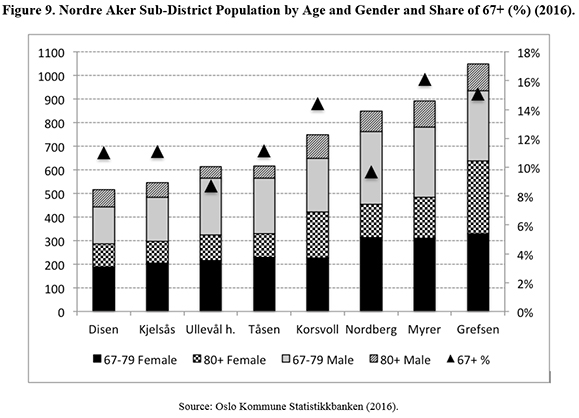
Once again, going further “closer” into the sub-district scale (Figure 9 to Figure 11) I found renewed support to the claim that ageing dynamics are played differently at different geographical scales.
6. Conclusions
I started by inquiring how can a critical approach to the demographics of ageing better contribute to city planning. On section three, I affirmed that although age is a critical element in the social organization, different perspectives can be adopted to define old age. I also argued how the critical approach not only acknowledges this fact but also actively highlights the importance of context and relationships to define age and old age.
Despite all the contributions brought by age-based research, gerontological knowledge is still characterized by an imbalance between the accumulation of data and the development of theory. As exposed by Baars et al (2006) and Birren (in Silverstein et al., 2008, p. 459), the study of ageing has often been driven by narrowly defined problem-based questions and with little attention to basic assumptions or larger theoretical issues. In short: “data-rich and theory poor” (Birren and Bengston, 1988).
One of the consequences of the inaccurate use of demographic information can be an apocalyptical-like approach. Under this kind of apocalyptical framework old age is frequently framed by a very narrow stereotype and simplistically portrayed as a problem to be solved.
More than simply shade light on a wrong common assumption – the elderly boom - the article argued that city planners and urbanists must pay a special attention when using demographic data to asses ageing. For this specific case I highlighted only four aspects of the complexity of demographic ageing: (i) the impact of different age cut-offs; (ii) the historical perspective; (iii) the striking disparities when observing different scales; and (iv) the differences in terms of sex. These aspects do not intend to exhaust the complexity of ageing. On the contrary, the aim is to highlight contradictions and alternatives.
I applied the critical demographic approach to the city of Oslo to answer and apparently simply but fundamental and recurrent question: “Is this city getting older?” The review of the available documentation confirmed the “gap”, demographers are aware of the factual information but don't see the topic as relevant enough to advance with further investigation. City planners blindly trust second-hand projections and constantly overlook data limitations. In this case, the most striking equivoque was ignorance about the historical data, and consequently the lost opportunity of learning from the historical experience so close in time.
After a long period of rejuvenation, Oslo's has just started to age again. However, all scenarios point to a share of older persons that is still lower than it was during the mid-1980s. The evidence presented for Oslo is important to challenge a misleading perception that in fact make sense in many municipalities in Norway. As the “population bomb” did not explode, the population “ageing bomb” might face the same destiny. Oslo did survive the “age-wave” that hit the city before. So far, there is little evidence to support the idea that Oslo will not be able to manage a similar increase in the share of older persons in the future. Moreover, the critical demographic approach demonstrated the need to take a disaggregated approach at different spatial levels.
Although Oslo's share of older persons is likely to remain significantly lower than the share observed in the past, the absolute number of older persons will increase. Within ten years, Oslo will have more than 81 000 citizens aged 65 or older for the first time. The speed of the growth of the oldest age group (85 or older) should also be a subject of further analysis. Projections show that the expected doubling of this cohort will happen soon and fast, reaching unprecedented levels.
Another striking characteristic of the current ageing process is the composition of the older persons group. The meaning of age and old-age have been through significant changes in terms of roles and expectation. The relatively recent gains in terms of longevity and the percentage of older persons as a share of the total population, coupled with the different life experiences of different generations, are sufficient reasons to doubt that today's older adults are exactly the same as the elderly of yesterday and will be the same as those of tomorrow. It is of uttermost importance that this insight is a part of the mental demographic map of city planners and decision makers.
Even in the face of a probable reduction of the longevity gap between older men and women, gender remains one of the key aspects to better understand ageing. However, in Oslo, a recent phenomenon that must be urgently addressed by both researchers and policymakers, is the diversity of the backgrounds of the city's future older residents. The current situation of nursing homes, with a relatively homogeneous public (older persons born in Norway from Scandinavian parents) is already changing. According to the most recent projections, the share of older persons living in Norway with an immigrant background will jump from the current 4 per cent of all those who are 70 years or older to almost 27 per cent in 2060 (Tønnessen et al., 2016, p. 10). This brings new challenges and needs.
The examples of the three districts analyzed in this article, point out new possibilities to better address the residents' needs. With such rich information available, policy planners have ample opportunities to create new solutions and arrangements for the provision of public services. The article presented one possible critical approach to the demographics of ageing in Oslo. Other important aspects are still to be explored, as, for example, the impact of the demographic patterns and social policies on family relationships, as suggested by Dykstra and Hagestad (2016).
The fundamental relations of interdependence, in particular when it comes to caregiving, are frequently overlooked. Older persons, typically seen as recipients of care, are constantly denied the recognition for their work as care-givers. Oslo's future will also depend on how planners can also support the needs of caregivers.
Moving is not a simple decision. For some people it is not even an option. Multiple variables might affect this process, such as household size, affordability, job opportunities etc. Typically, location is a key variable in the real estate market. However, if public spaces are not adapted to all-ages, valuable locations might lose out in relation to more inclusive neighborhoods.
Traditionally attractive neighborhoods might prove to be unviable for the oldest and frailest residents, simply because most of the buildings in certain areas were built when elevators and other accessibility features were not taken into account. Another key factor might be the availability of specific services and the notion that the area is safe for all ages.
Norway's, and of course Oslo's, main challenge is to build a society that can seize all the opportunities opened by the fantastic achievement population ageing embodies. More than just to cope, the aim should be to build a good society for all. This implies the construction of an environment where people can flourish and contribute with their best during their entire lifetime. In this sense, the sooner we identify ageism as an unconstructive and unacceptable prejudice, the sooner we will be able to fully appreciate and respect all ages contribute. Engaged city planners equipped with a critical demographic knowledge and better-informed local politicians are fundamental to accomplish this.
REFERENCES
Aase, K.N., Tønnessen, M., Syse, A. (2014) The population projections. Documentation of the BEFINN and BEFREG models (Notater Documents No. 2014/25), Statistics Norway. [ Links ]
Andersen-Ranberg, K., Petersen, I., Robine, J.-M., Christensen, K. (2005), “Who Are the Oldest-Old?” in Börsch-Supan, A., A. Brugiavini, H. Jürges, J. Mackenbach, J. Siegrist and G. Weber (Eds.) Health, ageing and retirement in Europe – First results from the Survey of Health, Ageing and Retirement in Europe , Mannheim: Mannheim Research Institute for the Economics of Aging (MEA). [ Links ]
Andreassen, K.K., Dzamarija, M.T., Slaastad, T.I. (2013) Large diversity in little Norway - Immigrants and Norwegian-born to immigrant parents – population statistics (No. 5/2013), Samfunnsspeilet, SSB. [ Links ]
Austad, S.N. (2006) “Why women live longer than men: Sex differences in longevity”, Gend. Med. 3, 79-92. doi:10.1016/S1550-8579(06)80198-1.
Baars, J., Dannefer, D., Phillipson, C., Walker, A. (Eds.) (2006) Aging, Globalization, and Inequality: The New Critical Gerontology, Baywood Pub. [ Links ]
Binstock, R.H., George, L.K. (2011) Handbook of aging and the social sciences, 7th ed., Handbooks of aging. Elsevier/Academic Press, Amsterdam. [ Links ]
Birren, J.E., Bengston, V.L. (1988) Emergent theories of aging, Springer Pub. Co. [ Links ]
BLID (2009) Norway universally designed by 2025. [ Links ]
Brattbakk, I., Wessel, T. (2013) “Long-term Neighbourhood Effects on Education, Income and Employment among Adolescents in Oslo”, Urban Stud. 50, 391-406. doi:10.1177/0042098012448548.
Brunborg, H. (2007) Stor variasjon i andel eldre i kommunene [WWW Document]. ssb.no. available at http://www.ssb.no/befolkning/artikler-og-publikasjoner/stor-variasjon-i-andel-eldre-i-kommunene(accessed 5.3.17). [ Links ]
Camarano, A. (2004) Os Novos Idosos Brasileiros: Muito Além dos 60? IPEA, Rio de Janeiro. [ Links ]
Cole, T.R., Ray, R.E., Kastenbaum, R. (Eds.) (2010) A guide to humanistic studies in aging: what does it mean to grow old? Johns Hopkins University Press, Baltimore, Md. [ Links ]
Connelly, M. (2009) Fatal Misconception, Harvard University Press, Cambridge, Mass. [ Links ]
Coole, D. (2012) Is there a population problem and if there is, can we talk about it?, available at https://sydney.edu.au/arts/government_international_relations/downloads/documents/colloquium/Prof_Coole_Assimilated_EP_v2_Sydney_talk.pdf. [ Links ]
Davidson, P.M., DiGiacomo, M., McGrath, S.J. (2011) “The Feminization of Aging: How Will This Impact on Health Outcomes and Services?” Health Care Women Int. 32, pp.1031-1045. doi:10.1080/07399332.2011.610539. [ Links ]
Ditt aldersvennlige Oslo - Oslo kommunes medvirkningskonferanse - 7 mars 2016 (2016) Oslo En Aldersvennlig By. Byra°dsavdeling for eldre, helse og sosiale tjenester. [ Links ]
Dykstra, P.A., Hagestad, G.O. (2016) “How demographic patterns and social policies shape interdependence among lives in the family realm” Popul. Horiz. 0. doi:10.1515/pophzn-2016-0004. [ Links ]
Ehrlich, P.R. (1995) The Population Bomb, Reprint edition. ed. Buccaneer Books, Cutchogue, N.Y.
Ellingsæter, A.L., Pedersen, E. (2015) “Institutional Trust: Family Policy and Fertility in Norway”, Soc. Polit. Int. Stud. Gend. State Soc. jxv003. doi:10.1093/sp/jxv003. [ Links ]
Folbre, N., Shaw, L.B., Stark, A. (2006) Warm hands in cold age: gender and aging, Routledge. [ Links ]
Folbre, N., Shaw, L.B., Stark, A. (2005) “Introduction: Gender and Aging”, Fem. Econ. 11, 3-5. doi:10.1080/13545700500115803. [ Links ]
Folbre, N., Shaw, L.B., Stark, A. (2004) A special issue on gender and aging, Routledge. [ Links ]
Hagen, K. are P., Djuve, A.B., Vogt, P. (1995) Oslo, den delte byen? FAFO. [ Links ]
Halvorsen, B., Halvorsen, T., Holmøy, E., Hægeland, T., Johannessen, R., Telle, K. (2015) Økonomisk utsyn over året 2014 (No. 1/2015). SSB. [ Links ]
Hartmann, B. (1995) Reproductive Rights and Wrongs: The Global Politics of Population Control , South End Press. [ Links ]
Infeld, D.L. (2002) Disciplinary Approaches to Aging: Sociology of aging, Taylor & Francis. [ Links ]
Jan, B., Joseph, D., Amanda, G., Chris, P. (2014) Ageing, meaning and social structure: Connecting critical and humanistic gerontology , Policy Press. [ Links ]
Katz, S. (1996) Disciplining old age: the formation of gerontological knowledge, Knowledge, disciplinarity and beyond , University Press of Virginia, Charlottesville. [ Links ]
Komp, K., Johansson, S. (2015) Population ageing from a lifecourse perspective. Critical and international approaches , The Policy Press, Bristol. [ Links ]
Kriznik, H.M. ([1970-], 2015) Den delte byen, Forl. manifest, Oslo. [ Links ]
Ljunggren, J., Andersen, P.L. (2014) “Vertical and Horizontal Segregation: Spatial Class Divisions in Oslo, 1970–2003”, Int. J. Urban Reg. Res. n/a–n/a. doi:10.1111/1468-2427.12167. [ Links ]
Malthus, T.R. (1798) An Essay on the Principle of Population or a View of Its Past and Present Effects on Human Happiness, an Inquiry into Our Prospects Respecting the Future Removal or Mitigation of the Evils which it Occasions by Rev. TR Malthus. The Project Gutenberg EBook. [ Links ]
Marin, B., Zaidi, M.A. (2007) Mainstreaming Ageing: Indicators to Monitor Sustainable Policies, Ashgate Publishing, Ltd. [ Links ]
Miksa, B. (2016) Rethinking Retirement Ratios [WWW Document]. Proj. Synd. Available at https://www.project-syndicate.org/commentary/rethinking-retirement-ratios-by-brigitte-miksa-2016-05(accessed 6.7.16). [ Links ]
Nagarajan, R., Teixeira, A.A., Silva, S. (2016) “The impact of an ageing population on economic growth: an exploratory review of the main mechanisms”, Análise Soc. 1, 4-35. [ Links ]
Neugarten, B.L. (1974) “Age Groups in American Society and the Rise of the Young-Old”, Ann. Am. Acad. Pol. Soc. Sci. 415, 187-198. doi:10.1177/000271627441500114. [ Links ]
OECD (2015) Ageing in Cities, Organisation for Economic Co-operation and Development, Paris. [ Links ]
Oslo | Age-Friendly World, n.d. [ Links ]
Østby, L., Henriksen, K. (2013) Immigrants – what we know and don't know: Immigrants and their children – and our knowledge of them (No. 5/2013), Samfunnsspeilet. SSB. [ Links ]
Ringard, Å., Sagan, A., Saunes, I.S., Lindahl, A.K. (2013) Norway: Health system review. Health Systems in Transition. [ Links ]
Robertson, A. (1997) Beyond Apocalyptic Demography: Towards a Moral Economy of Interdependence , Cambridge University Press. [ Links ]
Robertson, P.T. (2012) The Malthusian Moment: Global Population Growth and the Birth of American Environmentalism , Rutgers University Press, New Brunswick. [ Links ]
Sanderson, W., Scherbov, S. (2008) “Rethinking age and aging”, The Population Bulletin, Population Reference Bureau. [ Links ]
Sanderson, W.C., Scherbov, S. (2010) “Remeasuring Aging” Science 329, 1287-1288. doi:10.1126/science.1193647 [ Links ]
Sanderson, W.C., Scherbov, S., others (2007) “A new perspective on population aging”, Demogr. Res. 16, 27-58. [ Links ]
Sara, A., Kate, D., Jay, G. (2003) Gender and Ageing: Changing Roles and Relationships: Changing Roles and Relationships , McGraw-Hill Education (UK).
Saraceno, C. (2008) Families, Ageing and Social Policy: Intergenerational Solidarity in European Welfare States , Edward Elgar Publishing. [ Links ]
Schmitt, R.C. (1952) “Demography and City Planning”, Soc. Forces 30, 300-304. doi:10.2307/2571595. [ Links ]
Silverstein, M., Bengtson, V.L., Putney, N., Gans, D. (2008) Handbook of Theories of Aging, Second Edition. Springer Publishing Company. [ Links ]
Spedale, S., Coupland, C., Tempest, S. (2014) “Gendered Ageism and Organizational Routines at Work: The Case of Day-Parting in Television Broadcasting”, Organ. Stud. 35, 1585-1604. doi:10.1177/0170840614550733. [ Links ]
Spijker, J., MacInnes, J. (2013) “Population ageing: the timebomb that isn't?”, BMJ 347, f6598–f6598. doi:10.1136/bmj.f6598. [ Links ]
Suzman, R.M., Willis, D.P., Manton, K.G. (1995) The Oldest Old, Oxford University Press. [ Links ]
Tønnessen, M. (2014) More children, but fewer per woman (No. 5/2013), Samfunnsspeilet. SSB. [ Links ]
Tønnessen, M., Leknes, S., Syse, A. (2016) Befolkningsframskrivinger 2016-2100: Hovedresultater (No. 3/2016), Økonomiske analyser. Statistics Norway. [ Links ]
United Nations (2015) World Population Prospects, the 2015 Revision [WWW Document]. U. N. Dep. Econ. Soc. Aff. Popul. Div. Available at http://esa.un.org/unpd/wpp/. [ Links ]
United Nations (2017) The Sustainable Development Goals Report 2017. [ Links ]
United Nations (2011) Current Status of the Social Situation, Well-Being, Participation in Development and Rights of Older Persons Worldwide. [ Links ]
United Nations (2008) Guide to the National Implementation of the Madrid International Plan of Action on Ageing. [ Links ] United Nations.
United Nations (2007) World Economic and Social Survey 2007: Development in an Ageing World - 60th Anniversary Edition, 1948-2007, 60th ed. [ Links ] United Nations.
United Nations (2005) Living Arrangements of Older Persons Around the World. (Population Studies). United Nations Publications. [ Links ]
United Nations (2002a) World population ageing, 1950-2050. United Nations, New York. [ Links ]
United Nations (2002b) Report of the Second World Assembly on Ageing: Madrid, 8-12 April 2002. United Nations Publications. [ Links ]
United Nations (1995) The economic, social and cultural rights of older persons. [ Links ]
Walker, A. (2014) The new science of ageing, New dynamics of ageing, Policy Press, Bristol. [ Links ]
Walsh, K., Carney, G.M., Leime, A.N. (2015) Ageing Through Austerity: Critical Perspectives from Ireland, Policy Press. [ Links ]
Wessel, T. (2000) “Social Polarisation and Socioeconomic Segregation in a Welfare State: The Case of Oslo”, Urban Stud. 37, 1947-1967. doi:10.1080/713707228 [ Links ]
World Health Organization (2007) Global Age-Friendly Cities: A Guide. [ Links ]
Received: 25-05-2017; Accepted: 08-09-2017.
The author would like to acknowledge the valuable contributions of Rune Halvorsen, Viggo Nordvik, Astri Syse, António Francisco, Ellen Aabø and Ley Muller. The responsibility for any errors in the resulting work remains my own.
Notas
[2] http://ssb.no.
[3] Statistics Norway produces population projections using the BEFINN and BEFREG models. In the first one population is projected by age and sex at the national level up to and including the year 2100. Immigrants from three country groups of origin, Norwegian-born children with immigrant parents and the remaining general population are projected as separate groups. As the cohort component method requires updated figures for the population and assumptions about the future development of fertility, life expectancy, immigration and internal migration, I used the medium alternative. For detailed information with regards the projection models please refer to Aase et al (2014).
[4] http://statistikkbanken.oslo.kommune.no/
[5] The balancing equation in demography is described as: Pt = P{t-k} + B{t-k,t} – D {t-k,t} + NM{t-k,t}', where Pt is the population size at time t, P{t-k} is the population size at time {t-k}, B{t-k,t} is the number of births in the population between t-k and t, D {t-k,t} is the number of deaths in the population between t-k and t, and NM{t-k,t} is the net migration into the population between t-k and t.
[6] For a detailed recollection of the historical debate, see for example Robertson, P. T. (2012).
[7] There are contested perspectives with regards to the hegemonic demographical discourse. Another commonly referred issue is declining fertility levels. Diana Coole (2012) offers a reflection about why concerns about population growth and over-population have virtually disappeared from the political agenda of developed countries since the mid-1970s.
[8] From a sociological perspective, several authors already attempted to defuse the “bombastic” perspective pointing out: (a) the problematic assumptions used on the dominant actuarial forecast, (b) the ideological interest behind such perspectives and; (c) the myths created around old age like the unfunded link between population ageing healthcare costs increase (Baker and Weisbrot, 2001; Blackburn, 2003; Mullan and Furedi, 2000).
[9] Oslo municipality Public Journal 2014/2884-1 WHO Global Network of Age-friendly Cities and Communities (GNAFCC) http://byr-journal.cloudapp.net/Journal/SearchRelated?caseYear=2014&sequenceNumber=2884.
[10] Independent, Active and Safe Older Residents in Oslo (adopted by the city council in 2014).
[11] In Norwegian = Bydel.
[12] In Norwegian = Delbydel.
[13] http://ssb.no.
[14] http://statistikkbanken.oslo.kommune.no/.
[15] There are at least two other indicators that deal with similar concepts; (a) The parent support ratio; calculated as the number of persons 85 years old and over per one hundred persons aged 50 to 64 years. (b) The potential support ratio; the number of persons aged 15 to 64 per every person aged 65 or older. (See for example: United Nations, 2002a).
[16] The Age-Index might also refer to recent attempts to quantify quality of life and wellbeing of older persons, for example the Global AgeWatch Index developed by HelpAge International.
[17] More about Oslo division, see for example Hagen et al., 1995; Ljunggren and Andersen, 2014; Wessel, 2000.
[18] The Oslo kommune statistics department also presents data for citizens without a registered address. In 2015 that group amounted to 3594 individuals, 131 of them aged 67 years and above.
[19] Nonetheless, many scholars have already addressed this issue (Folbre et al., 2006, 2005, 2004; Sara et al., 2003; Spedale et al., 2014).
Appendix