


 Inglês (pdf)
 Artigo em XML
 Referências do artigo
 Enviar este artigo por email
 Citado por SciELO
  Similares em
SciELO
Similares em
SciELO 
 Permalink
Introduction
The accelerated urbanization of cities demands a great deal of business interactions, resulting from the increased production of goods and services that causes disruption in roadway and communication systems. With this, urban centres have been organizing a new concept of city, called Smart Cities, which basically are organized communities that feature high communication technology and conscious investments in sustainability, providing dynamic and safe environments (Lazaroiu and Roscia, 2012), and that improve citizens’ quality of life (Marsal-Llacuna et al., 2015).
To minimize the arising problems from this growing urbanization, it is necessary for the governments an innovative management development. The concept of municipal management needs to evolve from administrative to an innovative community-based management (Bennett et al., 2017).
Smart cities can be seen as a promise for urban sustainability. On the other side, technological aspects cannot always meet urban challenges concerning the three pillars of sustainability, namely social, environmental and economic (Yigitcanlar, 2018). Consequently, the way cities are managed evolves over time, with investments on physical, social and technological infrastructure in order to develop the economy, with social coherence, thus improving the efficiency of municipal administration (Hollands, 2008).
Urban planning represents a complex system that involves a high capacity to design, plan and thus be able to choose the best strategies from the vision of smart city planners and decision-makers from a social, economic, energy and environmental perspective (Mattoni, Nardecchia & Bisegna, 2019).Smart cities are said to be more creative because the emergence of smart ideas for solving everyday problems that develop knowledge and innovation in most sectors, also fostering scientific research, culture and economy (Piekas et al., 2018).
In the Smart Cities concept it is important to recognize why cities are considered key elements for the future. Numerous interpretations suggest that it contains the term “smart” because the intelligence is perceived only when the system can adapt itself to the users’ needs.
In urban planning, the term “smart city” is often treated as an ideological dimension where “smarter” implies on strategic directions (Albino, Berardi & Dangelico, 2015; de Carvalho et al., 2021). Among the dimensions of a smart city, the Organic Integration of various systems such as transportation, energy, education, health, buildings, physical infrastructure, food, water and public safety is emphasized. The Smart Cities conception is linked to the need for metropolitan blueprints that center on promoting an orderly occupation, sustainability, and contributing to smart and creative problems answers. The 17 Sustainable Development Goals (SDGs) establish aspirations to promote sustainable development worldwide. The 11th objective bournes on making cities inclusive, safe, elastic, and sustainable, and the most recent Smart Cities conception is grounded on this specific SDG (ONU, 2015; Klopp and Petretta, 2017; Huovila et al., 2019; Rozhenkova et al., 2019). So, well-succeeded innovations demand specific requirements as research, development and knowledge (Soares et al, 2020).
These systems are classified according to Lombardi et al, (2012) into: smart economy, smart mobility, smart environment, smart people, smart life and smart governance. Thus, to assess the level at which smart cities are positioned, these systems and their classification need to be considered. To analyse these systems, the indicators that assess services and quality of life are important tools.
For the integration of these systems the standard ISO 37120:2014, called "Indicators for city services and quality of life", was created to help city managers to measure the municipal performance on services, quality of life over time, simplifying city learning from each other; enabling comparisons of performance on a broad scale and sharing best practices. This international standard was developed using the framework proposed by the Global City Indicators Facility (WWCD, 2017; Bhada et al., 2009), and determines a set of indicators to guide the evaluation of cities' services performance and people's quality of life. It contains the definitions and methodologies for the indicators presented in a holistic view and integrated to the purpose sustainable city development.
The ISO contains over 100 standardized indicators divided in general and support ones. The creation of them aims to support decision-making. The standard also sets benchmarks for international government service delivery goals. As guideline, it proposes cities information sharing to consolidate a sustainable planning system. On the other hand, information to compose these indicators is not always standardized, which makes it difficult to perform any kind of evaluation. A possible solution to this context would be to use data normalization or standardization methods in conjunction with multi-criteria analysis in order to sort cities and detect progress levels in relation to the Smart City concepts.
In the literature, there are important studies involving the evaluation of smart cities. This theme suggests a multi-criteria analysis, which may have compensatory or non-compensatory characteristics.
In this sense, Lombardi et al. (2012) developed a model that involves clusters, i.e., categorization of cities according to their size. The evaluation consisted of the dimensions (criteria): Intelligent Governance (related to participation); Intelligent Human Capital (related to people); Intelligent Environment (Resource related); Intelligent Life (related to quality of life); and Intelligent Economy (related competitiveness), relevant for the structuring and future application of multi-criteria methods that allow the evaluation of smart cities.
Many of these assessments consider a large number of alternatives and criteria. Also, the alternatives (cities) are commonly compared at the same level, disregarding their size, number of inhabitants, available resources, etc. Also, when considering several alternatives and criteria, compensation may occur among the criteria, and a larger alternative (city) with larger infrastructure, number of inhabitants, not necessarily developed as a smart city, may be considered “better” in relation to the others.
Therefore, when performing these evaluations, it is first necessary to define the objective and how the results will be evaluated, and whether the alternatives need to be previously categorized, or when the criteria allow ranking without prior categorization. It is also important to evaluate the proposed objective and identify whether the assessment may be compensatory or not. This helps determining a method for each application. The problem globally requires an analysis phase considering the preference structures advocated in the theories of multi-criteria analysis. There are several multi-criteria methods that could be used (Moura et al, 2020), but each specific problem will require a different way of assessment and the method that best fits the context.
The importance of ranking cities is in assessing the development potential of a city, being possible to know particularities and define specific strategies for each of these entities that have different levels of growth and technological advancement. Thus, as Silva (2017) cites, it is important that each city establish its own urban development project aimed at people, and that managers make decisions based on the reality of each location.
Decision-making methods in this context enables communication between decision-makers in cities, especially citizen involvement. The Multi-Criteria Decision Analysis (MCDA) approach is characterized as a set of methods and analyses aimed at clarifying a problem, where options are evaluated by multiple and conflicting criteria. (Aragão et al., 2020; Vincke, 1992).
Multi-criteria decision making is a multi-step process consisting of a set of methods for structuring and formalizing decision-making processes. MCDA can be considered efficient approach at all decision-making levels and at all stages of smart city projects. (Hoang et al., 2019).
From this context, this study aims to propose a methodology for evaluating Smart Cities using the multi-criteria approach, because its methods are indicated for solving complex problems which contain conflicting situations. Decision analyses is a support for the dialogue among decision-making agents, enabling the manipulation of uncertainties with subjectivity and provides each potential solution. (Gomes et al, 2002).
Thus, the most in-depth study on urban planning is indispensable for connecting efficiency, quality of life and environment. This paper is justified by presenting the criteria and sub-criteria, as well as the necessary indicators to measure smart city initiatives. An application of the methodology was performed to measure the performance of 10 cities in south Brazil.
Smart Cities: concepts
Since the 21st century, an increasing number of smart city projects have emerged using a variety of methods, dimensions and typologies to address management policy issues to improve and adapt to the cities of the future. Diversification in the conceptualization of a smart city has generated academic studies, central and local institutions involved in smart projects (Nam and Pardo, 2014).
The definitions of Smart Cities and the environmental, social and economic pillars that make up sustainable development use a term in Information and Communication Technologies (ICT) as a resource to improve the quality of life of its inhabitants (Weiss et al., 2013). ICTs present fundamental characteristics with transformational, disruptive and synergistic impacts on urban systems (Bibri, 2018).
Recent interest in smart cities can be attributed to concern for sustainability and the emergence of new technologies such as mobile devices, semantic web, cloud computing and Internet of Things (IoT), promoting real-world user interfaces (Bifulco et al., 2015). The ICTs are strongly involved in city governance, where they are used as resources to improve quality of life, achieve and develop and create a more open and innovative urban context through multi-stakeholder participation (Bifulco et al., 2015). Table 1 shows the main definitions of smart cities:
Table 1 Definitions of Smart Cities
| Authors | Definitions |
|---|---|
| Giffinger et al. (2007) | A Smart City acts prospectively on the economy, on people, on governance, on mobility, on the environment and on life, is based on the intelligent combination of self-determined, independent and conscious citizen duplication and activities. |
| Komninos (2011) | Smart Cities are territories with a great capacity for learning and innovation, built by the creativity of its population, knowledge creation institutions and digital communication and knowledge management infrastructures. |
| Barrionuevo et al. (2012) | Being a smart city means using all available technology and resources intelligently and in a coordinated way to develop integrated, viable and sustainable urban centres. |
| Giovannella et al (2013) | Smart City is an efficient, innovative and proactive attitude, founded on the clever combination of talents and practices of self-reliant, autonomous and responsible citizens. |
| Zanella, Bui & Castellani (2014) | The goal of a smart city is to make better use of public resources by enhancing the quality of services delivered to citizens while reducing the operational costs of public administration. |
| Capdevila & Zarlenga (2015) | The concept of smart city advocates that a city is smart when corroborating the inventiveness and creativity of its citizens. |
| Van Zoonen (2016) | In a city where technology infrastructures monitor mobility, air and water quality, energy use, visitor movement and good neighbourhood feelings. |
| Pereira et al. (2017) | The term Smart City encompasses an efficient, technologically advanced, sustainable and socially inclusive city. |
| Chong et al. (2018) | Smart city is an integration of technology-mediated infrastructure and services, social learning to strengthen human infrastructure, and governance for institutional improvement and citizen engagement. |
| Gascó-Hernandez (2018) | Smart City is a broad term for how information and communication technology can help improve the efficiency of a city's operations as well as the quality of life of its citizens, while promoting the local economy. |
| Zhu, Li & Feng (2019) | The smart city was originally designated because it knows how to deal with various urban problems due to its sudden urbanization, such as power shortages, congestion and pollution. |
Source: Authors (2022).
The components of a smart city according to Nam and Pardo (2014) can be classified into three groups: human, institutional and technological factors. Being the technological factors composed by the physical infrastructures, intelligent technologies, and digital channels. Institutional factors are politics, government management and regulations; and the human factors are social capital and human infrastructure.
Thus, it is remarkable that researchers demonstrate similar concerns regarding the efficiency of the governance of smart cities around the world, making it clear the need to build references that guide actions focused on the effectiveness of these structures. The highlights in these approaches to the definitions by the authors cited are natural resources, technology, and people, however, the common term among all definitions is the use of ICT as a resource to improve the quality of life of its citizens.
The development of concepts included many aspects of urban development from citizen, government, mobility, and sustainability. That way, the city performance in each of these areas can be evaluated as a strong or weak point of its competitiveness among different urban regions, with the attracting businesses experience, know-how citizens, which contribute to the scenario of a city. The results in Table 1 provide an insight into the relationships between the levels of smart performance city and contribute to the model applied in this work.
Methodology
Information collection was carried out by researching the main indicators on cities and the elaboration of a questionnaire containing the criteria and sub-criteria according to the concepts presented in the introduction chapter. The application was performed considering 10 cities in south Brazil. The decision-maker should take careful attention on how judgments are made and justified, suggesting the use of decision models to support multi-criteria decision-making (MCDM) (Aragão et al., 2020; Aragão et al., 2021; Moura et al. 2020; Mello et al., 2022, Zola et al., 2020).
The questionnaire was designed to measure the level of importance of each criteria and sub-criteria divided in nine sections with 15 pairwise evaluations for the criteria and 32 pairwise evaluations for the sub-criteria. The questionnaire was answered by five researchers working on different smart city initiatives in Brazil, being a Master in Public Policy and Development; a Entrepreneur and Creator of the Business Internationalization Forum; a Publicist and Master in Communication; a Consultant and speaker on Smart cities and women's participation in technology and a PhD in Production Engineering and researcher in the smart city area. It is important to highlight that in the analysis of the criteria it is crucial to have real decision-makers and that the group of evaluators should have two or more participants (Pomerol & Barba-Romero, 2012).
In order to measure the importance of criteria and sub-criteria, the AHP multi-criteria method was used (Shimizu, 2006), which is a compensatory method that supports decisions involving multiple criteria. Through the AHP, it was possible to attribute the relevance of the criteria and sub-criteria according to the context and for the ranking of the alternatives (10 cities). However, two of the AHP method's merits consist that, within certain limits, the method can detect and handle the inconsistency of human decision-makers (Saaty & Vargas, 1984, Saaty, 1987, Harker & Vargas, 1987), and the method accepts a hierarchy of criteria, unlike some methods which require global comparisons of the alternatives (Vargas, 1990).
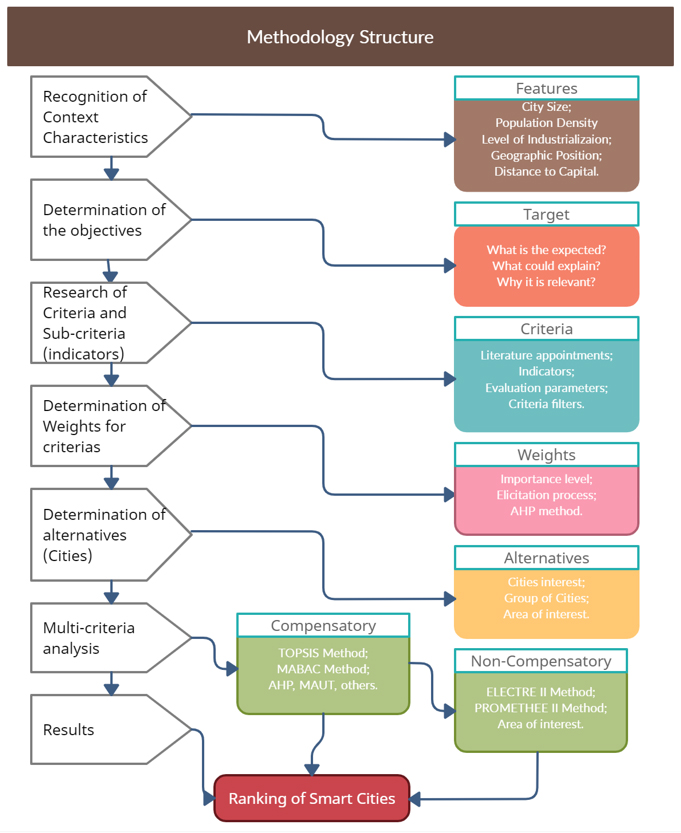
The MABAC (Multi-Attributive Border Approximation Area Comparison) method was used because the problem has a compensatory and comparative character, seeking maximum performances and refutes the minimum ones. The items developed in the proposed MCDA methodology are presented in Figure 1.
To define the criteria (Smart Economy, Smart Citizen, Smart Government, Smart Mobility, Smart Environment and Smart Life), the European Smart Cities 4.0 (2015) model was used. From the criteria established by the European model related to the themes of the indicators of the ISO 37120: 2017 and thus can be adapted to these sub-criteria that represent the reality of the cities analysed. The summary of the criteria considered is presented in Table 2.
Table 2 List of ISO 37120:2014 Criteria and Themes
| DIMENSIONS | CRITERIA | SUB-CRITERIA |
|---|---|---|
| Smart Economy | Economy | Entrepreneurship Productivity Innovative Spirit Labour market |
| Smart Citizen | Education Participation in Public Life | Qualification Level Participation in Public Life Diversity |
| Smart Government | Public and Social Services | Social Public Services Government Transparency |
| Governance | ||
| Smart Mobility | Innovation | Sustainability, Innovation and Safety in Transportation ICT Infrastructure Availability Accessibility |
| Smart Environment | Environment Water and Energy | Environmental Protection Attractiveness of Natural Conditions Natural Resource Management |
| Smart Life | Health Public security Housing Quality People | Health conditions Public security Housing Quality Social cohesion Cultural Facilities Tourist Attractions |
Source: Adapted from ABNT NBR ISO 37120: 2014.
The Intelligent Economy dimension encompasses productivity, entrepreneurship, innovation and the labour market. The Intelligent Citizen dimension is related to the level of qualification offered to the citizen and the quality of this qualification, as well as citizen participation in the public life of municipalities. The Intelligent Government dimension is linked to the efficiency of the public services provided, along with transparency channels of the municipality's actions. The Intelligent Mobility dimension relates to the theme of mobility innovation, which can be measured by innovative transport initiatives, transport safety, the use of clean vehicle options and by the level of access of the population to the internet. The Intelligent Environment dimension relates to themes of environment water and energy, in order to promote environmental protection, and sustainable management of natural resources. The Intelligent Life dimension encompasses the management of health, public safety, housing conditions and the quality of life of citizens.
To establish the alternatives evaluated in the application of this methodology, we used the ten cities in southern Brazil. From the definition of these alternatives, the evaluation process was the individual survey of the indicators against the criteria and sub-criteria. This method also considered all the individual and opinions of each decision-maker in the calculations and obtaining the criteria weights.
To assess the difference in conditions between the cities evaluated, 40 indicators were defined. The standard ABNT NBR ISO 37120:2017 “Sustainable development in communities - indicators for urban service and quality of life” was used. Table 3 shows the indicators used and the source of information for each indicator.
Table 3 Indicators (sub-criteria)
| INDICATORS | FORMULATION | (Measure unit) | SOURCE |
|---|---|---|---|
| GDP per capita | (Gross Domestic Product)/(Total population) | ($) monetary value | IBGE (2010) |
| Companies per 100 thousand inhabitants | (Number of Companies )/(Population⁄100,000) | Number | IBGE (2010); Couto (2018) |
| GDP per active worker | (Gross Domestic Product)/(Active Workers) | ($) monetary value | IBGE (2010); Silva (2017) |
| Municipal Expenditure per capita on Science and Technology | (Science and Technology Expenses)/(Total population) | ($) monetary value | IPARDES (2016); IBGE (2010); Silva (2017) |
| Unemployment rate | DATASUS | Index | DATASUS; Couto (2018) |
| Enrolled Percentage of School Age Population | Parana Institute of Development Economic and Social | (%) | IPARDES (2016); Couto (2018 |
| People with complete higher education per 100 thousand inhabitants | (Number of People with Higher Education)/(Population⁄100,000) | Number | IBGE (2010); Couto (2018) |
| Number of Higher Education Institutions | Parana Institute of Development Economic and Social | Number | IPARDES (2016) |
| Voter Percentage | Regional Electoral Court | (%) | TRE (2016); Silva (2017) |
| Percentage of Women Councillors | (Number of Women Elected)/(Number of vacancies in Municipal Council) * 100 | (%) | TRE (2016); Silva (2017) |
| Municipal Expenditure on Urbanism per capita | (Urbanism Expenses)/(Total population) | ($) monetary value | IPARDES (2016); |
| Percentage of Children Enrolled in Day Care | (Number of Children Enrolled)/(Number of Nursery Spaces)* 100 | (%) | IBGE (2010); Silva (2017) |
| Government Transparency Scale | Federal Comptroller General | Score | CGU |
| Firjan Municipal Development Index | FIRJAN | Index | FIRJAN |
| Miles of Bike Path per 100 thousand Inhabitants | ((Miles of Bike Path)/(Population)/100,000 | Miles | Town hall |
| Cars per capita | Number of car 𝑇𝑜𝑡𝑎𝑙 𝑃𝑜𝑝𝑢𝑙𝑎𝑡𝑖𝑜𝑛Number | IBGE (2010); DATASUS | |
| Transport Deaths per 100 thousand Inhabitants | ((Total Transport Deaths)/Population)/100,000 | Number | IBGE (2010); DATASUS; Couto (2018) |
| Computers per households | (Number of Homes with Computers)/(TotalNumber of Households) | Number | IPARDES (2016); Silva (2017) |
| Internet Computers per households | (Number of households with internet access)/(Total Number of Households) | Number | IPARDES (2016); Silva (2017) |
| Public Transport per 100 thousand Inhabitants | ((Number users)/Population)/100,000 | Number | IPARDES (2016); Silva (2017) |
| Household Waste Collection Percentage | (Number of people with waste collection)/(Total Population) * 100 | (%) | IBGE (2010); DATASUS |
| Recycled Materials Recovery Percentage | (Total Recycled Waste (ton))/(Total Waste Produced (ton)) * 100 | (%) | IBGE (2010); DATASUS |
| Drinking Water Population | (Number of People with Drinking Water)/(Total Population) * 100 | (%) | Sustainable Cities Program; Couto (2018) |
| Percentage of Sewage Treatment per capita | (Number of People with Sewage Treatment)/(Total Population) * 100 | (%) | DATASUS; Couto (2018) |
| Water consumption per capita (litres/day) | (Total water consumption (l/day))/(Total Population) | litres/inhab./day | IBGE (2010); DATASUS; Silva (2017) |
| Water Loss Percentage | (Vol. Water Provided - Vol. Used)/(Total Vol. Distributed Water) * 100 | (%) | IBGE (2010); DATASUS; Couto (2018) |
| Residential Electric Energy Use per capita (kWh/year) | kWh/inhab./year | IPARDES (2016); Couto (2018) | |
| Electricity Supply Regularity | (People with Regular Electricity)/(Total Population) *100 | (%) | IPARDES (2016); IBGE (2010); Couto (2018) |
| Annual Average Solar Energy | (⅀Monthly Average Solar Incidence)/12 | Average | Atlas Solar do Paraná; Silva (2017) |
| Average Life Expectancy at Birth | Parana Institute of Development Economic and Social | Average | IPARDES (2016); Silva (2017) |
| Hospital Beds per 100 thousand Inhabitants | ((Total hospital beds)/Population)/100,000 | Number | IPARDES (2016) |
| Infant Mortality Index | Parana Institute of Development Economic and Social | Index | IPARDES (2016); IBGE (2010); Couto (2018) |
| Municipal Expenditure on Public Security per capita | (Municipal Expenses with Public Safety)/(Total Population) | ($) monetary value | IPARDES (2016); Urban Systems (2018) |
| Number of homicides per 100 thousand inhabitants | ((Number of Homicides)/Population)/100,000 | Number | IBGE (2010); DATASUS |
| Percentage of Population Living in Subnormal Agglomerates | (Number of Subnormal Clusters)/(População Total) * 100 | (%) | IBGE (2010); Couto (2018) |
| Demographic density | Institute of Geography and Statistics | Index | IBGE (2010); Silva (2017) |
| Poverty rate | (Number of People Living in Poverty)/(Total Population) * 100 | Index | MPPR; Silva (2017) |
| Cultural Facilities | Parana Institute of Development Economic and Social | Number | IPARDES (2016); Silva (2017) |
| Number of Tourism Agencies | Parana Institute of Development Economic and Social | Number | IPARDES (2016) |
| Number of Tour Guides | Parana Institute of Development Economic and Social | Number | IPARDES (2016) |
Source: Authors (2022).
The Population Census (2010) was adopted as source of data for the cities, as well as the database of municipalities, municipal reports (IPARDES), Regional Electoral Court, DATASUS, Atlas of Violence, among others. In case of information existing only in different dates of the reference year, the composition of the indicators was based on the closest year to 2010. The weights for criteria and sub-criteria make possible to express the degree of importance of each pre-established criterion. To define the criteria and sub-criteria weights, a questionnaire with an importance scale of 1 to 5 was used, as shown in Table 4.
Table 4 Rating Scale
| Score | Importance Level | Description |
|---|---|---|
| 1/5 | Extreme Less-Importance | The first criterion is Extremely less important than the second criterion |
| 1/4 | Strong Less-Importance | The first criterion is Strongly less important than the second criterion |
| 1/3 | Medium Less-Importance | The first criterion is Medially less important than the second criterion |
| 1/2 | Small Less-Importance | The first criterion is a little bit less important than the second criterion |
| 1 | Same Importance | The two criteria have the same level of importance |
| 2 | Small Importance | The first criterion is a little bit more important than the second criterion |
| 3 | Medium Importance | The first criterion is Medially more important than the second criterion |
| 4 | Strong Importance | The first criterion is Strongly more important than the second criterion |
| 5 | Extreme Importance | The first criterion is Extremely more important than the second criterion |
Source: Authors (2022).
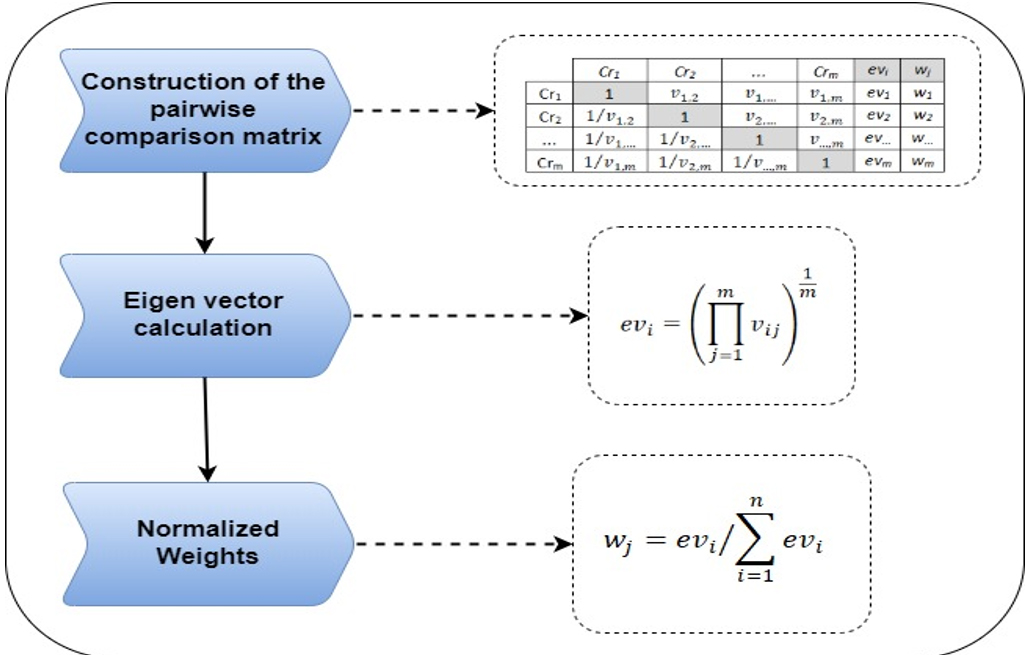
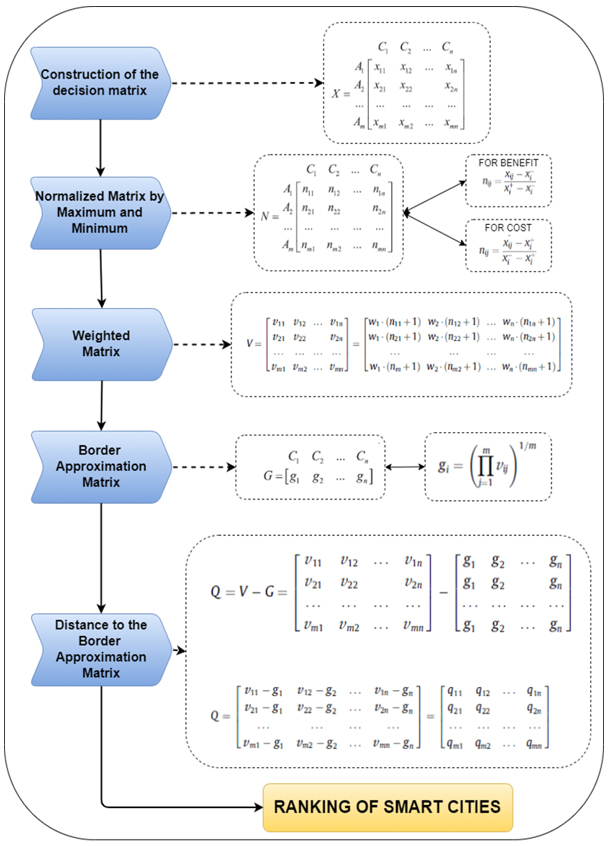
From the questionnaire answers, the AHP method was applied. Figure 2 demonstrates the steps of the AHP method. This method was applied based on the collected data, organized in spreadsheets. After determining the weights for each criterion, the next step was to rank the alternatives, meeting the necessary conditions of the context studied in the application, through the MABAC method, as shown in Figure 3.
The MABAC method is a compensatory multi-criteria method that considerers in the normalization process the distance of borders for ideal and anti-ideal values for criteria. To construct the MABAC decision matrix, cities were considered as alternatives, represented by variable m and the criteria were parameters n.
The alternatives are demonstrated in the form A_i=(x_i1,x_i2,…,x_in ) where, x_ij is the value of indicators i according to the criteria j (I = 1,2,…,m; j = 1,2,…,N) thus the following matrix was obtained, as illustrated:
The decision matrix was implemented, and then the MABAC method steps were applied as shown in Figure 3, obtaining the smart cities ranking.
Finally, a sensitivity analysis was performed, which aims to verify the robustness of the results found and to verify the effects of the criteria weights and the stability of the alternatives in the ranking, i.e., according to Store & Kangas (2001) the Sensitivity analysis allows an evaluation of the influence of different criteria and weights on the distribution pattern.
For this purpose, each criterion was analysed considering a liner variation in the weights, where the weight of the most relevant sub-criterion within each criterion was changed in an increment of 10%, the weights of the other sub-criteria were recalculated by the proportion of the weights. Weights were reinserted in the MABAC method to obtain new rankings, as shown in Figure 3.
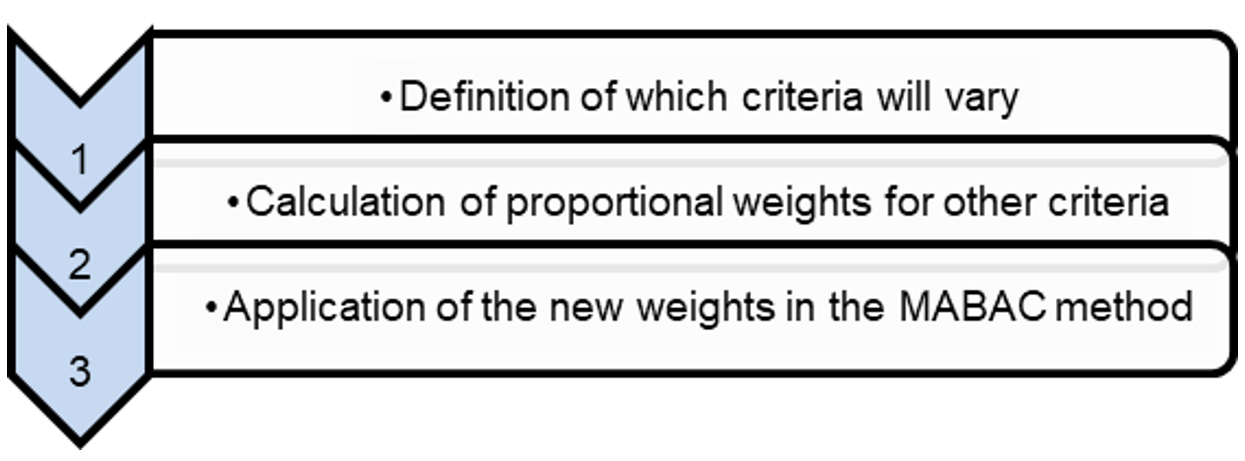
For a better understanding the steps performed are described below. Step 1: In this step the criterion ( 𝐶 𝑛 ) is defined and will vary in its weight, i.e., receive new values ( W 𝒏𝜶 ). Step 2: In this step, the proportional weights ( 𝑾 𝒏𝜷 ) for the other criteria are calculated except for criterion n chosen, through the equation (1):
For a better understanding the steps performed are described below. Step 1: In this step the criterion ( 𝑪 𝒏 ) is defined and will vary in its weight, i.e., receive new values ( 𝑾 𝒏𝜶 ). Step 2: In this step, the proportional weights ( 𝑾 𝒏𝜷 ) for the other criteria are calculated except for criterion n chosen, through the equation (1):
𝑊 𝑛𝛽 = 1− 𝑊 𝑛𝛼 ∗( 𝛽 (1− 𝑊 𝑛 ) (1)
Where 𝑾 𝒏 is the initial weight of criterion n and 𝑾 𝜷 is the calculated weight for the chosen criterion. Step 3: In this step the new weights were applied in the MABAC method giving rise to new rankings.
Application of the methodology
From the questionnaire, it was possible to obtain the average decision matrix for the criteria, thus the determination of the weights, and the main vector for the criteria from the normalized by the geometric mean of the answers. After defining the weights of each sub-criterion by the AHP method, it was necessary to normalize them for the application of the MABAC method, as shown in Table 5 below:
Table 5 Weight normalization - AHP method
| Criteria | Sub-criteria | Weights | Normalized Weights | Weights global criteria |
|---|---|---|---|---|
| Smart Economy | Entrepreneurship | 23.72% | 3.95% | |
| Productivity | 25.32% | 4.22% | ||
| Innovative Spirit | 27.80% | 4.63% | 16.67% | |
| Labour market | 23.16% | 3.86% | ||
| Smart Citizen | Qualification Level | 32.97% | 5.50% | |
| Participation in Public Life | 39.50% | 6.58% | 16,67% | |
| Diversity | 27.53% | 4.59% | ||
| Smart Government | Social Public Services | 42.02% | 7.00% | 16.67% |
| Government Transparency | 57.98% | 9.66% | ||
| Smart Mobility | Sustainability, Innovation and Safety in Transportation | 39.44% | 6.57% | |
| ICT Infrastructure Availability | 26.07% | 4.35% | 16.67% | |
| Accessibility | 34.49% | 5.75% | ||
| Smart Environment | Environmental Protection | 27.62% | 4.60% | |
| Natural Resource Management | 34.02% | 5.67% | ||
| Attractiveness of Natural Conditions | 38.36% | 6.39% | 16.66% | |
| Smart Life | Social cohesion | 22.99% | 3.83% | |
| Public security | 14.52% | 2.42% | ||
| Cultural Facilities | 14.91% | 2.49% | ||
| Tourist Attractions | 17.06% | 2.85% | 16.66% | |
| Health conditions | 15.57% | 2.60% | ||
| Housing Quality | 14.95% | 2.49% | ||
| SUM | 100% | |||
Source: Authors (2022).
For the determination of the initial matrix, Table 6, the normalization by the maximum and minimum function was performed, where the higher value of the criterion is preferable for the indicators classified as benefit and the lowest value for the indicators classified as cost. Each indicator normalized by the maximum and minimum function was multiplied by the weight of its respective sub-criterion thus obtaining the weighted matrix. The determination of the boundary approximation area matrix was calculated by means of the geometric mean. Thus, the initial matrix was determined and the normalization by the maximum and minimum function was performed, where the highest criterion value is preferable for the indicators classified as benefit and the lowest value for the indicators classified as cost.
From the determination of the initial matrix, the normalization by the maximum and minimum function was performed, where the highest criterion value is preferable for the indicators classified as benefit and the lowest value for the indicators classified as cost. Normalization by the maximum and minimum function allowed the identification of the preferable value for each sub-criterion according to the classification. Each indicator normalized by the maximum and minimum function was multiplied by the weight of its respective sub-criterion thus obtaining the weighted matrix. The determination of the boundary approach area matrix was calculated using the geometric mean, where the selection of the indicator value is made from the offered alternatives. To determine the matrix (Q), Tables 6 and 7, we calculated the distance from the value of each alternative to the value of the boundary approximation area of each indicator.
Table 6 Matrix to the MABAC method application (1/2)
| DIMENSIONS | Economy | Citizen | Government | Mobility | |||||||||||||||||||
| Norm-Weights | 3.95 % | 4.22 % | 4.63 % | 3.86 % | 5.50 % | 6.58 % | 4.59 % | 7.00 % | 9.66 % | 6.57 % | 4.35 % | 5.75 % | |||||||||||
| CRITERIA | Entrepreneurship | Productivity | Innovative Spirit | Labour market | Qualification Level | Participation in Public Life | Diversity | Public and Social Services | Government Transparency | Sustainability, Innovation and Safety in Transportation | ICT Infrastructure Availability | Accessibility | |||||||||||
| DESCRIPTION | Gross Domestic Product per capita | Companies per 100 thousand inhabitants | Gross Domestic Product per active worker | Municipal Expenditure on Science and Technology per Capita | Unemployment Rate Percentage | Number of Higher Education Institutions (HEI) | People with complete higher education per 100 thousand inhabitants | Percentage of school age population enrolled | Voter turnout in last elections | Percentage of women councillors | Municipal expenditure on urban planning per capita ($) | Rate of children enrolled in kindergartens (%) | Government Transparency Scale | FIRJAN Municipal Development Index | Miles of cycle paths per 100 thousand inhabitants | Cars per capita | Transport Deaths per 100 thousand inhabitants | Computers by home | Computers with Internet Access by Home | Public Transport per 100 thousand inhabitants | |||
| COST (C) or BENEFIT (B) | B | B | B | B | C | B | B | B | B | B | B | B | B | B | B | C | C | B | B | B | |||
| City-1 | 47.83 | 5957.71 | 83.37 | 0.00 | 4.60 | 59 | 17532.82 | 89.02 | 79.88 | 21.05 | 654.88 | 28.75 | 10.00 | 0.8514 | 11.87 | 1.33 | 17.31 | 0.68 | 0.59 | 338.87 | |||
| City-2 | 45.15 | 7071.43 | 86.43 | 0.47 | 4.33 | 12 | 13729.13 | 90.57 | 80.39 | 0.00 | 230.36 | 30.59 | 9.09 | 0.8646 | 10.08 | 1.36 | 28.52 | 0.65 | 0.55 | 248.18 | |||
| City-3 | 52.28 | 3684.38 | 187.69 | 0.00 | 7.05 | 10 | 8247.66 | 84.67 | 91.01 | 20.00 | 128.14 | 12.48 | 4.02 | 0.7899 | 0.98 | 1.81 | 28.46 | 0.50 | 0.42 | 457.81 | |||
| City-4 | 36.45 | 5341.62 | 89.69 | 0.49 | 4.96 | 11 | 12737.28 | 89.50 | 85.47 | 5.26 | 195.83 | 16.05 | 7.22 | 0.8483 | 7.50 | 1.57 | 30.52 | 0.58 | 0.50 | 368.64 | |||
| City-5 | 37.68 | 5280.77 | 92.50 | 5.18 | 4.68 | 9 | 9938.81 | 90.55 | 89.54 | 0.00 | 189.18 | 15.91 | 8.19 | 0.8442 | 0.00 | 1.62 | 38.34 | 0.53 | 0.42 | 357.69 | |||
| City-6 | 31.35 | 5016.83 | 90.52 | 0.00 | 5.62 | 3 | 9135.64 | 88.08 | 76.80 | 10.00 | 323.81 | 26.40 | 7.21 | 0.8124 | 2.97 | 1.58 | 61.10 | 0.48 | 0.39 | 262.38 | |||
| City-7 | 45.35 | 5277.31 | 98.08 | 0.00 | 4.40 | 3 | 9113.45 | 88.41 | 90.37 | 21.05 | 239.60 | 25.80 | 9.30 | 0.8786 | 38.11 | 1.57 | 1.00 | 0.50 | 0.04 | 205.04 | |||
| City-8 | 76.24 | 3838.64 | 197.30 | 0.00 | 4.54 | 2 | 6569.70 | 86.35 | 90.45 | 14.29 | 56.94 | 17.35 | 0.00 | 0.8074 | 36.36 | 1.78 | 18.07 | 0.52 | 0.39 | 329.92 | |||
| City-9 | 46.04 | 5963.89 | 104.67 | 27.08 | 3.01 | 3 | 10820.83 | 90.27 | 82.53 | 9.09 | 253.25 | 38.06 | 9.58 | 0.8737 | 4.03 | 1.60 | 47.91 | 0.58 | 0.47 | 475.00 | |||
| City-10 | 35.98 | 5717.72 | 95.03 | 2.20 | 3.22 | 3 | 8049.37 | 88.67 | 83.35 | 23.08 | 276.52 | 20.97 | 7.22 | 0.8486 | 4.05 | 1.71 | 48.56 | 0.47 | 0.36 | 310.13 | |||
Source: Authors (2022).
Table 7 Matrix to the MABAC method application (Continuation - 2/2)
| DIMENSIONS | Environment | Life | |||||||||||||||||||
| Norm-Weights | 4.60 % | 5.67 % | 6.39 % | 3.83 % | 2.42 % | 2.49 % | 2.84 % | 2.60 % | 2.49 % | ||||||||||||
| CRITERIA | Environmental Protection | Natural Resource Management | Attractiveness of Natural Conditions | Health conditions | Public security | Quality of housing | Social cohesion | Cultural Facilities | Tourist Attraction | ||||||||||||
| DESCRIPTION | Household Waste Collection Service Coverage Rate (%) | Recovery rate of recycled materials in relation to total collected (%) | Percentage of population served by drinking water supply (%) | Percentage of population with access to sewage treatment (%) | Total water consumption per capita (l / day) | Water loss percentage (%) | Total household electrical energy use per capita (Kwh / year) | Percentage of city inhabitants with regular electricity supply | Annual Average Solar Irradiation (kwh) | Infant mortality rate | Average life expectancy | Number of hospital beds per 100 thousand inhabitants | Municipal expenditure on public security per capita ($) | Homicides per 100 thousand inhabitants | Percentage of population living in subnormal agglomerations (%) | Demographic density | Poverty rate | Number of Cultural Facilities in the cities | Number of Tourism Agencies | Number of Tour Guides | |
| COST (C) or BENEFIT (B) | B | B | B | B | C | C | C | B | B | C | B | B | B | C | C | C | C | B | B | B | |
| City-1 | 100.00 | 4.87 | 99.82 | 99.32 | 163.90 | 39.29 | 768.31 | 99.86 | 4.29 | 11.90 | 76.30 | 316.67 | 53.11 | 36.62 | 9.30 | 4027.04 | 8.6 | 22 | 565 | 350 | |
| City-2 | 98.20 | 1.52 | 99.22 | 99.27 | 165.00 | 22.53 | 848.84 | 97.09 | 4.72 | 11.10 | 76.10 | 409.52 | 33.09 | 22.29 | 0.00 | 733.14 | 17.66 | 7 | 89 | 97 | |
| City-3 | 100.00 | 14.20 | 99.19 | 99.25 | 160.60 | 37.01 | 956.97 | 98.93 | 4.62 | 10.80 | 76.46 | 155.86 | 3.61 | 47.06 | 2.50 | 414.58 | 20.4 | 3 | 168 | 905 | |
| City-4 | 97.40 | 5.72 | 98.96 | 99.38 | 175.50 | 35.79 | 780.74 | 98.56 | 4.67 | 11.70 | 75.19 | 380.08 | 33.76 | 21.21 | 0.00 | 306.52 | 25.81 | 17 | 110 | 53 | |
| City-5 | 100.00 | 3.42 | 98.20 | 98.64 | 130.90 | 35.06 | 691.40 | 97.69 | 4.49 | 11.70 | 75.74 | 360.14 | 5.37 | 36.65 | 0.00 | 136.23 | 28.3 | 4 | 36 | 4 | |
| City-6 | 92.83 | 1.57 | 98.96 | 99.24 | 150.60 | 21.56 | 796.93 | 99.80 | 4.43 | 12.50 | 75.16 | 678.22 | 55.12 | 12.83 | 0.28 | 81.67 | 15.12 | 5 | 7 | 0 | |
| City-7 | 95.89 | 1.91 | 99.22 | 99.61 | 131.00 | 26.52 | 701.99 | 99.60 | 4.58 | 12.10 | 76.30 | 269.75 | 38.50 | 18.68 | 0.00 | 99.68 | 14.26 | 3 | 12 | 3 | |
| City-8 | 100.00 | 1.91 | 98.85 | 90.60 | 141.00 | 40.25 | 628.50 | 97.84 | 2.94 | 10.60 | 76.53 | 75.00 | 52.99 | 41.00 | 0.00 | 279.16 | 23.12 | 3 | 20 | 14 | |
| City-9 | 95.17 | 4.63 | 95.04 | 99.34 | 141.40 | 14.35 | 830.41 | 98.93 | 4.50 | 11.80 | 75.72 | 391.67 | 3.26 | 7.77 | 0.00 | 134.25 | 14.63 | 2 | 9 | 0 | |
| City-10 | 100.00 | 12.99 | 97.89 | 98.78 | 131.20 | 10.67 | 748.79 | 95.15 | 4.53 | 11.70 | 75.65 | 365.82 | 0.00 | 27.24 | 0.00 | 107.39 | 19.4 | 2 | 7 | 0 | |
Source: Authors (2022).
Table 8 Distances by MABAC method (1/2)
| BORDER APPROXIMATION MATRIX Qij - MABAC | |||||||||||||||||||||
| CRITERIA | Entrepreneurship | Productivity | Innovative Spirit | Labour market | Qualification Level | Participation in Public Life | Diversity | Public and Social Services | Government Transparency | Sustainability, Innovation and Safety in Transportation | ICT Infrastructure Availability | Accessibility | |||||||||
| City-1 | 0.00 | 0.01 | -0.01 | 0.00 | 0.00 | 0.05 | 0.04 | 0.01 | -0.02 | 0.02 | 0.05 | 0.02 | 0.03 | 0.01 | 0.00 | 0.04 | 0.02 | 0.03 | 0.02 | 0.00 | |
| City-2 | 0.00 | 0.02 | -0.01 | 0.00 | 0.00 | 0.00 | 0.02 | 0.02 | -0.02 | -0.02 | 0.00 | 0.02 | 0.02 | 0.03 | 0.00 | 0.03 | 0.01 | 0.02 | 0.01 | -0.02 | |
| City-3 | 0.01 | -0.02 | 0.03 | 0.00 | -0.02 | 0.00 | -0.01 | -0.03 | 0.03 | 0.02 | -0.01 | -0.03 | -0.03 | -0.05 | -0.02 | -0.03 | 0.01 | -0.01 | 0.00 | 0.03 | |
| City-4 | -0.01 | 0.00 | -0.01 | 0.00 | 0.00 | 0.00 | 0.01 | 0.01 | 0.00 | -0.01 | -0.01 | -0.02 | 0.00 | 0.01 | 0.00 | 0.01 | 0.00 | 0.01 | 0.01 | 0.01 | |
| City-5 | -0.01 | 0.00 | -0.01 | 0.00 | 0.00 | 0.00 | 0.00 | 0.02 | 0.02 | -0.02 | -0.01 | -0.02 | 0.01 | 0.01 | -0.02 | 0.00 | -0.01 | 0.00 | 0.00 | 0.01 | |
| City-6 | -0.01 | 0.00 | -0.01 | 0.00 | -0.01 | -0.01 | -0.01 | 0.00 | -0.04 | 0.00 | 0.01 | 0.01 | 0.00 | -0.03 | -0.01 | 0.00 | -0.03 | -0.01 | 0.00 | -0.01 | |
| City-7 | 0.00 | 0.00 | 0.00 | 0.00 | 0.00 | -0.01 | -0.01 | 0.00 | 0.03 | 0.02 | 0.00 | 0.01 | 0.02 | 0.04 | 0.05 | 0.01 | 0.04 | -0.01 | -0.03 | -0.03 | |
| City-8 | 0.03 | -0.02 | 0.03 | 0.00 | 0.00 | -0.01 | -0.02 | -0.02 | 0.03 | 0.01 | -0.02 | -0.01 | -0.07 | -0.03 | 0.05 | -0.02 | 0.02 | 0.00 | 0.00 | 0.00 | |
| City-9 | 0.00 | 0.01 | 0.00 | 0.04 | 0.02 | -0.01 | 0.00 | 0.02 | -0.01 | 0.00 | 0.00 | 0.04 | 0.03 | 0.04 | -0.01 | 0.00 | -0.02 | 0.01 | 0.01 | 0.03 | |
| City-10 | -0.01 | 0.01 | 0.00 | 0.00 | 0.01 | -0.01 | -0.01 | 0.00 | 0.00 | 0.02 | 0.00 | 0.00 | 0.00 | 0.01 | -0.01 | -0.01 | -0.02 | -0.01 | 0.00 | 0.00 | |
Source: Authors (2020).
Table 9 Distances by MABAC method (continuation - 2/2)
| BORDER APPROXIMATION MATRIX Qij - MABAC | ||||||||||||||||||||||
| CRITERIA | Environmental Protection | Natural Resource Management | Attractiveness of Natural Conditions | Health conditions | Public security | Quality of housing | Social cohesion | Cultural Facilities | Tourist Attraction | SUM | Ranking | |||||||||||
| City-1 | 0.01 | 0.00 | 0.02 | 0.01 | -0.02 | -0.02 | -0.01 | 0.02 | 0.00 | -0.01 | 0.01 | 0.00 | 0.01 | -0.01 | -0.02 | -0.02 | 0.02 | 0.02 | 0.02 | 0.01 | 0.35 | 1 |
| City-2 | 0.00 | -0.01 | 0.01 | 0.01 | -0.02 | 0.01 | -0.03 | -0.01 | 0.01 | 0.01 | 0.01 | 0.01 | 0.00 | 0.00 | 0.00 | 0.00 | 0.00 | 0.00 | 0.00 | 0.00 | 0.16 | 4 |
| City-3 | 0.01 | 0.03 | 0.01 | 0.01 | -0.01 | -0.01 | -0.05 | 0.01 | 0.01 | 0.02 | 0.02 | -0.01 | -0.01 | -0.01 | 0.00 | 0.00 | 0.00 | 0.00 | 0.00 | 0.02 | -0.11 | 9 |
| City-4 | 0.00 | 0.00 | 0.01 | 0.01 | -0.03 | -0.01 | 0.00 | 0.00 | 0.01 | 0.00 | -0.02 | 0.00 | 0.00 | 0.00 | 0.00 | 0.00 | -0.01 | 0.01 | 0.00 | 0.00 | 0.01 | 6 |
| City-5 | 0.01 | 0.00 | 0.00 | 0.00 | 0.03 | -0.01 | 0.03 | -0.01 | 0.01 | 0.00 | 0.00 | 0.00 | -0.01 | -0.01 | 0.00 | 0.00 | -0.01 | 0.00 | 0.00 | 0.00 | 0.01 | 7 |
| City-6 | -0.03 | -0.01 | 0.01 | 0.01 | 0.00 | 0.02 | 0.00 | 0.02 | 0.00 | -0.02 | -0.02 | 0.02 | 0.01 | 0.01 | 0.00 | 0.00 | 0.01 | 0.00 | 0.00 | 0.00 | -0.14 | 10 |
| City-7 | -0.01 | -0.01 | 0.01 | 0.01 | 0.03 | 0.01 | 0.02 | 0.02 | 0.01 | -0.01 | 0.01 | 0.00 | 0.01 | 0.01 | 0.00 | 0.00 | 0.01 | 0.00 | 0.00 | 0.00 | 0.23 | 2 |
| City-8 | 0.01 | -0.01 | 0.01 | -0.05 | 0.01 | -0.02 | 0.04 | 0.00 | -0.05 | 0.02 | 0.02 | -0.02 | 0.01 | -0.01 | 0.00 | 0.00 | -0.01 | 0.00 | 0.00 | 0.00 | -0.11 | 8 |
| City-9 | -0.02 | 0.00 | -0.04 | 0.01 | 0.01 | 0.03 | -0.01 | 0.01 | 0.01 | 0.00 | 0.00 | 0.00 | -0.01 | 0.01 | 0.00 | 0.00 | 0.01 | -0.01 | 0.00 | 0.00 | 0.19 | 3 |
| City-10 | 0,01 | 0,03 | -0,01 | 0,00 | 0,03 | 0,04 | 0,05 | -0,04 | 0,01 | 0,00 | -0,01 | 0,00 | -0,01 | 0,00 | 0,00 | 0,00 | 0,00 | -0,01 | 0,00 | 0,00 | 0,07 | 5 |
Source: Authors (2022).
Results and analyses
The alternatives selected as the best set belong to the area located at the top of the border, i.e., the near-ideal alternative, while the alternatives located at the bottom of the border are close to the anti-ideal. By calculating the sum of the distances of each alternative, it was possible to identify in which area each alternative is located. By calculating the sum of the distances of each alternative, it is possible to identify in which area each alternative is located, as shown in Table 10.
Table 10 Summary of the Distances to the ideal areas
| Alternatives | Sum of distances to the ideal area |
| City-1 | 0,35 |
| City-2 | 0,16 |
| City-3 | -0,11 |
| City-4 | 0,01 |
| City-5 | 0,01 |
| City-6 | -0,14 |
| City-7 | 0,23 |
| City-8 | -0,11 |
| City-9 | 0,19 |
| City-10 | 0,07 |
Source: MABAC method application, (2019).
For a better visualization, was obtained from the summation values of the area distances of each alternative.
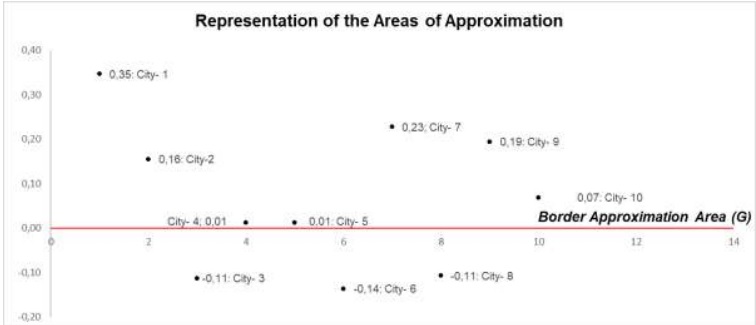
The cities that configure as ideal alternatives were: City-1, City-2, City-7, City-9 and City-10. The alternatives City-4 and City-5 were located near the border of the approach area; the alternatives City-3, City-6 and City-8 were configured as anti-ideal alternatives. The World Council on City Data (WCCD) and the Global Cities Registry created the first certification system based on ISO 37120 and these indicators help to identify how the city is and in which indicators it should improve to obtain certification. The ranking of the alternatives was determined by the order function in an increasing way and thus it was possible to identify the results of the proposed model, as can be seen in Table 11:
Table 11 Ranking of methodology proposed
| Smart Cities | Ranking Proposed Methodology |
| City-1 | 1 |
| City-7 | 2 |
| City-9 | 3 |
| City-2 | 4 |
| City-10 | 5 |
| City-4a | 6 |
| City-5 | 7 |
| City-8 | 8 |
| City-3 | 9 |
| City-6 | 10 |
Source: Authors (2022).
The proposed model initially used 40 indicators divided into 6 smart city global criteria, according to the European 4.0 model (these subdivided into 21 sub-criteria). The use of indicators helps cities to set goals and monitor their performance over time, and some of These indicators were standardized by ISO 37120:2018. A sensitivity analysis was performed, where the weights were varied for every global criterion with an increasing of 10% in each step, as presented in , using criterion 1 as an example. This procedure was performed for all criteria and analysed in a global way. The purpose was to recognize the position changing of each city, derivate from the weights redistribution. The graphics of the others global criteria were not shown, because they presented the same behaviour of the .
It was possible to conclude in this analysis that the changing of positions for all criteria has always been configured after a little increase in the weights. In this case (), the final positions of the ranking of the alternatives were configured after the first change of weights.
The sensitivity analysis follows to observe how the weights impact the final ranking in each criterion separately. Thus, in our analysis was possible to conclude that the global criteria (initially with equal weights) were aligned to the final ranking.
Important to highlight, the Decree No. 9,854/2019 instituted the National Plan for the Internet of Things and established the creation of thematic IoT chambers, which the Chamber of Cities 4.0 is part of. To this end, a national strategy for the development of smart and sustainable cities in Brazil was structured (Ministério De Desenvolvimento Regional, 2020). In 2020, the maturity level of cities was evaluated, considering planning, alignment, development, integration, and optimization indicators (MCTI, 2020). For cities that do not have such indicators, there is a view of the need to build them and identify the maturity level of intelligence of cities, creating strategies to cities smart. This methodology meets this demand, assisting in the development and use of such indicators, allowing cities to self-assess.
Discussion of analysis
This study provided ranking results to 10 cities according to their smart performance. In addition, the comparison of classification according to the intelligent performance in relation to the classification of another ranking brought as main benefits the results of the research to the literature a new approach classification of the analyzed cities.
Thus, the results highlight the determination of competitive advantages of observed urban areas and the identification of problems for future development strategies. This type of research can be used to provide information on governance and models of success and local economic growth, explore environmental performance, and the role of citizens as an object to aim for a smarter city.
The analysis regarding the level of indicators of a smart economy which were evaluated by the sub-criteria of entrepreneurship, productivity, innovation, and labor market presents a relevant meaning for a smart city and deserves attention. That way, it is understandable from the point of view of citizens who appreciate urban life from the perspective of the lifestyle in context intelligent. And, the important aspects of urban quality are seen through the availability of employment, achievement of financial goals, and comfort in family life, which influence the proposed model.
According to the results concerning the determination of the importance of the dimensions evaluated as intelligent in the model, the most important group of criteria was the intelligent citizen. This result is closely linked to data on the most important topics in cities, showing the importance of people in building a city. In addition to intelligent government as the second criterion for the classification of a smart city, it shows that leaders who are responsible for decisions that contribute to the structural and dynamic development of the urban environment are characterized by greater transparency with the population.
In the sequence mobility, environment, economy, and intelligent life, in this order of importance criteria, indicate that the success of the urban development process is based on the solution of problems, transport problems, and economic development, while paying attention to the ecological and social characteristics of urban areas. Thus, the ranking results show the cities that present the greatest number of local development strategies and focus on fighting unemployment and economic empowerment of the population.
Conclusions
This paper presented the proposal of a multi-criteria method application model that allowed evaluating a smart city. In the presentation of this model, 40 indicators were used as reference, included in 6 criteria of (1) Smart Economy, (2) Smart Citizen, (3) Smart Government, (4) Smart Mobility, (5) Smart Environment and, (6) Smart Life, based on the standard ISO 37120: 2017 “Sustainable development in communities - indicators for urban services and quality of life. Through the model, it was possible to evaluate 10 cities of south of Brazil, which allows answering the initial question.
Different mathematical approaches were used in the study of this research in order to compare and classify cities from the analyzed indicators, which covered different parameters from public life, government transparency, environmental aspects, security and urban transport, natural attractiveness, innovative spirit and health in cities.
In the general context, it is concluded that a new classification of the smart cities ranking showed that for a smart economy it is important to focus on productivity, entrepreneurship, innovation, and the labor market. For the criterion of the intelligent citizen to have as a relation the level of qualification offered to the citizen and the quality of the same, like the participation of the citizen in the public life.
In the smart government criterion group, it is connected to the efficiency of public services provided, in addition to the existence of transparency channels with the population. The smart mobility criterion group relates to innovation, which can be measured from innovative transport initiatives, transport safety. The intelligent environment analyzes the sustainable management of natural resources. And, for intelligent life focus on the management of public health and safety to the lives of citizens.
From the methodological point of view, the contribution of the article can be seen in the formulation of a new classifying cities model, which respects the specificities and characteristics of urban development. Multi-criteria analysis and linear programming are relevant tools for evaluating the planning and development of urban and environmental strategies since the last century (Stanković, 2017) and the model developed in this article presents an innovative approach.
It is believed that the main advantage of the proposed model is the attribution of weights for each sub-criterion, as these represent the opinion of people linked to the subject area of study. Another advantage is the recognizing of each context to obtain a response in ranking of smart cities by assigning weights to sub-criteria and identification of the areas that need the most investment of resources for their development, making municipal management more efficient.
The main limitation of the study was in relation to the indicators, as there is difficulty in accessing data in the researched databases. Another limitation point for the application was the outdating of some data, since the last census conducted by IBGE (Brazil), the main database used, was conducted in 2010, which made it difficult to represent the current reality.
As a suggestion for future work, it is recommended that the questionnaire be applied to a larger sample of decision-makers, and that they are directly inserted in the construction of an intelligent city. Another suggestion is to apply the proposed model for the next more recent census, as the data will better reflect the reality of the results.

