


Serviços Personalizados
Journal
Artigo
 Inglês (pdf)
 Artigo em XML
 Referências do artigo
 Enviar este artigo por email
Indicadores
-
 Citado por SciELO
 -
 Acessos
Links relacionados
-
 Similares em
SciELO
Similares em
SciELO
Compartilhar

 Permalink
Tourism & Management Studies
versão impressa ISSN 2182-8458
TMStudies no.7 Faro dez. 2011
Determining Factors of a Citys Tourism Attractiveness
Determinação dos Fatores de Atratividade Turística de uma Cidade
Arturo Calvo-Mora1; Juan Manuel Berbel-Pineda2; Rafael Periáñez3 and Eva María Suárez4
1Department of Business Administration and Marketing, University of Seville, Spain schmidt@us.es
2Department of Business Administration, University Pablo de Olavide, Seville, Spain jmberpin@upo.es
3Department of Business Administration and Marketing, University of Seville, Spain. rafacris@us.es
4The Andalusian Institute of Technology (IAT), Seville, Spain esuarez@iat.es
ABSTRACT
The primary aim of this work is to identify actions that can improve the tourist attractiveness of a city, specifically Seville, and secondly, to test the Concept Mapping methodology when it is applied to the conceptualization of complex constructs associated with tourism management. This methodology combines qualitative information provided by experts and quantitative information obtained from multivariate statistical techniques. The results of the work suggest, in addition to the validity and suitability of the methodology, that the attractiveness of a tourist destination could be improved by the implementation of a set of public-private plans linked to its tourism positioning, residents‟ awareness, the best use of the cultural and social wealth and the rich heritage, as well as the improvement of the infrastructure as well as the public and private management of tourism.
KEY WORDS: Tourist attractiveness, Tourist destination, Tourism management, Concept Mapping, Pattern Matching.
RESUMO
O primeiro objetivo deste trabalho é identificar ações que possam melhorar o atrativo turístico de uma cidade, ou mais concretamente da cidade de Sevilha, e em segundo lugar, avaliar a metodologia Concept Mapping quando se aplica na concetualizacão de construtos complexos como os associados à gestão turística. Esta metodologia combina informação qualitativa proporcionada por peritos e quantitativa obtida através de técnicas estatísticas multivariadas. Os resultados do trabalho sugerem, para além da validade e fiabilidade da metodologia, que o atrativo turístico de um destino pode ser melhorado através da implantação de um conjunto de planos de âmbito público e privado e que se encontram relacionados com o posicionamento turístico, a conciencialização dos residentes, o aproveitamento da riqueza cultural, patrimonial e social, assim como a melhoria tanto das infraestruturas como da gestão pública e privada do turismo.
PALAVRAS-CHAVE: Atrativo Turístico, Destino Turístico, Gestão Turística, Concept Mapping, Pattern Matching.
1. Introduction [i]
The efficient management of a tourist destination means a need, a challenge, and an opportunity for public and private bodies. Having an attractive tourist destination brings benefits for both residents (higher employment and better quality of life, for example) and visitors. As Tang & Rochananond (1990) point out, it is impossible to achieve this objective without a plan with a clear focus on improvement. The plans should include diverse actions that cover public infrastructure, tourist services, the breadth of choice, the use of natural and sociocultural resources, or the welcome and attention given to the tourist by the local residents (Tang & Rochananond, 1990; Beerli & Martín, 2004; Shoval & Raveh, 2004; Mazanec et al., 2007, Cracolici & Nijkamp, 2008; Berbel-Pineda & Ramirez-Hurtado, 2011 ). Faced with the reality of growing competition between cities, this work attempts to identify actions intended to improve the attractiveness of a tourist destination (ATD), and for the city of Seville in particular. In order to achieve this we use Concept Mapping (CM) methodology. This work can also be used as a tool for tourism agencies to improve their understanding of the economic and sociological elements which affect competition in the sector and, therefore, to optimize the plans that they could develop in order to achieve this. This work can also be used as the starting point for the conceptualization of the ATD construct and of its constituent elements. To fulfil these objectives, we first analyze the concept and the determinants of ATD, followed by a description of the CM methodology, and the principal results and conclusions reached in the study. In the final section, the work describes the process followed to test the validity of the conceptual model and the results arising from it.
2. Attractiveness of a tourist destination (ATD)
The ATD is intimately linked to the image it presents; it determines its competitive positioning and competitive factors (Enright & Newton, 2004; Mazanec et al., 2007; Berbel-Pineda & Ramirez-Hurtado, 2011), and at the same time, goes some way to explaining why a visitors chooses it (Baloglu & McClear, 1999). Moreover, as confirmed by Bigné et al. (2001), image and ATD affect the tourist‟s perception of quality and satisfaction as well as their willingness to return and to recommend the destination. The problem, however, lies in the difficulty in putting forward an adequate conceptualization of the ATD construct (Tang & Rochananond, 1990; Kim, 1998). Even the idea of "destination" is vague. It is commonly used to define administrative or geographical districts, or uniform blocks of facilities, resources and services that are available to the customer (Ritchie & Crouch, 2000). However, other elements are often overlooked which, whether they have a long reach (the taxation system, different levels of legislation, etc.), or a shorter reach (the characteristics of the "subdestinations" that comprise it, for example), have a significant effect. If we look at the whole ATD structure, many more elements come into play, which makes the conceptualization even more complicated. We must not forget that "attractiveness" as such is not an objective concept, but rather is the result of a somewhat generalized market attribution, which includes clear elements of subjectivity (Kim, 1998). But, furthermore, there are close connections with other constructs such as "image", "competitiveness" or "quality" (Cracolici & Nijkamp, 2008) and it is difficult to distinguish between them when they are applied to a specific tourist destination. When undertaking a detailed analysis of the components, the initial complexity increases even further. It must be remembered that many internal factors (tangible and intangible) are involved in the definition of ATD and that its final configuration is a combination of the actions of numerous public and private agencies, which are not always co-ordinated (Goeldner & Ritchie, 2008). Finally, it is common to overlook the effect that other neighbouring or easily accessible destinations might have on the definition of the ATD. If we accept the potential market has a specific volume, we might be faced with a competitive zero-sum game, since a visitor to one destination ceases to be a visitor to another. In some cases, however, accepting this game of winners and losers, it is true that some destinations exert a centrifugal or centripetal force over others, depending on the case. The investigators‟ awareness of these and other conceptual difficulties seems to have led to a general consensus among investigators that the problem needs to be approached from a systems perspective (Formica & Uysal, 2006). The configuration of the ATD at a given point in time is affected by the interacting elements of the offer, the demand, and the mechanisms –physical or otherwise– that connect them. Each of these three blocks contains elements that cannot be overlooked in the search for a reliable view of the construct. Therefore, with regard to the tourism offer, its composition and attractiveness must be considered in terms of visitor options (Kaur, 1981); demand must include factors such as the effect of the potential client‟s perceptions, changing market trends and tastes, the general socioeconomic situation and, of course, the potential visitor‟s budget, and resources could be segmented to increase their profitability (Dolnicar, 2004). This link between offer and demand (Pike, 2004) contains elements as disparate as promotional and marketing activities; the availability of information about the destination and ease of access to the destination itself; or the effect of other people‟s experiences, either by word of mouth or via modern information networks which are impossible to control. Perhaps this why the majority of studies into the ATD concept prefer to focus their investigations on measuring it through a model, abandoning altogether or only briefly touching on the correct conceptualization of the construct (Formica & Uysal, 2006). We have adopted this systemic vision for our work and avoided creating divisions between the components of the system, whilst accepting that whilst the configuration of certain elements can be changed by the actions of the agents, others are unchangeable (or "natural) and form a point of departure which sometimes leads to competitive advantage and at other times, to some restriction that must be taken into account. Taking the work by Cracolici & Nijkamp (2008) as our starting point, in this investigation we have looked at the ATD as a complex and mixed portfolio of the idiosyncratic elements of a particular area which, if suitably packaged, could offer the visitor a satisfactory experience that will fully meet their needs and expectations. We believe that the proposed definition links the three major approaches to the concept most commonly adopted in studies into the ATD for visitors (Lew, 1986): ideographical; organizational; and cognitive. From the first perspective, the ATD is analyzed on the basis of the area‟s specific characteristics, based on homogeneous groups of attributes which form this destination‟s tourism offer. From the organizational perspective, the analyses of the ATD describe the spatial and temporal relationships between the attraction‟s different elements and agencies. Finally, the cognitive approach views the question from the potential tourists‟ perceptions of the destination; an aspect that is linked to demand.
3. Concept mapping methodology: Procedure and principal results
A conceptual map is a type of structured conceptualization that can be used to develop a conceptual framework on which to base an evaluation and/or planning project for a particular situation and which involves the participation of a working group. The conceptualization is the articulation and objective representation of thoughts, ideas or opinions. This conceptualization is arrived at through the development of conceptual maps, a procedure that uses data and quantitative and qualitative information (Trochim & Linton, 1986; Trochim, 1989). Concept Mapping methodology can be used for problems other than planning and evaluation (Trochim, et al., 2003b; Anderson et al., 2006; Wu, 2006). Thus we find works that use this methodology for the development and validation of measurement scales (Scott & Lauren, 2007), for the development of surveys or measuring instruments (Jackson & Trochim, 2002), and even for the development of models and the construction of theories (Nabitz et al., 2001). Moreover, this methodology has been used successfully in many other spheres and fields of investigation, such as in educational improvement (Hughes & Hay, 2001; Weideman & Kritzinger, 2003), for analyzing the effectiveness of management training (McLinden & Trochim, 1998), improving communication processes (Witkin & Trochim, 1997), or evaluating technology transfer programmes (Shern et al, 1995). Its use is not unknown in the field of tourism; we could point to works such as those by Kim (1998) or Bigné et al. (2002). We have described below the process that should be followed for the development of a conceptual map (Trochim, 2000) and its application to the study of the ATD.
3.1. Planning and generation of ideas
This stage consists of two parts. In the first part, the investigators must decide who will participate in the process. Experience shows that a better conceptualization is achieved when a wide variety of relevant people or experts take part. In this case, the group that was chosen consisted of 14 experts from the following knowledge fields: catering, innovation and new technologies, public promotion of tourism at local and regional level, travel agencies, culture, high-end tourism, tourism marketing, communications, universities, security, leisure and free time, town planning and hotels. In the first working session the following activities were carried out:
- Explanation of the objectives and the methodology to be followed and the explanation of the main question. In this case the theme for the study was the ATD and, in particular, how it can be improved through specific courses of action in both the public and private spheres. The following question was asked: "What actions, of any type and from different fields and agents, do you consider would be feasible and desirable to put in place to contribute to the improvement of the tourist attractiveness of the city of Seville?
- Identification of questions or aspects related to the construct submitted to the study. The technique used for generating ideas was brainstorming (Osborn, 1948; Dunn, 1982).
- Open discussion of the points identified in order to clear up any doubts; discussion about the best wording for each element and the elimination of any duplications.
- Creation of a list of the items (122) which define the field of conceptualization.
3.2. Structuring the ideas
Once the set of ideas which describe the conceptual domain of the proposed theme has been established, it is necessary to provide information about how these are related to each other and to give a weighting to each one according to the proposed theme. Information is usually obtained about the correlations by using a card-grouping procedure (Rosenberg et al., 1975). When each expert has completed the grouping task, the results should be combined with those of the other participants. This is done in two phases: in the first, the results of each person‟s groupings are placed in a square matrix which contains the same number of rows and columns as items obtained from the brainstorming session. All of the values of the matrix are "0" or "1". "1" indicates that the items in this row and column were placed together by that person in one pile, while "0" indicates that they were not placed in the same pile. Theprincipal diagonal values will always be"1" to indicate that everyitem is always grouped with itself. The individual matrices are then combined to produce a similarity matrix for the group. However, here the value in the matrix for each pair of items indicates how many people placed them in the same pile, regardless of the importance that each person gives to their grouping. The principal diagonal values always add up to the number of people that carried out the grouping. This similarity matrix is seen as the relational structure for the conceptual domain as it provides the information on how the participants grouped the items. A high value in this matrix indicates that many participants placed this pair of items together, which implies that they are conceptually similar. On the other hand, a low value indicates that this pair of items was rarely placed together, which implies that they are conceptually different. The main advantage of this grouping procedure is that it is easily understood by the participants and does not take long. The second task in the structuring process is the weighting of each item on a previously defined scale. A Likert-type scale is normally used, with 1-7 points to indicate the importance, priority, effort or expectation of the result associated with each item. For each item the arithmetical mean is obtained.
3.3. Representation of the items, interpretation and use of conceptual maps
The information brought by the experts was processed using the guidelines for the Concept Mapping methodology by applying the Multidimensional Scaling (MDS) and Cluster Analysis (Trochim, 1989) techniques. The analyses were carried out using SPSS 15.0 software. Multidimensional Scaling is a technique that, using a similarity matrix, provides a graphical representation of the distances between the original items in the matrix. In the conceptual map this multidimensional scaling creates a map of points which represent the set of statements produced by the brainstorming session, based on the similarity matrix resulting from the classification task (Kruskal et al., 1978; Davison, 1983). Hierarchical Cluster Analysis (Anderberg, 1973; Everitt, 1980) is used to group the individual items on the map into clusters which presumably reflect similar concepts. Once the MDS and the cluster analysis have been carried out, two graphical representations have been obtained: a map of points and a cluster map. The first gives an analysis which places each item or idea as a separate point on a map. The items which are closest together on the map are those that were generally placed into one group by the experts, whilst the items that are furthest apart on the map are those that were rarely or least often placed in one group. The map of points resulting from the multidimensional scaling (MDS) is shown in the following figure.

Figure 1: Map of points produced by MDS
In the second graphical representation, the items on the map are grouped in clusters which represent the best order of the conceptual grouping of the original set of ideas. After carrying out different tests with regard to the number of clusters that the programme should produce and analysing the conceptual coherence of each of the solutions, ten groups were finally identified (Figure 2), with each one being assigned a label or meaning for the group. We can also see the importance of the cluster through the weightings of the actions for improvement which make up the group. These results are shown in Annex 1. In addition, once the cloud of points and the clusters has been analyzed, the information that these contain can be interpreted using two axes or dimensions. Given that the points on the map are placed on Cartesian axes which are, a priori, unspecified, a closer investigation is required of the two dimensional conceptual framework to provide an explanation of the positioning of points and clusters in the graph that results from the application of the MDS and Cluster Analysis techniques. (Figure 2) An exhaustive study of the information obtained led the investigators to propose the existence of two main axes. Firstly, the horizontal line could be used to show actions of a public nature, bearing in mind that actions with a clear political orientation would be placed at one extreme, and the more technical actions at the other end. The vertical plane shows the scenario for private actions, with obviously entrepreneurial or sectoral actions at one extreme, while at the other, those which are closest to civil actions, which be classed as individual, or those grouped together in associations or similar non-commercial bodies. Institutions that could be dubbed "pseudo-public" –since they do not belong in the strictly defined political field nor in the business or civil field– sit astride both axes, and they could be placed at their imaginary intersection or, in mathematical terms, at the origin coordinates of the imaginary map that helps to provide greater coherence to the placement of points and clusters. The cluster map, with its respective labels, provides the conceptual framework and the basic result of the process (Trochim et al., 2003a). It must not be forgotten that this final map is in reality a product of the opinions, grouping and weightings of the experts.
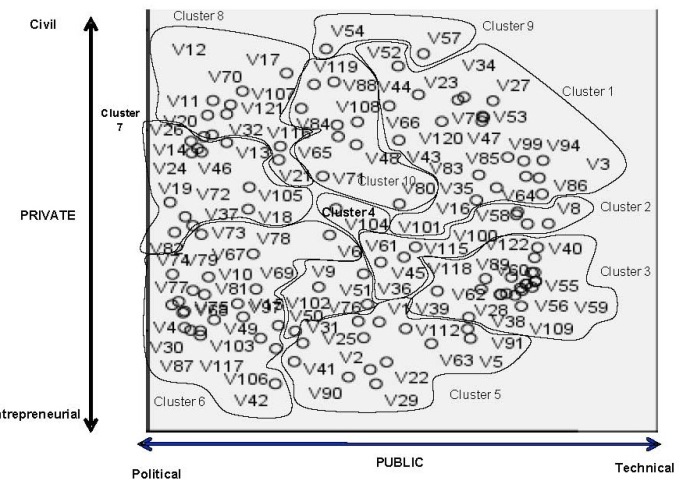
Figure 2: Cluster map and grouping by axes
4. Validation of the conceptual model
Following this first phase it was necessary to design a scientific strategy that would enable the validation of the results obtained to test whether this model could, in effect, provide a conceptual description of the phenomenon being studied and whether its structure would be accepted –in terms of external validity– by a different and broader group of experts than those involved in the development of the investigation. The validation strategy was formulated according to the central tenets of the proposals set out by Trochim (1985), which he called systematic "Pattern Matching" whilst, at the same time, partly applying the ideas proposed by Diamantopoulos & Winklhofer (2001) and Anderson & Gerbing (1991). To this end, the investigators devised a model questionnaire consisting of different sections: (1) General validation of the model; (2) Prioritization of lines of strategy; (3) Correlation between lines of strategy; (4) Validation of the groupings. The population that was sent the questionnaire via email was obtained from the database of tourism professionals and experts held by the Seville Tourism Association, from which 39 valid replies were received, providing the data which will be commented on below. The specific objectives of the validation process were the following:
1. Content validation of: (a) the clusters conceptual model; (b) the content of each cluster and (c) the relationships between clusters.
2. Validation of the relative importance of the clusters identified. The object of the content validation process was to test from different perspectives the suitability of the conceptual model produced by CM. On one hand, we were attempting to prove whether the conceptual description of the construct, derived from the clusters (excluding the residual cluster that contained diverse actions with no conceptual relationships), would be accepted by a wider group of experts representing every facet of the local tourism sector. Likewise, we hoped to prove that the assignation of actions to each cluster (or, what amounts to the same thing, the labelling carried out by the investigators based on their analysis of the actions within each cluster) was sufficiently correct. It must also be remembered that the clusters appear in the conceptual model in a specific position on the map, and it was therefore necessary to check that these positions (representing a stronger or weaker bond or conceptual relationship between clusters measured by the Euclidean distance between them) matched the perceived interconnections of a different and broader group of experts. These relationships were tested by asking them to rate, on a single scale, the degree of connection they perceived between pairs of clusters. Finally, they were asked to place in order of importance each of the clusters shown in the model so that the investigators could subsequently compare these weightings with those that were obtained from the conceptual model produced by the CM.
In the first module of the questionnaire we asked the participants to rate on a scale of 0-10 the suitability of the conceptual model (taking each cluster to be a potential strategic line of action in a hypothetical plan to improve Seville‟s ATD). The distribution of the frequencies obtained is shown in table 1. The values of the centrality and dispersion statistics that were calculated are shown in table 2.
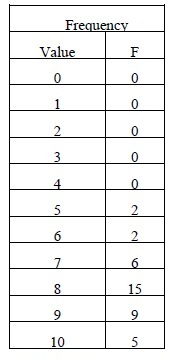
Table 1: Frequency distribution for evaluation of the model's suitability
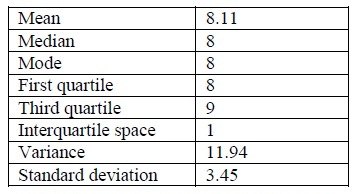
Table 2: Centrality and disoersion figures
From a study of the above data it would be fairly accurate to conclude that the global value given to the conceptual model by the experts was more than acceptable. The mean average of the scores was 8.11, with more than 50% of the opinions being concentrated around 8 and 9 in the distribution (interquartile range = 1). To develop the questionnaire sent to the experts, the investigators randomly chose two actions from each cluster which were then listed in random order. The experts were asked to place each of the actions in the most appropriate cluster. This was perhaps the aspect of the validation which gave less robust conclusions. Using the assignments obtained from the questionnaires, the two following indicators were calculated:
- PSA ("Proportion of substantive agreement for each action"), calculated as the quotient between the number of correct assignations made by the experts (that is, the number of people who placed the chosen action in the cluster indicated by the conceptual model) and the total number of participants.
- CSV ("Coefficient of substantive validity for each action"), calculated as the quotient between the difference observed between correct and incorrect assignations of the actions and the number of total participants. The results obtained are shown in table 3. The average PSA statistic for the 18 chosen actions was 54%; that is, on average, the experts made over 50% of their assignations to the cluster that was produced by the conceptual model. Whilst this is quite a high value, it is usually desirable for this value (either on average or item by item), to be above 75%. Likewise, with regard to the coefficient of substantive validity, only four actions were observed with a statistic equal to 0.5, which is the lower limit commonly considered to be acceptable by investigators.

Table 3: PSA and CSV coefficients
Bearing in mind that the actions were randomly chosen, it is not unreasonable to think that, had other actions been chosen, the results would have been equally different. Furthermore, the questionnaire did not include a detailed description of each cluster, just the wording that was taken from the initial labelling, and one might therefore expect the number of incorrect assignations to be higher than would be desired. It is logical to conclude that a more detailed description of each strategic line of action arising from the conceptual model would have substantially reduced the number of assignation errors. The third element of the validation developed by the investigators related to testing the validity of the weightings derived from the CM process for the clusters conceptual model that had been identified. To achieve this, the participants were asked to rank the model‟s strategic actions in decreasing order of importance (1 to 9), (table 4).
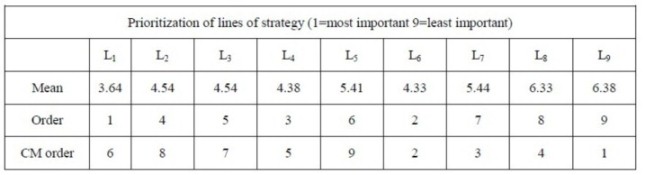
Table 4: Prioritization of the lines of strategy
These three rows show, respectively, the average values obtained of the experts‟ opinions, the order of importance arrived at from these values and, finally, the order derived from the conceptual model obtained during the CM process. The calculation of Spearman‟s rank correlation index for the latter two series produced a value very close to 0 (-0.238), from which it was clear that neither of these rankings was significantly correlated. When a conceptualization process is carried out using CM there are two values in each cluster which could be significant as indicators of the importance of each one within the model. The first is the one that was used previously and which is derived from the values given to each of the items identified by the experts taking part in the conceptualization process. Once the clusters have been created the average importance of the ideas included in each one is calculated and this value is taken to indicate the importance of each block within the model.
A second way to measure the possible importance of each cluster within the conceptual model is to consider the number of ideas in each one (table 5). A comparison of this new criterion (with its resultant ordering), with that derived from the validation questionnaire, led to the results shown in table 6. In this case the Spearman‟s rank correlation index achieved a value of 0.48333, thereby indicating a significant correlation for a significance level of 0.094. It can be stated, therefore, with a confidence level of just over 90%, that a significant correlation exists between both rankings.

Table 5: Prioritization of lines of strategy according to number of ideas they contain

Table 6: Spearman's Correlation Index
It is obvious from the results when evaluating the importance of each cluster within the conceptual model, the consideration of the number of ideas contained in each cluster is much more significant than the average weighting obtained from the evaluation of their importance made by the experts taking part in the conceptualization process. The final validation element related to the arrangement of the clusters within the conceptual map, in other words, the intensity of the relationships which might exist between lines of strategy that emerge from the use of CM. To be able to draw conclusions in this regard, we asked the participants in the validation process to rate, using a single scale (1-7), their perception of the intensity of the relationships between pairs of the lines of strategy in the model. The coordinates of the centroids of each cluster were also identified on the initial conceptual map and the Euclidian distance between them was calculated in pairs. A comparison of the opinions of the participants regarding the intensity of the relationship between the lines and the Euclidean distances between the centroids, obtained the following results (table 7, in annex 2).
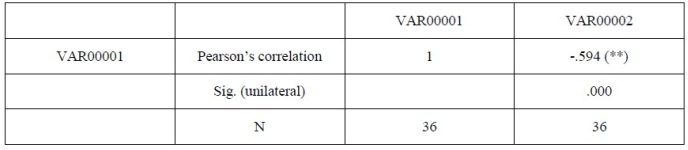
Table 7: Pearson's linear correlation index
Trochim suggests calculating the Pattern Matching coefficient as the validation statistic for the conceptual model. This basically entails measuring the correlation between the two series and seeing the extent to which the correlation is negative and significant through its proximity to -1. The logic of this approach is that the clusters identified by the experts as being more interrelated (shown in the second column of the previous table) should be placed closer together on the conceptual map, according to the Euclidian distance between them (shown in the third column of table 7). In other words, it is an attempt to prove that the more intense the relationship, the smaller the Euclidian distance between clusters.
The Pearson‟s linear correlation index was calculated between both series (table 7), giving a value of -0.594, indicating, at a 99% confidence level, the existence of a negative and significant correlation between both series. This result is extremely important, since it confirms all the terms of the conceptual model that were obtained through the application of the CM technique.
5. Conclusions, limitations and future lines of investigation
It must not be forgotten, when setting out the conclusions to be drawn from this work, that one of the objectives pursued was to test the appropriateness and suitability of the CM methodology for the design of focused action plans, in this case, for the improvement of the ATD. In this context, there is a convergence of different agencies with sometimes conflicting interests, which have to come together to achieve a common "supraobjective", which, at different levels, will be of benefit to of them. To summarize, the CM methodology used in the investigation has the following advantages:
-The use of proven techniques for working in groups, which increases the likelihood of innovation and originality in the aggregated results. -The use of multivariate statistical techniques (MDS and Cluster Analysis) which, by using the ideas of experts and with the support of computing tools, produces a sound aggregated product. -It is possible to create complex models and operational systems arising from ideas with no apparent initial connection. -The participatory methodology garners the experts‟ knowledge of the subject being studied and allows them to interact in the process to make the best use of any potential synergistic effects. -It is an instrument which allows diffuse, multidimensional constructs to be transformed into models for action or operational programmes.
-It uses graphical tools which act as a bridge between purely qualitative information (experts) and the strictly numerical information which is obtained by placing, in the form of points on the map, the ideas that have been developed.
However, it would be foolish to overlook the possibility that, having used the city of Seville as our specific testing ground, conclusions might now be drawn that go beyond the simple enthusiasm for validating one methodology or another in a particular sector. By using this technique ten major lines of strategy were produced which could lead to a common plan for the improvement of the tourist attractiveness of the city. Matters as diverse as resident‟s awareness, the involvement of the subsectors in the tourism field or the improvement of the city‟s infrastructures would make sense as homogenous conceptual groups, which should lead to a more rational approach when developing action plans and programmes with an eye to the future. Similar questions regarding the elements which define competitiveness and ATD have been addressed in works such as those by Kim (1998), Enright & Newton (2004), Shoval & Raveh (2004), Mazanec (2007) or Cracolici & Nijkamp (2008). Similarly, the axes identified by the investigators highlight a reality that perhaps we all know deep down but do not always state publicly. Any tourist destination consists of a complex system and it is not always clear how the different elements interrelate and interact. Steering such a system and –perhaps more importantly– assigning it a project or vision focused on improving its attractiveness to potential visitors, becomes a technically, politically, economically and socially complex task. The inevitable interaction and interdependence of the agencies is not always as clear as it should be in the public positions that are taken by the various interest groups. The suggestions coming from these groups are more often limited to pointing out what the other agencies are not doing, or not doing do well enough, sidestepping the issue which, it seems, is never mentioned, however obvious it may be: namely the need to work together towards an objective which it is in everybody‟s best interest to achieve. It is perhaps this fact which, in our opinion, should be especially highlighted as an additional conclusion of the study, since, at its heart, it demonstrates that the results obtained are in no way influenced by the legitimate or specific interests of any of the groups involved. On the other hand, the analysis of the ATD has been approached, as mentioned above, from a systems perspective (Formica & Uysal, 2006), in which the construct is created by the interaction of elements relating to the offer and demand and the strategies which link them. The results or courses of action for improving the ATD identified in the work confirm this idea. Thus clusters 4, 5, 7 and 9 (see Annex 1) would include elements concerned with what the tourist destination can offer; whilst numbers 2, 3 and 8 would refer to aspects which might affect demand. Cluster 1 would propose measures for the fit or the link between offer and demand; whilst number 6 would include measures and actions for public administration, which could include actions relating to both offer and demand. Finally, cluster 10 brings together a diversity of measures which could fit into any of these three elements of ATD. This study should be seen more as a point of departure than an end in itself. It opens new lines of research which could prove to be extremely interesting, as well as being ideal for the field of tourism. We list below some of these lines of research in the hope that new studies might be able to address them fully:
- It would be interesting to extrapolate the methodology and results obtained to other geographical and civic areas in order to test any similarities, differences and possible need for changes to the application of the methodology due to characteristics peculiar to other destinations. - It would be very interesting to continue improving our knowledge of the ATD construct without it being linked to any specific region. In order to have instruments which could make this a reality, the first task must be to put forward an unequivocal conceptualization so that it can be understood as the product of other formative or reflective (separate or interrelated) "sub-constructs", whose indicators can measure and develop the different facets of the current and future state of a tourist destination. - For example, having a conceptual model with external validity (that is, a model that can be extrapolated to different fields and realities) would mean that not only would it be possible to measure the current state of each destination, but also to construct hypothetical rankings which could be publicised and which, as long as they were updated periodically, could serve as an indirect monitor for both tourists and agencies operating in the destination. - If we agree that there is a need to aim for a high quality of tourism in the different facets of this concept, a clear conceptualization of the ATD construct could lead, for example, to the creation of systems of public recognition in different sectors and, why not, to the development of quality standards which would allow distinctions or quality marks to be awarded for meeting minimum requirements after the appropriate audits have been carried out to test them objectively.
References
ANDERBERG, M. R. (1973): Cluster analysis for applications. New York: Academic Press. [ Links ]
ANDERSON, J.C. and GERBING, D.W. (1991): "Predicting the performance of measures in a confirmatory factor analysis with a pretest assessment of their substantive validities", Journal of Applied Psychology, 76, 732-740. [ Links ]
ANDERSON, L.A., GWALTNEY, M.K., SUNDRA, D.L., BROWNSON, R.C., KANE, M., CROSS, A.W., MACK, R., SCHWARTZ, R., SIMS, T. and WHITE, C.R. (2006): "Using Concept Mapping to Develop a Logic Model for the Prevention Research Centers Program". Preventing Chronic Disease. Public Health Research, Practice, and Policy, 3, 1, 1-9. [ Links ]
BALOGLU, S. and MCCLEARY, K.W. (1999): "A Model of Destination Image Formation", Annals of Tourism Research, 26, 4, 868-897. [ Links ]
BEERLI, A. and MARTÍN, J.D. (2004): "Factors influencing destination image", Annals of Tourism Research, 31, 3, 657-681. [ Links ]
BERBEL-PINEDA, J.M. and RAMIREZ-HURTADO, J.M. (2011): "Does The Foreign Market Entry ModeChoice Affect Export Performance? The Case Of The Spanish Hotel Industry",Journal of Business Economics and Management, 12, 301-316. [ Links ]
BIGNÉ, J. E., SÁNCHEZ, M. I. and SÁNCHEZ, J. (2001): "Tourism image, evaluation variables and after purchase behaviour: Inter-relationship", Tourism Management, 22, 6, 607-616. [ Links ]
BIGNÉ, J.E., ALDÁS-MANZANO, J., KÜSTER and VILA, N. (2002): "The concept mapping approach in marketing: an application in the travel agencies sector", Qualitative Market Research: An International Journal, 5, 2, 87-95. [ Links ]
CRACOLICI, M.F. and NIJKAMP, P. (2008): "The attractiveness and competitiveness of tourist destinations: A study of southern Italian regions", Tourism Management, 30, 336-344. [ Links ]
DIAMANTOPOULOS, A and WINKLHOFER, H.M. (2001): "Index construction with formative indicators: An alternative to scale development", Journal of Marketing Research, 38, 269-277. [ Links ]
DOLNICAR, S. (2004). "Beyond „Commonsense Segmentation‟: A systematic of segmentation approaches in tourism", Journal of Travel Research, 42, 3, 244-250.
DUNN, W. N. (1982): "Reforms as argument", Knowledge: Creation, Diffusion, Utilizations, 3, 293-326. [ Links ] ENRIGHT, M.J. and NEWTON, J. (2004): "Tourism destination competitiveness: a quantitative approach", Tourism Management, 25, 777-788. [ Links ] [ Links ]
FORMICA, S. and UYSAL, M. (2006). "Destination attractiveness based on supply and demand evaluations: an analytical framework", Journal o Travel Research, 44, 418-430. [ Links ]
GOELDNER, C.R. and RITCHIE, J.R.B. (2008): Tourism: principles, practices, philosophies. New York: John Wiley and Sons. [ Links ]
HUGHES, G. and HAY, D. (2001): "Use of concept mapping to integrate the different perspectives of designers and other stakeholders in the development of e-learning materials", British Journal of Educational Technology, 32, 5, 557-569. [ Links ]
JACKSON, K.M. and TROCHIM, W. (2002): "Concept mapping as an alternative approach for the analysis of open-ended survey responses", Organizational Research Methods, 5, 4, 307-336. [ Links ]
KAUR, J. (1981): "Methodological approach to scenic resource assessment", Tourism Recreation Research, 6, 1, 19-22. [ Links ]
KIM, H. (1998): "Perceived attractiveness of Korean destination", Annals of Tourism Research, 25, 2, 340-361. [ Links ]
KRUSKAL, J. B. and WISH, M. (1978): Multidimensional scaling. Beverly Hills, CA: Sage Publication. [ Links ]
LEW, A. (1986): "A model of tourist attraction research", Annals of Tourism Research, 16, 3, 301-317. [ Links ]
MAZANEC, J.A., WÖBER, K. and ZINS, A.H. (2007): "Tourism destination competitiveness: from definition to explanation?" Journal of Travel Research, 46, 86-95. [ Links ]
MCLINDEN, D. and TROCHIM, W. (1998): "Getting to parallel: assessing the return on expectations of training", Performance Improvement, 37, 8, 21-26. [ Links ]
NABITZ, U., SEVERENS, P., VAN DEN BRINK, W and CANSEN, P., (2001): "Improving the EFQM Model: An empirical study on model development and theory building using concept mapping", Total Quality Management, 12, 1, 69-81. [ Links ]
OSBORN, A. F. (1948): Your creative power. New York: Charles Scribner. [ Links ]
PIKE, S. (2004): Destination marketing organizations. Oxford: Elsevier, Ltd. [ Links ]
RAMIREZ-HURTADO, J.M. and BERBEL-PINEDA, J.M. (2010): "Characteristics and perspectives of travel agencies franchises: the case of the spanish market", Tourism and Management Studies Journal, 6, 25-35. [ Links ]
RITCHIE, J.R.B. and CROUCH, G.I. (2000): "The competitive destination: a sustainability perspective", Tourism Management, 21, 1, 1-7. [ Links ]
ROSENBERG, S. and KIM, M. P. (1975): "The method of sorting as a Data-Gathering procedure in multivariate model", Multivariate Behavioural Research, 10, 489-502. [ Links ]
SCOTT R.R, and LAUREN C.C. (2007): "The use of concept mapping for scale development and validation in evaluation", Evaluation and Program Planning, 30, 125-135. [ Links ]
SHERN, D.L., TROCHIM, W. and LACOMB, C. A. (1995): "The use of concept mapping for assessing fidelity of model transfer: An example from psychiatric rehabilitation", Evaluation and Program Planning,18, 143-153. [ Links ]
SHOVAL, N. and RAVEH, A. (2004): "Categorization of tourist attractions and the modeling of tourist cities: base don co-plot method of multivariate analysis", Tourism Management, 25, 741-750. [ Links ]
TANG, J.C.S. and ROCHANANOND, N. (1990): "Attractiveness as a Tourist Destination: a Comparative Study of Thailand and Selected Countries", Socio-EconomicPlanning Science, 24, 3, 229-236. [ Links ]
TROCHIM, W. (1985): "Pattern matching, validity, and conceptualization in program evaluation", Evaluation Review, 9, 5, 575-604. [ Links ]
TROCHIM, W. (1989): "An introduction to Concept Mapping for planning and evaluation", Evaluation and Program Planning, 12, 1, 1-16. [ Links ]
TROCHIM, W. (2000): The Research Methods Knowledge Base. (2nd ed.): Atomic Dog Publishing: Cincinnati, OH. [ Links ]
TROCHIM, W. and LINTON, R. (1986): "Conceptualization for evaluation and planning", Evaluation and Program Planning, 9, 289-308. [ Links ]
TROCHIM, W., MILSTEIN, B., WOOD, B.J., JACKSON, S. and PRESSLER, V. (2003b): "Setting objectives for community and systems change: an application of concept mapping for planning a state-wide health improvement initiatives", Health Promotion Practice, 1, 12, 1-12.
TROCHIM, W., STILLMAN, F.A., CLARK, P.I. and SCHMITT, C.L. (2003a): "Development of a model of the tobacco industry‟s interference with tobacco control programmes", Tobacco Control, 12, 140–147.
WEIDEMAN, M. and KRITZINGER, W. (2003): "Concept Mapping – a proposed theoretical model for implementation as a knowledge repository", Working paper from the "ICT in Higher Education" research project, University of the Western Cape: South Africa. [ Links ]
WITKIN, B.R. and TROCHIM, W. (1997): "Toward a Synthesis of Listening Constructs: A Concept Map Analysis", International Journal of Listening, 11, 1, 69-87. [ Links ]
WU, Y.C.J. (2006): "Skill requirements for logistics license in Taiwan", Supply Chain Management: An International Journal, 11, 5, 415-424. [ Links ]
Submitted: 09.08.2011
Accepted: 10.11.2011
Notes
