


Services on Demand
Journal
Article
 English (pdf)
 Article in xml format
 Article references
 Send this article by e-mail
Indicators
-
 Cited by SciELO
 -
 Access statistics
Related links
-
 Similars in
SciELO
Similars in
SciELO
Share

 Permalink
Tourism & Management Studies
Print version ISSN 2182-8458
TMStudies vol.9 no.1 Faro 2013
Long-run forecasting of the number of the ecotourism arrivals in the municipality of Stambolovo, Bulgaria
Previsão de longo prazo do número de chegadas de ecoturistas no município de Stambolovo, Bulgária
Preslav Dimitrov
South-West University “Neofit Rilski”, Blagoevgrad, Bulgaria, preslav.dimitrov@swu.bg
ABSTRACT
Most of the Bulgarian rural municipalities need to back up their investment decisions in tourism infrastructure by preliminary analysis and forecasts. The present paper regards several major problems in the application of exponential smoothing methods for the purpose of the long-run forecasting for the needs of the mountainous municipality of Stambolovo, Bulgaria, such as: (i) the problem of determining the time series pattern; or the so-called “forecast profile”; (ii) the selection of a suitable forecasting method; (iii) Calculating of short-run and long-run forecasts; and (iv) the comparison of the results of the forecast techniques on the basis of the errors in the forecasts. A specially designed model for estimation of the weight coefficient needed for determining the size of the rural tourism and ecotourism sectors of this very same municipality, located near Bulgaria’s border with Greece and Turkey, is being presented.
Keywords: Forecasting, exponential smoothing, ecotourism.
RESUMO
A maioria dos municípios rurais búlgaros necessita de basear as suas decisões de investimento em infra-estrutura turísticas em análise preliminar e previsões. O presente trabalho aborda vários problemas na aplicação dos métodos de suavização exponencial com a finalidade de previsão de longo prazo para as necessidades do município montanhoso de Stambolovo, Bulgária, tais como: (i) o problema de determinar o padrão de séries temporais; ou o chamado "perfil de previsão", (ii) a seleção de um método de previsão adequado, (iii) Cálculo das previsões de curto prazo e de longo prazo, e (iv) a comparação entre os resultados das técnicas de previsão com base nos erros das previsões. Apresentamos aqui um modelo especialmente concebido para a estimativa do coeficiente de peso necessário para determinar o tamanho dos setores de turismo rural e ecoturismo deste mesmo município, localizado perto da fronteira da Bulgária com a Grécia e a Turquia.
Palavras-chave: Previsão, suavização exponencial, ecoturismo.
1. Introduction
Most of the Bulgarian rural municipalities located in the border regions with Greece and Turkey are facing the necessity to develop its tourism potential as a main and sometimes the only economic alternative to their feeble agricultural sectors. The investment decisions of the municipalities in this regard often need to be backed up by preliminary analysis and forecasts. This is especially valid for the business plans which have to be prepared by the municipalities for acquiring EU and central government funding for the construction of tourism information centres, hiking pathways and other tourism infrastructure.
The municipality of Stambolovo, Bulgaria is one of the numerous municipalities in the country struggling to provide alternative to the agriculture source of employment for its population. The municipality of Stambolovo is located in the
Haskovo region of Bulgaria and it has a territory of 277 sq. km. It is entirely situated in the most South-Eastern part of the Rodopi Mountains and it is some 22 km away from the regional centre of Haskovo. The municipality is also a part of the “Rodopi” tourism region (or the “Rodopi” tourism “locus” according to the Bulgarian Tourism Act), which was visited in 2009 by 8.6% and in 2010 by 10.5% of all the Bulgarians who had their summer vacation within the country. In 2010 the tourism region, to which the municipality of Stambolovo belongs, was visited by 13% of all the foreign tourists who visited Bulgaria in the summer tourism season (Graphic 1).

In the meantime, in 2011 the municipality of Stambolovo incidentally recorded 3184 night stays in the hotel accommodation structures on its territory. And if it is assumed that the average number of the tourists’ stay comprises two nights, mainly due to weekend trips undertaken to the municipality, one can estimate the average number of the tourism arrivals in the municipality of Stambolovo at some 1592 arrivals.
The findings about the possible share of the tourism industry of the municipality of Stambolovo and the ecotourism as a whole, however, does not provide enough grounds for an objective forecasting for its development. The building up of forecast model, especially with the use of the exponential smoothing methods needs a more sophisticated and multistage approach with a certain number of clearly set objectives.
2. Objectives
The task of creating an exponential smoothing forecast model for the long-run development of the tourism industry in a small micro-destination, such as the municipality of Stambolovo, Bulgaria, meets with solving of several major problems:
(i) Finding of a suitable general indicator, on the basis of which to build the long-run forecasts (the forecast for periods longer than 5 years);
(ii) Determining the time series pattern, or the so-called “forecast profile”(Gardner, 1987:174-175) (Hyndman, Koehler, Ord and Snyder, 2008:11-23) and the quality of the data in the pattern, on the basis of which to select the suitable forecasting exponential smoothing model.
(iii) Selecting and using of suitable forecasting techniques;
(iv) Calculating of long-run forecasts for the value of the above-mentioned general indicator (up to the year 2022);
(v) Comparing the results of the forecast techniques (the forecast models) on the basis of the errors in the forecasts.
(vi) Estimating the size of the ecotourism sector of the Municipality of Stambolovo, Bulgaria in certain terms, so that the forecast(s) of the above-mentioned general indicator could be particularized especially for the needs of the municipality.
3. Methodology and main results
With regards to the first problem, set in the previous point of the present paper, i.e. the difficulties in finding of a general suitable indicator, on the basis of which to make the forecast, it can be pointed out that they come mainly from the lack of reliability and the sustainability of the existing data for the separate types of indicators for tourism demand, especially in terms of time.
A greater part of the existing indicators are inconsistent in time and they lack enough data which would allow the building of sufficiently long time series (Dimitrov, 2010) (Stankova, 2010) (Filipova, 2010).
Here one could refer to certain indicators such as the indicator “volume of the tourism receipts”, for example, which was calculated for different periods of time in different currencies – non-denominated Bulgarian leva, US dollars, German marks and Euros. At the same time, the indicator “number of tourism arrivals”, respectively “number of foreign tourists”, as per the definition of the United Nations World Tourism Organization, was introduced and implemented in the Bulgarian statistical system in the end of 1990s.
The sole indicator which allows a comparatively long and sustainable time series to be built is the indicator “number of foreign visitors with recreation and holiday aims”, which continues to be recorded by both the former State Tourism Agency (now part of Bulgaria’s Ministry of Economy, Energy and Tourism) and the Bulgarian National Statistical Institute as a part of the indicator “number of the foreign citizens visiting Bulgaria with tourism aims”.
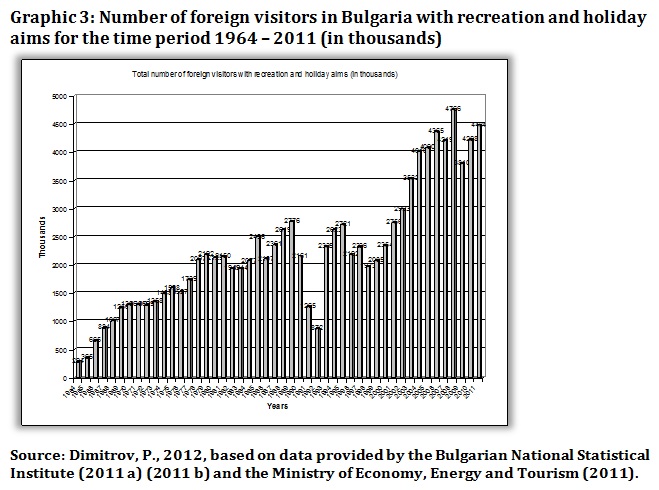
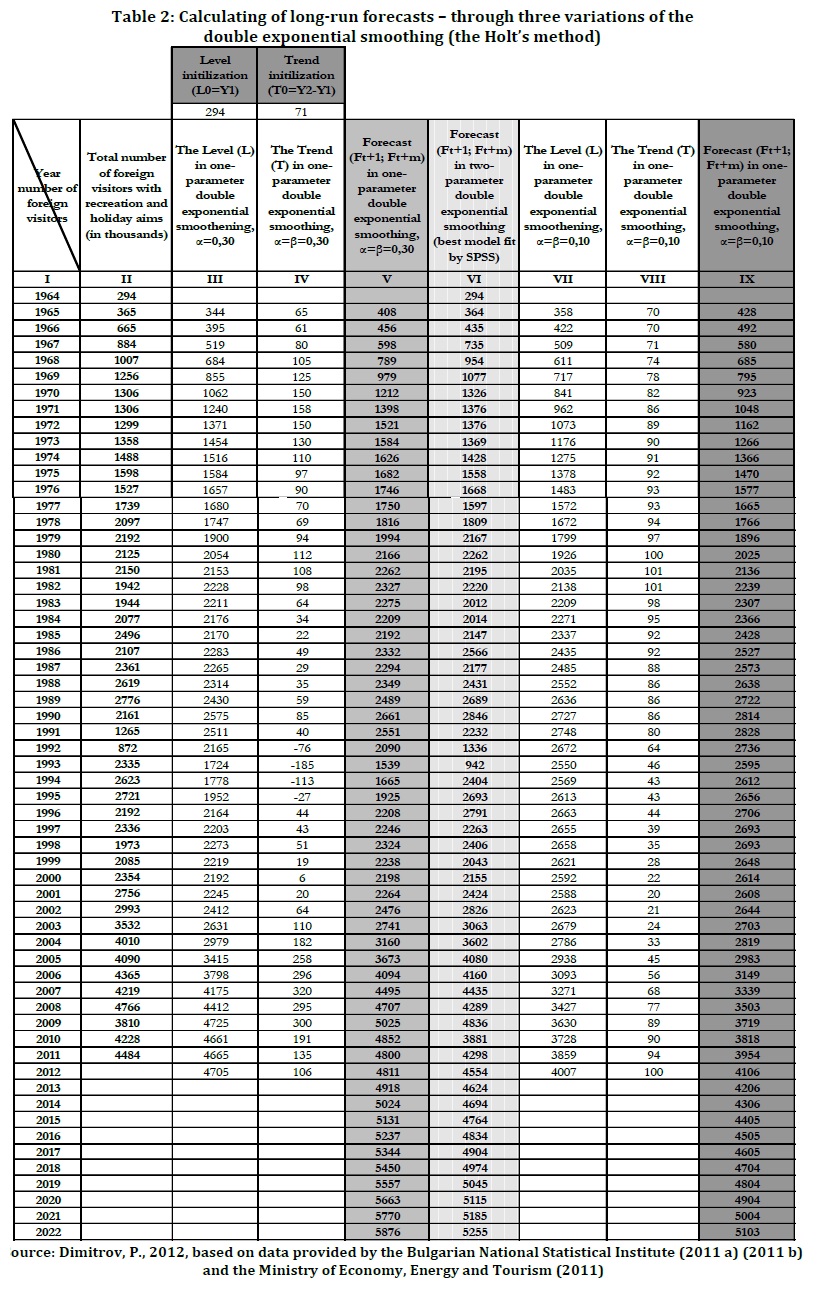
Taking into account the annual data available for the indicator “number of foreign visitors with recreation and holiday aims”, one can build a time series of 48 time periods (Graphic 3 and Graphic 4) – from 1964 to the last year of recorded value 2011.
Graphic 3
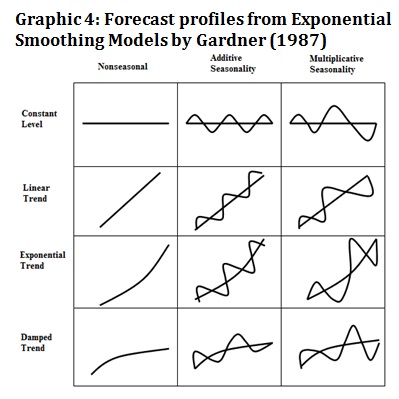
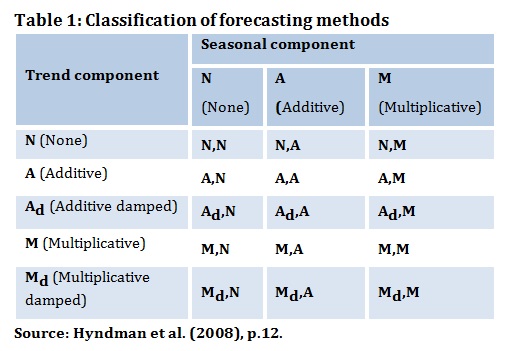
The second problem of determining the times series pattern, or the so-called times series’ “forecast profile” is usually solved by comparing the times series in regard with a pre-set classification of exponential smoothing methods or the derived form them forecast profiles in terms of development curves. As Hyndman, Koehler, Ord and Snyder point out (Hyndman et al., 2008:11-12), this classification of smoothing methods originated with Pegles’ taxonomy (Pegles, 1969:311-315). This was later extended by Gardner (Gardner, 1985:1-28) and modified by Hyndman et al. (2002, 2008) and extended by Taylor (Taylor, 2003:715-725) giving a classification set of fifteen models (Table 1). In the regarded time series, as it will become later clear, the Gardner’s much simplified classification can also be successfully used for finding the best fit forecasting method or forecast profile.
A simple visual comparison of the times series of the number of foreign visitors in Bulgaria with recreation and holiday aims for the time period 1964 – 2011 with the Gardner’s classification shows out that these particular time series comes into the “linear trend, non-seasonal” profile. Of course with the help of more sophisticated statistical analysis, such as the linear trend estimation by the use of the least squares method and etc., it can be also proved that these very same time series comes into the “A,N” variation of Taylor’s patterns of forecasting methods that requires the presence of a trend but with no seasonal components.
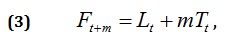
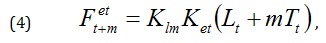
The finding that the time series of the number of foreign visitors in Bulgaria with recreation and holiday aims for the time period 1964 – 2011 correspond to the “linear trend, non-seasonal” profile and require the “A,N” variation of exponential forecasting methods makes the third problem, the one of selecting and using of a suitable forecasting exponential smoothing method much more predetermined and easier to solve. As both Gardner and Hyndman et al. point out this profile corresponds to the method of double exponential smoothing in the presence of a linear trend, known as the Holt’s method. The mathematical notation of this method is as follows:
Ø The smoothing of the level (the base) – “L”:
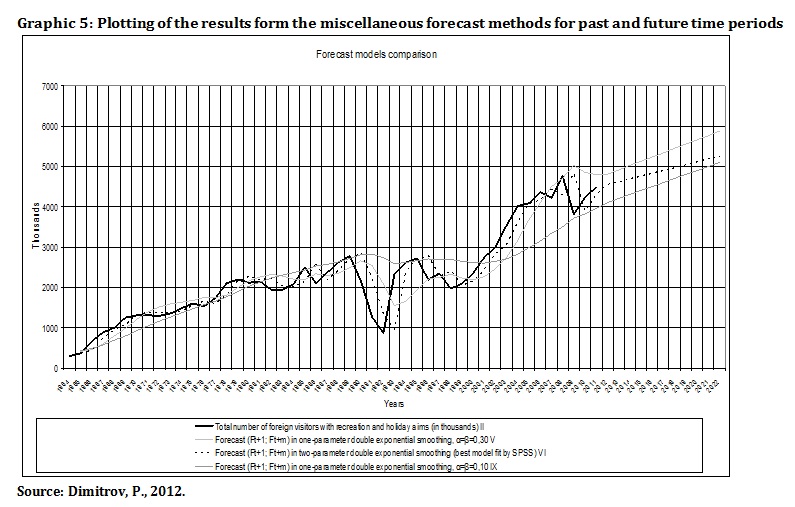
Ø The smoothing of the trend – “Т”: Ø The achieving of the final forecast “Ft+m” for “t+m” periods ahead in the future : Where: „α” and „β” are the smoothing constants for the level and the trend respectfully which could take values between 0 and 1. In this situation, it would be useful if the selected method for forecasting through exponential smoothing – the method of the double exponential smoothing (the Holt’s method) is tested in different values of the smoothing constants „α” and „β” in order to minimize the forecast error. One of the criteria for this minimizing could be the mean absolute percentage of error (MAPE). For the purpose of visualization of the results from the different forecast methods for past and future periods, as well as the extent of achieved error (in comparison of the forecast values with the actually observed ones for the past periods of time), these results are presented in table and graphic form in Table 2, Graphic 5 and Graphic 6. As it is obvious from the table and the both graphics, the existing statistical software products could be used for defining of an optimal best-fit forecast model, i.e. for defining of the optimal values of the smoothing constants (used for calculations in column VI of Table 2 and for plotting the black dotted forecast curve in Graphic 5 and in Graphic 6 ). Of course, the inherent capacities of the statistical software products in this regard should not be overestimated and over-praised. 

Graphic 5
Graphic 6
Table 2, Graphic 5 and Graphic 6 provide also a solution for the third and the fourth problems set for solving in the present paper, i.e. iii “
Calculating of long-run forecasts for the value of the above-mentioned general indicator (up to the year 2022)”; and iv “Comparing the results of the forecast techniques (the forecast models) on the basis of the errors in the forecasts” .
Based on the results in Table 2 and Graphic 5, one can outline three major types of forecasts for the number of the foreign visitors with recreation and holiday aims for 2022, as follows:
· A pessimistic forecast (the forecast with the lowest value) – calculated by the method of the one-parameter double exponential smoothing with α=β=0.10:
5 103 000 foreign visitors;
· The forecast (calculated by the use of SPSS) with the lowest mean absolute percentage of error (MAPE) – calculated by the method of the double exponential smoothing with α=0.999 and β=7.384x10⁻⁵:
5 255 000 foreign visitors;
· The most optimistic forecast (the forecast with the highest value) – calculated by the method of the one-parameter double exponential smoothing with α=β=0.30:
5 876 000 foreign visitors.
All these forecasts, as well as the forecasts presented in Table 2 and Graphic 5, have one major disadvantage – they are produced for the general indicator “number of foreign visitors in Bulgaria with recreation and holiday aims”, which means that they refer to the whole of Bulgarian tourism industry and not to the sub-sector of ecotourism and the part of which belong to the small rural and mountainous municipality of Stambolovo. In order to overcome this disadvantage and solve problem v “ estimating the size of the ecotourism sector of the Municipality of Stambolovo, so that the forecast(s) of the general indicator could be particularized especially for the needs of the municipality” , a certain modification is needed.
One way of doing so is by the use of a weight coefficient which shall indicate the share of the foreign visitors with intention to practice ecotourism in the municipality of Stambolovo. Or, as it has been mentioned in the initial part of this paper, an estimation of the sizes of the Bulgarian ecotourism tourism is needed to make the above general indicator more particularized (task v). Thus, equation (3) can be modified into equation (4), as follows:
Where:
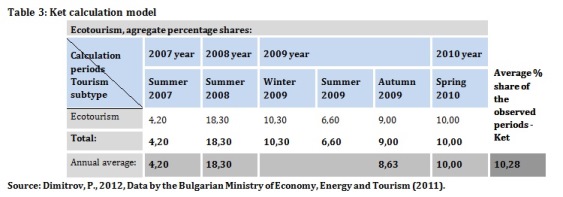
K е t is the coefficient of the share of foreign visitors with ecotourism aims (Table 3).
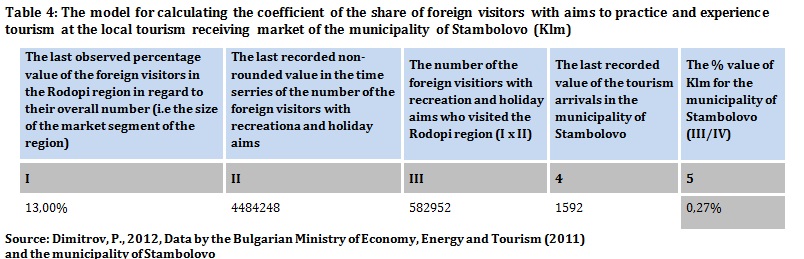
Klm is the coefficient of the share of foreign visitors with aims to practice and experience tourism at the local tourism receiving market of the municipality of Stambolovo (Table 4).
Table 4
Neither the Bulgarian National Statistical Institute (NSI), nor the Bulgarian Ministry of Economy, Energy and Tourism, nor any other Bulgarian government institution keeps a regular statistical record of the foreign visitors with ecotourism
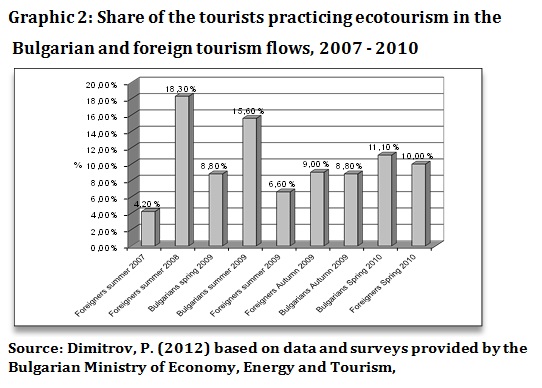
tourism aims. However, as it was already pointed in Graphic 2, there are six consequent surveys on the foreign visitors in both the winter and conducted by the different market research companies in Bulgaria. These six surveys, though based on samples of approximately 3000 foreign citizens visiting Bulgaria, provide two sets of important figures: (i) a percentage share of the foreign visitors practicing ecotourism activities in the months of the winter tourism season and (ii) a percentage share of the foreign visitor practicing spa and wellness activities in the months of the summer tourism season. Based on these two sets of figures, a model for calculating the Ket (the coefficient of the share of foreign visitors with ecotourism aims) can be built (Table 3).
The model (Table 4) for calculating the coefficient of the share of foreign visitors with aims to practice and experience tourism at the local tourism receiving market of the municipality of Stambolovo (Klm) is based on the data provided for: (i) the last observed percentage value of the foreign visitors in the region in regard to their overall number (i.e. the size of the market segment of the region, Graphic 1) (ii) The last recorded non-rounded value in the time series of the number of the foreign visitors with recreation and holiday aims (Graphic 3); and (iii) the last recorded value of the tourism arrivals in the municipality of Stambolovo, as pointed in the beginning of the present paper.
The models, presented in Table 4 and Graphic 5, have of course many weak points. The first consideration in this regard is the fact that the coefficient Ket is calculated on the assumption that it will remain constant in value throughout all the forecast periods. The only reason for accepting of such a rough assumption is the scarcity of statistical records on which to build a separate model for the development of the coefficient in the course of time. The second week point is that the coefficient Ket is calculated on the basis of data received from sample surveys, which on the other hand are conducted by different companies and thus there are: (i) probability errors in the data collected; and (ii) some, though not quite big, differences in the size of the samples and in the methodologies of surveys. The third week point comes in the fact that due to the already mentioned lack of previous data only four consequent years have been used for the calculation of the coefficient Ket. Despite all these weak points, the model for calculating of Ket helps to overcome the entire lack of regular statistic data for the ecotourism in Bulgaria. As for the model for calculating the coefficient Klm, it is quite a simplified way for acquiring the share of foreign visitors with aims to practice and experience tourism at the municipality of Stambolovo by multiplication and extrapolation of the existing data.
Having calculated the values of Ket and Klm and using equation (4), as well as the data in Graphic and Graphic 5 and Table 2, the forecasts of the number of the foreign visitors with spa and wellness tourism aims to Bulgaria for 2022 can be easily made. An even simpler way to do some of the necessary calculations is to multiply the already presented pessimistic, most optimistic and lowest MAPE level forecasts for the general indicator “number of foreign visitors with recreation and holiday aims” by the decimal value of Ket, i.e. 0.1028 and the decimal value of Klm, i.e. 0.0027 respectfully, as follows:
· The pessimistic forecast for 2022 (the forecast with the lowest value) calculated by the method of the one-parameter double exponential smoothing with α=β=0.10:
FetT+22 = 0.1028 x 0.0027 x 5 103 000 = 1 416 foreign visitors with ecotourism aims;
· The forecast (calculated by the use of SPSS) with the lowest mean absolute percentage of error (MAPE) – calculated by the method of the double exponential smoothing with α=0.999 and β=7.384x10⁻⁵:
FetT+22 = 0.1028 x 0.0027 x 5 255 000 = 1 459 foreign visitors with ecotourism aims;
· The most optimistic forecast (the forecast with highest value) – calculated by the method of the one-parameter double exponential smoothing with α=β=0.30:
FetT+22 = 0.1028 x 0.0027 x 5 876 000 = 1 631 foreign visitors with ecotourism aims.
4. Conclusions
The presented pessimistic, most optimistic and lowest MAPE level forecasts for the number of foreign visitors arrivals in the municipality of Stambolovo with aims to practice ecotourism suggest that by 2022 it will vary roughly between 1 416 and 1 631. The municipality’s authorities, however, believe that these forecasts of quite a low level of foreign tourism arrivals make can be overcome by using EU funds for building of a local tourism information centre, which could also assist the local tourism industry in preparing and planning of its advertising and promotion campaigns.
The presented in the paper forecasting technology, though having many shortcomings, could be applied also for municipalities and other regional units in other countries, which have unsteady and insufficient statistical records on their ecotourism. The main precondition for using this forecasting technology is to have a sustainable time series of a general tourism indicator such as “number of foreign visitors” and at least some clue about both the size of the ecotourism as a part of this very same indicator and the size of the incoming in the municipality tourist flows.
References
Brown, R. G. (1959). Statistical Forecasting for Inventory Control. New York: McGraw-Hill. [ Links ]
Brown, R. G. (1963). Smoothing, Forecasting, and Prediction of Discrete Time Series. New Jersey: Prentice-Hall. [ Links ]
Dimitrov, P., (2012). Long-term Forecasting of the Spa and Wellness sub sector of the Bulgarian Tourism Industry. Tourism & Management Studies, 7, 140-148. [ Links ]
Dimitrov, P. (2010). Short-run forecasting of tourism arrivals in separate sectors of Bulgarian tourism industry. Paper presented at the scientific conference Proceedings of the International Scientific Conference Alternatives for Development of the Modern Tourism, Bulgaria, 378-389. [ Links ]
Filipova M., (2010). Peculiarities of Project Planning in Tourism. Perspectives of Innovations Economics and Business, 4(1), 57-59. [ Links ]
Gardner, E. S. (1985). Exponential Smoothing: the state of the art. Journal of Forecasting, 4, 1-28. [ Links ]
Gardner, E. S. (1987). Smoothing methods for short-term planning and control. In S. Makridakis & C. S. Wheelright (Ed.), The Handbook of forecasting – A Manager’s Guide, (pp. 174 -175). New Jersey: John Wiley & Sons. [ Links ]
Hyndman, R., Koehler, A., Keith Ord, J. & Snyder, R. (2008). Forecasting with Exponential Smoothing – The State Space Approach. Berlin: Springer. [ Links ]
National Statistical Institute (2011 a). Statistical Yearbooks of the People’s Republic of Bulgaria for the period 1964-1989. Retrieved September 29, 2011 from http://www.nsi.bg. [ Links ]
National Statistical Institute (2011 b). Statistical Yearbooks of the Republic of Bulgaria for the period 1990-1999. available Retrieved September 29, 2011 from http://www.nsi.bg. [ Links ]
Ministry of Economy, Energy and Tourism (2011). The foreign and the Bulgarian Tourists in Bulgaria – General Observations and Attitudes. Retrieved June 29, 2012 from http://www.mi.government.bg/files/useruploads/files/turism_-_statistika_i_analizi/prouchvania_proekti/prouchvane_chujdenci_bulgarians_20092010_obshtinabljudenia.pdf. [ Links ]
Pegles, C. (1969). Exponential forecasting: some new variations. Management Science, 15(5), 311-315. [ Links ]
Stankova, M. (2010). The Tourism Regions in Bulgaria - Concepts and Challenges. Journal of Tourism & Hospitality Management, 16(1), 109-117. [ Links ]
Taylor, J. W. (2003). Exponential Smoothing with a damped multiplicative trend. International Journal of Forecasting, 19, 715-725. [ Links ]
Article history
Received: 01 July 2012
Accepted: 04 September 2012
