


Serviços Personalizados
Journal
Artigo
 Inglês (pdf)
 Artigo em XML
 Referências do artigo
 Enviar este artigo por email
Indicadores
-
 Citado por SciELO
 -
 Acessos
Links relacionados
-
 Similares em
SciELO
Similares em
SciELO
Compartilhar

 Permalink
Tourism & Management Studies
versão impressa ISSN 2182-8458
TMStudies vol.9 no.1 Faro 2013
The moderating role of strategy and environment on the relationship between corporate liquidity and investment: evidence from panel data
O papel moderador da estratégia e do ambiente na relação entre a liquidez e o investimento das empresas: um modelo com dados em painel
Celísia Baptista1, Fernanda Matias2, Patrícia Oom do Valle3
1School of Management, Hospitality and Tourism - University of the Algarve, CEFAGE Research Center, Portugal, cbaptist@ualg.pt;
2School of Management, Hospitality and Tourism - University of the Algarve, CEFAGE Research Center, Portugal, mfmatias@ualg.pt;
3Faculty of Economics - University of the Algarve, Research Centre for Spatial and Organizational Dynamics (CIEO), Portugal, pvalle@ualg.pt
ABSTRACT
In order to test the moderating role of corporate strategy and industry environment in the effect of liquidity on investment for Portuguese manufacturing firms, we developed a multiple linear regression model for panel data. It is a static model with three types of variables: financial; strategic/environmental; and interactive. The estimated model was validated through the Breusch-Pagan/Cook-Weisberg and Wald Modified tests (heteroscedasticity tests), Lagrange Multiplier (industry random effects test, using the two-digit National Classification of Economic Activities), Hausman robust test (fixed effects model vs. random effects model test) and likelihood-ratio test (joint effect of industry and time test). The statistical processing of the data revealed that a company’s strategy (diversification and innovation) and the industry environment (growth) moderate the effect of liquidity on investment, which can be explained by the effect of these factors on the cost of asymmetric information.
Key words: liquidity, investment, leverage, industry environment, corporate strategy.
RESUMO
Com o objetivo de testar o papel moderador da estratégia e do ambiente da indústria na relação da liquidez com o investimento da indústria transformadora portuguesa foi desenvolvido um modelo de regressão linear múltipla para dados em painel. Trata-se de um modelo estático com três tipos de variáveis: financeiras; estratégicas/ambientais; e interactivas. O modelo estimado foi validado através dos testes de Breusch-Pagan/Cook-Weisberg e Wald Modificado (testes de heterocedasticidade) do multiplicador de Lagrange (teste aos efeitos aleatórios da indústria, tendo-se utilizado a Classificação Portuguesa das Atividades Económicas a dois dígitos), teste robusto de Hausman (teste do modelo de efeitos fixos vs. o modelo de efeitos aleatórios) e teste likelihood ratio (teste ao efeito conjunto da indústria e do tempo). O tratamento estatístico dos dados revelou que a estratégia da empresa (diversificação e inovação) e o ambiente da indústria (crescimento) influenciam a intensidade da relação da liquidez com o investimento o que pode dever-se ao facto destes fatores influenciarem os custos de informação assimétrica das empresas.
Palavras-chave: liquidez, investimento, endividamento, ambiente da indústria, estratégia empresaria
Introduction
The aim of this study is to test the moderator role of corporate strategy and industry environment in the relationship between internal liquidity (cash flows) and investment in the manufacturing industry. The strategies and environmental dimensions analyzed are innovation, diversification, growth and dynamism.
Following the work of Fazzari et al. (1988), the sign and the intensity of the relationship between cash flows and investment has been justified by several authors with the existence of restrictions on external financing resulting from capital market imperfections.
The literature on capital structure has revealed the factors, often of a financial nature, that explain asymmetric information costs. However, asymmetric information costs and, consequently, corporate financial options can also be associated with strategic and environmental factors, which led Bettis (1983) to highlight the importance of financial theory and strategic management integration.
1. Literature review
Fazzari et al. (1988) started a period of great development in the study of the effect of liquidity on corporate investment, through the presentation of research in which the investment model is subject to financial restrictions. In this study, and in the studies that followed, the levels of corporate financial constraints were evaluated through the intensity of the relationship between net value and cash flows with investment. This relationship is explained in financial theory by the fact that financial constraints are associated with asymmetric information costs, including agency and adverse selection costs.
Dividend payout ratio (e.g. Fazzari et al., 1988; Alti, 2003), size (e.g. Gilchrist and Himmelberg, 1995; Carpenter and Guariglia, 2008), banking relationships (e.g. Hoshi et al., 1991; Houston and James, 2001: Riddiough and Wu, 2009), debt level (e.g. Whited, 1992; Gérard and Verschueren, 2003), bonds rating (e.g. Whited, 1992; Gilchrist and Himmelberg, 1995; Agca and Mozumdar, 2008) and interest coverage ratio (e.g. Whited, 1992) constitute some of the proxies used in the assessment of financial constraints. Other authors (e.g. Kaplan and Zingales, 1997; Hovakimian and Titman, 2006) have used a set of variables to classify a firm’s financial position. However, Gilchrist and Himmelberg (1995) and Kaplan and Zingales (1997, 2000) warn of the difficulties in applying this methodology which arise from the diversity of financial constraints to which firms are subject, and from the fact that the proxy for investment opportunities may not be effective, leading to the internal liquidity proxy also constitutes a proxy of investment opportunities.
Jensen and Meckling (1976) explain the agency costs arising from conflicts of interest between creditors and managers/entrepreneurs by invoking the argument of moral hazard. The conflict is associated with the fact that managers may engage in activities which are undesirable from the standpoint of creditors, reducing the likelihood of debt repayment. High debt levels can induce managers to choose projects with high risk and to replace assets since managers’ compensation varies positively with project risk. However, the increased risk of projects leads investors to raise interest rates and to introduce clauses in loans which restrict future indebtedness. In a context of asymmetric information between managers and financiers, heavily indebted firms prefer financing with internal funds, not only because the cost of external funds is greater than the internal costs, but also because it is difficult for the firm to obtain additional funds in the market and to renegotiate existing loan agreements so as to prevent failure and bankruptcy. In the event that there are insufficient internal funds, these companies may be faced with a problem of underinvestment. When its financial position is unfavorable, there is an even greater need for a firm to have recourse to external funds that, in this context, have a high cost, which translates into a low and inefficient investment (Bernanke and Gertler, 1990).
The other component of agency costs is called free cash flow cost, and it results in excess flows of funds after the funding for all projects with positive net present value (Jensen, 1986). It occurs when the incentives of managers and shareholders are not aligned, and may lead to a reduction of the shareholders’ wealth and to overinvestment if there are any excess funds (Jensen, 1986; Stulz, 1990). In this situation, managers, seeking to obtain personal benefit at the expense of shareholders, carry out superfluous expenditure and invest in projects with a reduced recovery period but with high risk, which contributes to an increase in control and monitoring costs (Jensen, 1986). Jensen (1986) and Stulz (1990) argue that managers have incentives to make the company grow above its optimal size, because growth increases their power due to the increase in the resources under their control.
The adverse selection arises from the existence of capital market asymmetric information, which makes it difficult to distinguish between firms on the grounds of their quality, and leads, as a moral hazard, to investors demanding higher returns to compensate them for the additional risk and monitoring costs. However, asymmetric information leading to adverse selection occurs prior to the transaction, while moral hazard occurs after the conclusion of the transaction. This generates a differential between the cost of financing in the capital markets (debt and new shares) and internally generated funds. This sometimes leads to the implementation of lower quality projects, while others, more economically advantageous, are not carried out because they fail to attract the required funds. A rise in market interest rates can cause only those companies with a higher risk to be willing to borrow at that rate, because those companies feel that the likelihood of debt repayment is low (Stiglitz and Weiss, 1981).
On the other hand, the literature suggests that strategic and environmental variables can also affect the relationship between internal funds and investment, although the study of this theme needs to be deepened. Strategy (e.g. innovation and diversification) can influence asymmetric information and transaction costs and, consequently, corporate financing (Jordan et al., 1998; Menéndez-Alonso, 2003). It is also expected that the industry environment affects the relationship between investment and internally generated funds because it affects the risk of bankruptcy and firms’ capacity for debt (Devereux and Schiantarelli, 1990).
The strategy of innovation in products and/or processes has high asymmetric information costs (leading to moral hazard and adverse selection), so it tends to be pursued by firms that have a good financial position (reduced indebtedness and high liquidity) (Brophy and Shulman, 1993; Jordan et al., 1998; O’Brien, 2003; Singh and Faircloth, 2005). This is the only way they can ensure the continuous investment in research and development (R&D), the availability of funds for the launch of new products or the introduction of new processes, and the expansion of their knowledge base through the acquisition of other companies. The market has great difficulty in predicting the output from the inputs in an innovative firm, which does not allow an easy distinction between “good” projects and “bad” projects, and this exacerbates the problems of moral hazard and adverse selection (Himmelberg and Petersen, 1994) and reduces the firm’s ability to raise capital in the market.
Research in the area of strategy and finance concludes that unrelated diversification generates inefficiencies because decisions taken within the organization do not follow the same principles according to which decisions are taken on the market. Sometimes resources are channeled into businesses with poor performance, and there is a kind of “socialism” with the strongest divisions subsidizing the weaker (Scharfstein and Stein, 2000). The investment in the different segments of a company depends less on their investment opportunities than would be the case if the segment constituted a firm (Lamont, 1997; Shin and Stulz, 1998). Distortions in the allocation of resources are more accentuated when inequality between the resources and investment opportunities of the divisions is very large (Rajan et al., 2000). The overinvestment of firms in a strategy of unrelated diversification is explained by agency theory, which says that a manager prefers to channel free cash flows into new activities rather than to distribute them, so that his power is not reduced (Lim et al., 2009). On the other hand, the managers of such companies avoid debt because of the controlling effect that debt brings to their activity (Stulz, 1990). The literature that has sought to relate performance to strategy suggests that companies with concentrated activities have superior performance, providing them with greater financial capability (Lang and Stulz, 1994; Lamont and Polk, 2002).
Financial theories suggest that firms which operate in growth sectors generally have a lower risk of bankruptcy and a higher debt capacity (Devereux and Schiantarelli, 1990). Pecking order theory proposes a positive relationship between growth and debt, since internal funds may not be sufficient to fund a firm’s investment plan. On the other hand, adverse selection problems tend to be less acute when investment opportunities are high, since the issuance of debt is seen by the market as a positive step to ease the indebtedness. At the level of organizational performance, studies indicate that industry growth can be associated with more investment to take advantage of investment opportunities and maintain a competitive position (Lippit et al., 1988; Bobillo et al., 2002), making the investment depend mainly on the availability of external funds.
Regarding the effect of environmental dynamism in business finance, different studies suggest that borrowing happens more often in stable environments than in highly dynamic environments because the probability of a positive effect of the environment on performance is higher in the first situation. The choice of a lower level of debt by companies who develop their activity in unstable environments can be justified by agency and transaction costs theories. Agency theory suggests that higher risk leads, in some cases, to investors’ refusal to finance projects and, in other cases, to the interest rate increasing and the manager’s activity being restricted due to the control exercised by debt holders (Simerly and Li, 2000). According to Milliken (1987), environmental dynamism affects the amount and quality of information for decision-making. In a highly dynamic environment, markets and stakeholders have difficulty in assessing corporate investments and manager’s decisions. Thus, companies that operate in relatively stable environments should prefer to finance through debt, because the cost of debt tends to be lower than in more unstable environments, and debt holders can enjoy the competitive movements of the company and can control the agency problems (Simerly and Li, 2000). As environmental dynamism increases, debt will be replaced by equity (Simerly and Li, 2000). Transaction costs theory recommends equity financing in situations of high specialization (Williamson, 1988). Companies that operate in dynamic environments require more specialized equipment and personnel and more investment in R&D and marketing than firms in stable environments so that, generally, they have a higher debt cost (Simerly and Li, 2000).
2. Methodology
3.1 Research hypotheses
After the literature review, we formulated four research hypotheses with which we seek to determine whether the dependency of investment in respect of internal funds is moderated by strategic and environmental factors:
1. Innovation strategy reinforces the effect of internal liquidity in assets investment, ceteris paribus.
2. Diversification strategy reinforces the effect of internal liquidity in assets investment, ceteris paribus.
3. Industry growth reduces the effect of internal liquidity in assets investment, ceteris paribus.
4. Industry dynamism reinforces the effect of internal liquidity in assets investment, ceteris paribus.
It is expected that investment in firms that pursue a strategy of innovation is more dependent on the availability of internal funds than is investment in other firms, due to the fact that this strategy is associated with higher asymmetric information costs. It is expected that investment in firms implementing unrelated diversification strategies is more dependent on internal funds than is investment in firms that prefer a concentration of activities (specialization), due to the overinvestment agency costs of these companies. Asset investment by companies whose industry offers high investment opportunities should depend less on internally generated funds than asset investment by companies that are similar but belong to industries that offer fewer investment opportunities. Whereas industry dynamism has a positive effect on business financing through equity, and retained earnings is the main source of financing for Portuguese firms, investment in firms belonging to industries with greater dynamism should depend more on internally generated funds than investment in firms that are similar but belong to industries with less dynamism.
3.2 Data and variables
The sample, obtained from the SABI database (System for Analysis of Iberian Balances) of the 20,000 largest companies in Portugal, is non-probabilistic and is composed of accounting and non-accounting data of manufacturing companies (codes 15 to 37 of the Portuguese classification of economic activities – NACE), in the period 1998-2005. This sample is of unbalanced data, in order to obtain a panel which is as representative as possible.
Approximately 2,200 manufacturing firms were excluded, throughout the period, because they had just started up, had a very difficult economic and/or financial situation, had capital shares owned by public authorities, experienced changes to the dummies Ownership Structure and Diversification and in three-digit NACE code, or did not have information that would allow the construction of the different variables of the model for at least one year of the period. Thus, a panel composed of 2,320 firms and 11,204 observations was obtained.
In accordance with the problem and the research hypotheses we defined the dependent variable (assets investment) and the explanatory variables. The latter variables were classified as liquidity (flow and stock of liquidity), investment opportunities (sales, profitability variation and inventory), control (collateral value, size, ownership structure and time effect), strategic (innovation and diversification), environmental (growth and dynamism of industry) and interactive (joint effect of liquidity, strategy and the industry environment).
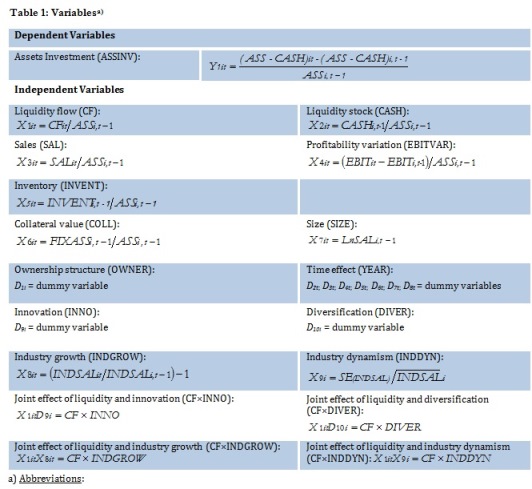
ASS – Total Assets, net; CASH – Cash and Equivalents; CF – Cash Flow; DIVER – Diversification Strategy; EBIT – Earnings Before Interest and Taxes; FIXASS – Fixed Assets, net; INDDYN – Industry Dynamism; INDGROW – Industry Growth; INDSAL – Industry Sales; INOV – Innovation Strategy; INVENT – Inventories; ASSINV – Assets Investment; Ln – Natural Logarithm; SAL – Firm Sales; SE – Standard Error of the regression slope coefficient (regression of industry sales against time over 8 years (1998-2005).
The proxy of investment, assets investment, was preferred to the proxy fixed asset investment, which is more usual in this type of study, because it allows the analysis to consider all of the applications of funds by a firm (in fixed and current assets). Carpenter and Petersen (2002) follow the same procedure. Since most of the firms in the sample are not publicly owned, investment opportunities are measured through proxies that are not based on the market value of the firms but that have already been used in other studies. Sales was used as a variable, for example, by Hoshi et al. (1991), Van Ees and Garretsen (1994) and Mills et al. (1995), profitability variation was used by Kim and Sorensen (1986), and inventory by Carpenter et al. (1994).
The control variable of ownership structure has a qualitative nature (1 – managers hold 50% or more of the capital stock; 0 – managers hold less than 50% of the capital stock) due to database limitations. The database does not have a history of firms’ shareholders, since one was required to install an annual update to get the list of partners/shareholders and managers in different years. Since the capital participation of partners/shareholders and managers has great temporal variability, and the available information about the owners of the capital in each year does not always refer to the same period of the year, it was decided to construct a more stable artificial variable (dummy) representing only two states.
The value for innovation strategy is based on the proportion of spending on R&D relative to sales (Expenditure on R&D/Sales), as used by Francis and Smith (1995) and O’Brien (2003). It was considered that a company pursues an innovation strategy in a period when the average of annual spending on R&D is equal to or greater than 1% of sales. The choice of diversification or concentration strategy is based on the marketed products, which is similar to the method adopted by Berger and Ofek (1995) and Servaes (1996). It is considered that a diversified company is one that is classified by more than two double-digit NACE codes.
In order to control the effects of ownership structure, strategy, and environment in corporate investment and financing, due to limitations of the database and/or due to the definitions of the variables, some model variables do not vary over time (ownership structure, innovation, diversification and industry dynamism).
3.3 Criteria for Sample Split
The data are split according to the firm’s financial position during the period under review (1998-2005). This method, also used by Fazzari et al. (1988), aims to circumvent the endogeneity problems of the financial position proxy and the selection bias effect (attrition bias) that could result from the classification of the firm’s financial position every year. For the classification of the firm’s financial position, we used two indicators of the firm’s ability to obtain funding in the market that complement each other, equity to permanent financing ratio (equity/permanent financing ) and total debt ratio (total debt/total assets). The importance of debt level in the relationship between cash flow and indebtedness is highlighted by Whited (1992) and Cantor (1990) who state that the intensity of the relationship depends on the debt level of the firm. Depending on the value of the previous indicators, firms are classified into two groups, high financing capacity (HFC) and reduced financing capacity (RFC).
The choice of the equity to permanent financing ratio for the classification of the firm’s financial position is for three reasons. First, long-term bank loans are the main source of external financing for investment in fixed assets for Portuguese firms; secondly, the ratio relates the long-term debt level that a firm can support, from the standpoint of financial equilibrium, with the value of its equity. In turn, equity value is influenced by other sources of financing available to the business, such as, in particular, self-financing and capital increases. Finally, capital structure theories can explain long-term financing options better than short-term ones.
The selection of total debt ratio also stems from three factors: it reveals the total solvency of the company because it incorporates all the debts; it constitutes one of the ratios used in assessing the credit risk of enterprises by financial institutions; and it has been used in previous studies in this area (e.g. Whited, 1992; Mills et al., 1995; Gérard and Verschueren, 2003).
The two groups of firms have different characteristics. The results of the t-test for equality of means in independent samples and the nonparametric Wilcoxon rank-sum test for the equality of medians of the two samples show that, in general, firms in the HFC group show greater liquidity (CF and CASH), investment opportunities (SAL), size (SIZE), profitability and age, and lower asset growth (ASSINV), collateral value (COLL) and indebtedness, than the RFC group firms. For the environment, the HFC group firms tend to belong to the most dynamic industries (INDDYN).
3.4 Model Specification
The analytical method proposed for identifying the moderating role of strategic and environmental factors in the financial constraints of Portuguese manufacturing firms is multiple linear regression for panel data, using a model like this:

where Xit is 1´K and can contain observable variables that change over t but not i, variables that change over i but not t and variables that change over i and t, D represents the impact of time, αi measures unobserved effect (and varies between cases, but is constant in time), and μit is called idiosyncratic error because it varies over i and t.
The choice between carrying out the estimation by the methods of ordinary least squares (OLS), fixed effects or random effects must be made according to the following (Greene, 2003). If αi contains only a constant term (that is, there is an absence of significant individual and time effects), the OLS estimator, applied to all the data, provides consistent and efficient estimates for all parameters. If there are individual or temporal significant effects, it is advisable to use the methods of fixed effects or random effects.
In the present study, non-observable effects from firms/groups are assigned to the industry where each company performs its main activity (according to the NACE two-digit code). The proposed model is as follows:

3.5 Model Estimation
Validation of the estimation method is performed through several statistical tests: Breusch-Pagan/Cook-Weisberg; Wald Modified; Lagrange Multiplier (LM) of Breusch and Pagan; Hausman robust; likelihood-ratio; and Reset of Ramsey.
The heteroscedasticity of the model, identified by the Breusch-Pagan/Cook-Weisberg and Wald Modified tests, is corrected with the Huber/White/Sandwich variance estimator instead of a traditional estimator.
A test for the random effects of firm groups (industries) is carried out with the LM test. The test results suggest that industry effects are not equal to zero, and therefore that the random effects models are better suited than the pooled OLS regression.
The choice of a fixed effects panel model instead of a random effects one is based on the behavior of the unobserved heterogeneity and on the results of the Hausman robust test. It was considered that the effects of unobserved heterogeneity of the firms/industries are correlated with the explanatory variables (e.g. flow and stock of liquidity) due, for example, to differences related to the characteristics of the environment in which companies develop their activities, or to capital depreciation rates. The Hausman robust test also suggests the use of a fixed effects model, rather than a random effects model, given that the null hypothesis of no correlation between the individual effects of industries and regressors is rejected.
The likelihood-ratio checks a one-way and two-way fixed effect model. It consists in testing an industry and time effects model versus an industry effect model. The test has a high significance level and we therefore conclude that the model should consider the two effects.
Note that the model’s interaction terms CF×INNO, CF×DIVER, CF×INDGROW and CF×INDDYN are calculated with the variables CF, INDGROW and INDDYN centered, to remove the impact of multicollinearity and to allow the interpretation of coefficients.
Lastly, a Ramsey test is carried out to check the robustness of the three models for problems such as misspecification. Test results show that all models are specified correctly and that there is no omission of variables.
4. Results
The hypotheses formulated in Section 3.1 are tested through a robust fixed effects regression, for industry and time, with interaction terms.
Hypothesis 1, that innovation strategy reinforces the effect of internal liquidity on assets investment, is not rejected in the total sample and in the HFC group (α =0.05) (Table 2), showing that companies that follow an innovation strategy use internal funds for finance to a greater degree than companies that do not. In the total sample and in the HFC group, innovation strategy increases the dependence of investment relative to cash flows by 0.2254 and 0.3004, respectively.
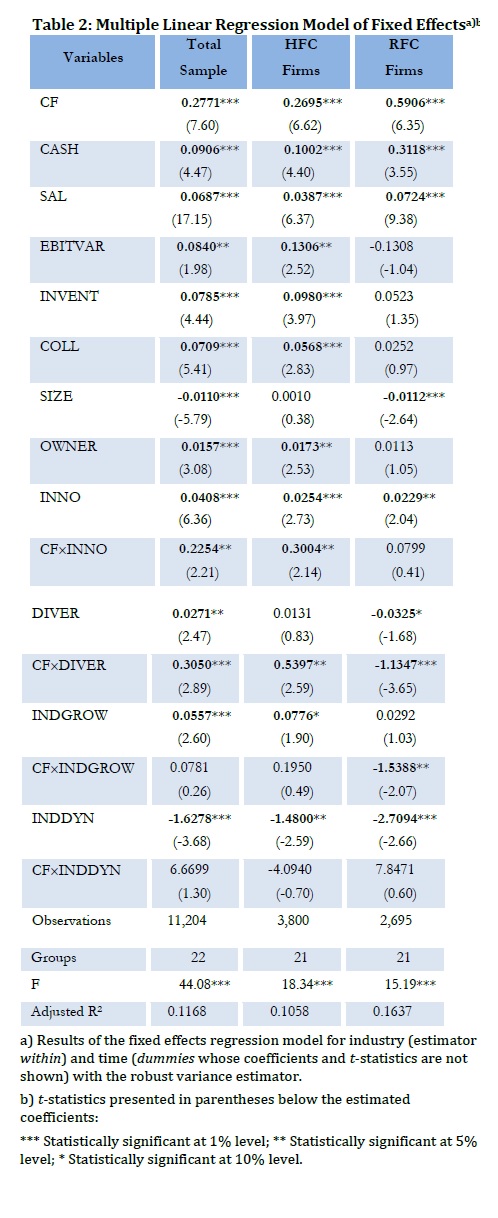
The second hypothesis, that diversification strategy reinforces the effect of internal liquidity on assets investment, is not rejected in the total sample (α =0.01), and in the group of companies where financial constraints are reduced (HFC) (α =0.05), but is rejected in the group of companies in which the financial restrictions are very pronounced (RFC); in this last group there is an inverse relationship (α =0.01). The results obtained in the total sample allow us to state that the investment of companies that follow unrelated diversification is generally more subject to the availability of funds than is the investment of firms that opt for another generic strategy type.
The third hypothesis, that industry growth reduces the strength of the relationship between internal liquidity and assets investment, is not rejected in the group of companies with higher financial constraints (RFC) (α =0.05), which demonstrates that industry growth reduces dependence on investment from internally generated funds in this group of firms. In the total sample and in the HFC group, no statistically significant relationship was observed.
Hypothesis 4, that industry dynamism reinforces the strength of the relationship between internal liquidity and assets investment, is rejected in all groups. Despite the industry dynamism variable having a negative statistically significant sign, it was not possible to establish the moderating effect of industry dynamism in the liquidity/investment relationship.
Note also that in the total sample investment increases with liquidity (measured through the proxies CF and CASH), investment opportunities (SAL, EBITVAR and INVENT), collateral value (COLL), ownership structure (OWNER), strategies for innovation and diversification (INNO and DIVER) and industry growth (INDGROW). Size (SIZE) and industry dynamism (INDDYN) perform the inverse effect on investment in the Portuguese manufacturing industry.
a) Results of the fixed effects regression model for industry (estimator within) and time (dummies whose coefficients and t-statistics are not shown) with the robust variance estimator.
b) t-statistics presented in parentheses below the estimated coefficients:
*** Statistically significant at 1% level; ** Statistically significant at 5% level; * Statistically significant at 10% level.
4. Discussion
The moderating effect of innovation strategy on the dependence of investment relative to cash flows may be due to the fact that these companies invest more (INNO variable has a positive statistically significant coefficient) and choose a financing mix that favors self-financing, in order to minimize the costs of asymmetric information; this would be due to the high unpredictability of their results and the consequent difficulty for the market to recognize investment opportunities in companies pursuing this strategy. Moreover, an innovation strategy is often associated with a reduced collateral value because the key strategic resource is often the knowledge held by employees.
The positive relationship between the variable CF×DIVER and investment, in both the total sample and the HFC group, can be explained by the overinvestment problem described by agency theory, to the extent that investment in a different business of a company with diversification of activities is more dependent on the funds that the company is able to generate than on the existence of investment opportunities in their particular business, leading to a situation of inefficiency. It may also be due to the fact that companies whose activities are concentrated have a higher financing capacity due to a superior financial performance, as suggested by the literature that has linked performance with strategy. For the total sample the overinvestment problem may occur, since a t-test of the means of operating profitability and sales of the two groups of companies (with business diversification and concentration) reveals no statistically significant differences, despite the positive effect that the diversification strategy has on the investment.
The negative relationship observed between the variable CF´DIVER and investment in the RFC group shows that, for firms pursuing a strategy of diversification, investment is less dependent on the availability of internal funds than it is for firms pursuing other strategies. In this group the diversification reduces the dependence on investment with regard to cash flows by 1.1347, suggesting that this strategy leads to a reduction in financial constraints for this group of companies. Companies from the RFC group pursuing a diversification strategy invest less than firms that do not choose this strategy, and they have a higher financing capacity – they have higher sales, size, operational profitability and age(p <0.01), and less indebtedness(p <0.01).
The moderating effect of industry growth in the relationship between cash flows and investment in the RFC group reflects the positive effect of industry growth in borrowing capacity, since the environment increases the likelihood of return on investment. Adverse selection costs relate inversely to investment opportunities, allowing the financing of investment projects through the debt market.
5. Conclusions
Data analysis shows the moderating effect of strategic and environmental factors on the liquidity/investment relationship in the Portuguese manufacturing industry.
At the level of business strategies, innovation and diversification accentuate the dependence of internal liquidity for investment in the total sample and in the group with small restrictions on financing in the market. In the group with high restrictions on financing we cannot detect any moderating role for the innovation strategy, since the variable CF×INNO shows no statistical significance, unlike the diversification strategy variable which reduces the effect of internal liquidity for investment.
At the level of industry environment, the sales growth of the industry mitigates the dependence on internal liquidity for investment for the group of companies with reduced funding capacity. Industry dynamism (sales variability) was not a factor moderating the relationship of liquidity to investment in any of the analyzed groups.
Previous results are justified by financial theory with agency costs, resulting from moral hazard and free cash flows, and adverse selection costs that affect firms unequally, putting more restrictions on financing and investment for some.
References
Agca, S. & Mozumdar, A. (2008). The impact of capital market imperfections on investment-cash flow sensitivity. Journal of Banking and Finance, 32, 207-216. [ Links ]
Alti, A. (2003). How sensitive is investment to cash flow when financing is frictionless?. Journal of Finance, 58, 707-722. [ Links ]
Berger, P. & Ofek, E. (1995). Diversification´s effect on firm value. Journal of Financial Economics, 37, 39-65. [ Links ]
Bernanke, B. & Gertler, M. (1990). Financial fragility and economic performance. Quarterly Journal of Economics, 105, 87-114. [ Links ]
Bettis, R. (1983). Modern financial theory, corporate strategy and public policy: Three conundrums. Academy of Management Review, 8, 406-415. [ Links ]
Bobillo, A., Alonso, P. & Gaite, F. (2002). Internal funds, corporate investment and corporate governance: International evidence. Multinational Business Review, 10(2), 151-162. [ Links ]
Brophy, D. & Shulman, J. (1993). Financial factors which stimulate innovation. Entrepreneurship Theory and Practice, 17(2), 61-75. [ Links ]
Cantor, R. (1990). Effects of leverage on corporate investment and hiring decisions. Federal Reserve Bank of New York Quarterly Review, 15 (2), 31-41. [ Links ]
Carpenter, R., Fazzari, S. & Petersen, B. (1994). Inventory investment, internal-finance fluctuations, and the business cycle. Brookings Papers on Economic Activity, 2, 75-138. [ Links ]
Carpenter, R. & Guariglia, A. (2008). Cash flow, investment, and investment opportunities: New tests using UK panel data. Journal of Banking & Finance, 32, 1894-1906. [ Links ]
Carpenter, R. & Petersen, B. (2002). Is the growth of small firms constrained by internal finance?. Review of Economics and Statistics, 84, 298-309. [ Links ]
Devereux, M. & Schiantarelli, F. (1990). Investment, financial factors, and cash flow: Evidence from U.K. panel data. In G. Hubbard (Ed.), Asymmetric information, corporate finance, and investment (pp. 279-306). Chicago & London: University of Chicago Press. [ Links ]
Fazzari, S., Hubbard, R. & Petersen, B. (1988). Financing constraints and corporate investment. Brookings Papers on Economic Activity, 1, 141-195. [ Links ]
Francis, J. & Smith, A. (1995). Agency costs and innovation: Some empirical evidence. Journal of Accounting and Economics, 19, 383-409. [ Links ]
Gérard, M. & Verschueren, F. (2003). Capital market imperfections and investment: Evidence from Belgian panel data. In P. Butzen & C. Fuss (Eds.), Firm’s investment and finance decisions: Theory and empirical methodology (pp. 59-92). Cheltenham: Edward Elgar. [ Links ]
Gilchrist, S. & Himmelberg, C. (1995). Evidence on the role of cash flow for investment. Journal of Monetary Economics, 36, 541-572. [ Links ]
Greene, W. (2003). Econometric Analysis. New Jersey: Prentice Hall. [ Links ]
Himmelberg, C. & Petersen, B. (1994). R&D and internal finance: A panel study of small firms in high-tech industries. Review of Economics and Statistics, 76, 38-51. [ Links ]
Hoshi, T., Kashyap, A. & Scharfstein, D. (1991). Corporate structure, liquidity, and investment: Evidence from Japanese industrial groups. Quarterly Journal of Economics, 106, 33-60. [ Links ]
Houston, J. & James, C. (2001). Do relationships have limits? Banking relationships, financial constraints, and investment. The Journal of Business, 74, 347-374. [ Links ]
Hovakimian, G. & Titman, S. (2006). Corporate investment with financial constraints: Sensitivity of investment to funds from voluntary asset sales. Journal of Money, Credit, and Banking, 38, 357-374. [ Links ]
Jensen, M. (1986). Agency costs of free cash flow, corporate finance and takeovers. American Economy Review, 76(2), 323-329. [ Links ]
Jensen, M. & Meckling, W. (1976). Theory of the firm: Managerial behavior, agency costs and ownership structure. Journal of Financial Economics, 3, 305-360. [ Links ]
Jordan, J., Lowe, J. & Taylor, P. (1998). Strategy and financial policy in UK small firms. Journal of Business Finance & Accounting, 25, 1-27. [ Links ]
Kaplan, S. & Zingales, L. (1997). Do investment-cash flow sensitivities provide useful measures of financing constraints?. Quarterly Journal of Economics, 112, 169-215. [ Links ]
Kaplan, S. & Zingales, L. (2000). Investment-cash flow sensitivities are not valid measures of financing constraints. Quarterly Journal of Economics, 115, 707-712. [ Links ]
Kim, W. & Sorensen, E. (1986). Evidence of the impact of the agency costs of debt on corporate debt policy. Journal of Financial and Quantitative Analysis, 21, 131-144. [ Links ]
Lamont, O. (1997). Cash flow and investment: Evidence from internal capital markets. Journal of Finance, 52, 83-109. [ Links ]
Lamont, O. & Polk, C. (2002). Does diversification destroy value? Evidence from the industry shocks. Journal of Financial Economics, 63, 51-77. [ Links ]
Lang, L. & Stulz, R. (1994). Tobin’s q, corporate diversification, and firm performance. Journal of Political Economy, 102, 1248-1280. [ Links ]
Lim, E., Das, S. & Das, A. (2009). Diversification strategy, capital structure, and the Asian financial crisis (1997-1998): Evidence from Singapore firms. Strategic Management Journal, 30, 577-594. [ Links ]
Lippitt, J., Miesing, P. & Oliver, B. (1988). Competition and Corporate Capital Investment, Business Forum, 13(1), 22-26. [ Links ]
Menéndez-Alonso, E. (2003). Does diversification strategy matter in explaining capital structure? Some evidence from Spain. Applied Financial Economics, 13, 427-430. [ Links ]
Milliken, F. (1987). Three types of perceived uncertainty about the environment: State, effect, and response uncertainty. Academy of Management Review, 12, 133-143. [ Links ]
Mills, K., Morling, S. & Tease, W. (1995). The influence of financial factors on corporate investment. Australian Economic Review, 28(2), 50-64. [ Links ]
O’brien, J. (2003). The capital structure implications of pursuing a strategy of innovation. Strategic Management Journal, 24, 415-431. [ Links ]
Rajan, R., Servaes, H. & Zingales, L. (2000). The cost of diversity: The diversification discount and inefficient investment. Journal of Finance , 55, 35-80. [ Links ]
Riddiough, T. & Wu, Z. (2009). Financial constraints, liquidity management and investment. Real State Economics, 37, 447-481. [ Links ]
Scharfstein, D. & Stein, J. (2000). The dark side of internal capital markets: Divisional rent-seeking and inefficient investment. Journal of Finance, 55, 2537-2564. [ Links ]
Servaes, H. (1996). The value of diversification during the conglomerate merger wave. Journal of Finance, 51, 1201-1225. [ Links ]
Shin, H. & Stulz, R. (1998). Are internal capital markets efficient?. Quarterly Journal of Economics, 113, 531-552. [ Links ]
Simerly, R. & Li, M. (2000). Environmental dynamism, capital structure and performance: A theoretical integration and an empirical test. Strategic Management Journal, 21, 31-49. [ Links ]
Singh, M. & Faircloth, S. (2005). The impact of corporate debt on long term investment and firm performance. Applied Economics, 37, 875-883. [ Links ]
Stiglitz, J. & Weiss, A. (1981). Credit rationing in markets with imperfect information. American Economic Review, 71(3), 393-410. [ Links ]
Stulz, R. (1990). Managerial discretion and optimal financing policies. Journal of Financial Economics, 26, 3-27. [ Links ]
Van Ees, H. & Garretsen, H. (1994). Liquidity and business investment: Evidence from Dutch panel data. Journal of Macroeconomics, 16, 613-627. [ Links ]
Whited, T. (1992). Debt, liquidity constraints, and corporate investments: Evidence from panel data. Journal of Finance, 47, 1425-1460. [ Links ]
Williamson, O. (1988). Corporate finance and corporate governance. Journal of Finance, 43, 567-591 [ Links ]
Article history
Submitted: 21 June 2012
Accepted: 12 November 2012
