Serviços Personalizados
Journal
Artigo
 Inglês (pdf)
 Artigo em XML
 Referências do artigo
 Enviar este artigo por email
Indicadores
-
 Citado por SciELO
 -
 Acessos
Links relacionados
-
 Similares em
SciELO
Similares em
SciELO
Compartilhar

 Permalink
Tourism & Management Studies
versão impressa ISSN 2182-8458
TMStudies vol.12 no.1 Faro mar. 2016
https://doi.org/10.18089/tms.2016.12104
TOURISM: SCIENTIFIC PAPERS
Applying a probabilistic neural network to hotel bankruptcy prediction
Un modelo de redes neuronales probabilística aplicado a la predicción de la quiebra de hoteles
Manuel Ángel Fernández-Gámez1 , Ana José Cisneros-Ruiz2 , Ángela Callejón-Gil3
1 University of Malaga, Faculty of Economics, Department of Finance and Accounting, 29071 Malaga, Spain. E-mail: mangel@uma.es
2 University of Malaga, Faculty of Economics, Department of Finance and Accounting, 29071 Malaga, Spain. E-mail: ajcisneros@uma.es
3 University of Malaga, Faculty of Economics, Department of Finance and Accounting, 29071 Malaga, Spain. E-mail: amcallejon@uma.es
ABSTRACT
Using a probabilistic neural network and a set of financial and non-financial variables, this study seeks to improve the ability of the existing bankruptcy prediction models in the hotel industry. Our aim is to construct a hotel bankruptcy prediction model that provides high accuracy, using information sufficiently distant from the bankruptcy situation, and which is able to determine the sensitivity of the explanatory variables. Based on a sample of Spanish hotels that went bankrupt between 2005 and 2012, empirical results indicate that using information nearer to bankruptcy (one and two years prior), the most relevant variable is EBITDA to current liabilities, but using information further from bankruptcy (three years prior), return on assets is the best predictor of bankruptcy.
Keywords: Hotel bankruptcy prediction, probabilistic neural networks, bankruptcy variables sensitivity, Spanish hotel industry.
RESUMEN
Con el uso de redes neuronales probabilísticas y un set de variables, financieras y no financieras, este trabajo pretende mejorar la capacidad de predicción de insolvencia que muestran los modelos existentes, para la industria hotelera. Nuestro objetivo es construir un modelo de predicción de quiebra en hoteles que arroje alto grado de acierto, utilizando información anterior al momento en que se produce la quiebra, y que a su vez sea capaz de determinar la sensibilidad de las variables exploratorias. Basado en una muestra de hoteles españoles que quebraron entre 2005 y 2012, los resultados empíricos muestran que usando información cercana al momento de la quiebra (uno o dos años antes), la variable más relevante es la que relaciona EBITDA con el pasivo corriente, pero utilizando información más lejana al momento de la quiebra (tres años antes), la rentabilidad de los activos es la mejor variable predictora de insolvencia.
Palabras clave: Predicción de quiebra en hoteles, redes neuronales probabilísticas, sensibilidad en las variables de quiebra, Industria hotelera española.
1. Introduction
Our research is focused on the hotel industry in Spain and seeks to present a model to enable prediction of bankruptcy. The consequences of bankruptcy are the most important reasons why bankruptcy prediction is studied, in order to improve forecasting and to avoid bankruptcy costs, not only for the firm but also for the stakeholders and the economy of the country in terms of lost tax revenues, income and jobs (Kim & Gu, 2006a).
The interest in this industry is also due to its vulnerability to bankruptcy. The hotel business is highly sensitive to economic cycles (Chen & Yeh, 2012). Previous to the global financial crisis, numerous hotel firms went out of business year after year in many countries around the world. The number of bankruptcies in hotel firms in the USA and China has increased considerably between 2009 and 2010 (Li & Sun, 2012). A similar situation has also been seen in Spain: 526 Spanish hotel firms failed between 2008 and 2012. According to the National Institute of Statistics, between 2007 and 2011, the number of bankruptcies increase on average by 627% (from 35 in 2007 to 188 in 2011). In this scenario, the development of predictive bankruptcy models in the hotel industry is highly important for managers, investors and governments, all of whom are interested in reducing the costs caused by business failure.
Although bankruptcy prediction is a common topic in management and finance literature, very few studies refer to the hospitality industry, and only two have focused exclusively on hotels. Studies on predicting bankruptcy in the hospitality industry have used samples consisting of restaurants and hotels (Gu & Gao, 2000; Kim & Gu, 2006a; Park & Hancer, 2012; Pacheco, 2015) and their results do not coincide, as each yields different predictors, possibly because of the heterogeneity of the samples used.
The only two studies having used a sample exclusively of hotels to build predictive bankruptcy models are those of Youn and Gu (2010b) and Li and Sun (2012). Youn and Gu (2010b) carried out a study using a sample of Korean hotels, building predictive models with logistic regression (Logit) and neural networks (NN) from a set of financial variables. Their findings suggest that Interest Coverage Ratio is the best indicator for predicting hotel bankruptcy, and that NN techniques outperform Logit in accuracy. However, this pioneering contribution has several limitations: First, their conclusions referred to only one year before the bankruptcy situation, which does not allow solutions to be adopted sufficiently in advance. Second, their accuracy rates (77.27% with Logit and 81.82% with NN) are low relative to those obtained for other industries, that is the case of manufacturing companies, whose accuracy rates are over 92% (Callejón, Casado, Fernández & Peláez, 2013). And third, in their sample, insolvent hotels were chosen from among those with a negative net income for three consecutive years, which does not confirm true bankruptcy. Meanwhile, Li and Sun (2012), using a sample of Chinese hotels, applied statistical techniques such as Multivariate Discriminant Analysis (MDA) and Logit, and NN techniques such as Multi-Layer Perceptron (MLP) and Support Vector Machine (SVM). These authors confirmed that NN outperform statistical techniques in predictive accuracy using financial information 2 and 3 years prior to the insolvency of the hotels. Nonetheless, this interesting work was limited to comparing the predictive accuracy of the different methodologies used, without obtaining the sensitivity of the variables in the models constructed. In addition, their sample considered insolvent those hotels with a negative net income for two consecutive years, but did not include hotels that have actually resulted in bankruptcy.
The results of the previous literature on bankruptcy prediction in the hotel industry require a substantial progress. It is here that we find a significant gap in the existing research. Specifically, it is important to know which variables are good predictors of hotel bankruptcy, not just one year in advance, but rather to a broader 2 and 3 years before the bankruptcy period. Moreover, models must be built that combine high accuracy rates with the possibility of ascertaining the explanatory power of the variables in these models, which would allow hotel managers to focus on those variables that are truly important for bankruptcy. Finally, it is also necessary to test whether the inclusion of non-financial variables alongside the traditional set of financial variables improves the accuracy of the models, which would enable the achievement of high accuracy levels, similar to those already obtained in other industries where bankruptcy prediction has been more highly developed.
As a result of the above findings, the aim of this paper is the following: To construct a hotel bankruptcy prediction model with high accuracy, using information distant from the bankruptcy situation, and which is able to determine the sensitivity of the explanatory variables. In order to do this, we selected a sample of 108 Spanish hotels, including hotels that have gone bankrupt as well as solvent hotels in the period 2005-2012. From this sample, financial and non-financial information from 1, 2 and 3 years prior to bankruptcy has been obtained, providing a wide set of variables covering profitability, efficiency and liquidity (financial variables), and in the category of accommodation, the quality offered and the destination zone (non-financial variables). Regarding the methodology used to construct the bankruptcy prediction model, Probabilistic Neural Networks (PNN) has been selected, which is a type of NN that allows us to determine the sensitivity of the explanatory variables. PNN has been used in previous research achieving very high predictive accuracy in different areas such as auditing (Pourheydari, Nezamabadi-pour & Zeinab, 2012; Gaganis & Pasiouras, 2007), some papers related to bankruptcy prediction (Etheridge & Sriram, 1997; Yang, Platt & Platt, 1999), and prediction of stock market values (Cheng, Chen & Fu, 2006; Kim & Chun, 1998). PNN is an alternative NN architecture that combines simplicity, transparency and speed, achieving higher predictive ability in classifying than the traditional statistical models, highlighting the strength of the computational power and the flexibility of NN (Spetch, 1990). Finally, for robust conclusions, results have also been obtained with MLP, as it is the NN technique that obtained the highest accuracy rates in previous research.
The contribution of this paper is to improve the ability of the existing bankruptcy prediction models in the hotel industry, advancing a methodology that combines higher accuracy rates and the optimum selection of explanatory variables. It will also enable analysis of the most significant variables when data from several years before bankruptcy is used. These contributions are needed to minimize the consequences caused by bankruptcy (Gu & Gao, 2000; Kim & Gu, 2006a).
This paper is structured as follows: In addition to this introduction, section two is a review of the literature related to bankruptcy in the hospitality industry, classifying this according to the methodology used and the area where applied. Then, in section three, variables, data and sample are shown; the methodology is shown in section four, and results are stated in section five. Finally, after completing the above, we present the main conclusions.
2. Literature review
Many researchers aiming to predict bankruptcy have raised a wide variety of models based on different methodologies. Initially, MDA was mainly used to predict bankruptcy in the manufacturing industry (Altman, 1968). Later, from the decade of the eighties Logit (Ohlson, 1980; Zavgren, 1985; Theodossiou, 1991; Alici, 1996; Zhang, Hu, Patuwo & Indro, 1999; Cheng et al. 2006; Kim & Gu, 2006a; Kim & Gu, 2006b; Abdullah, Halim, Ahmad & Rus, 2008; Lin, 2009; Zanganeh, Rabiee & Zarei, 2011), Probit (Skosgvki, 1980; Theodossiou, 1991; Hu & Tseng, 2005), NN (Coats & Fant, 1993; Alici, 1996; Sun, Chang & Lee, 1999; Zhang et al. 1999; Atiya, 2001; Hu & Tseng, 2005; Cheng et al. 2006; Lin, 2009; Zanganeh et al. 2011; Callejón et al. 2013) and Genetic algorithms (Shin & Lee, 2002) have also been used. In all previous studies, Logit and NN have a higher predictive accuracy than MDA; NN is even better than Logit.
Most of the studies published, used data one year prior to bankruptcy. There are only a few studies using data two or three years prior to failure: Altman (1968), Diamond (1976), Ohlson (1980), Skogsvki (1980), Coats and Fant (1993), Atiya (2001), Wu, Tzenf, Goo and Fang (2007) and Lin (2009). Results demonstrated that models decrease the ability to predict bankruptcy as the data is used two years in advance, with accuracies of 72.0% (Altman, 1968) and 95.5% (Ohlson, 1980). These results are even lower when prediction is three years in advance, showing accuracy rates of 86.2% (Coats & Fant, 1993); except for the study developed by Wu et al. (2007) who reached 100% using NN and Genetic Algorithm for one, two and three years in advance.
There are very few studies conducted on hospitality bankruptcy prediction, in spite of the high vulnerability that firms suffer in this industry (Gu, 2002).
Olsen, Bellas and Kish (1983) published the first study predicting bankruptcy in the restaurant industry. The sample used the data taken from 7 bankrupt restaurants and another 12 that were solvent. Financial ratios were used; this became its most important advantage for the easy application in real life. The main limitation was defining a model not based on statistical techniques.
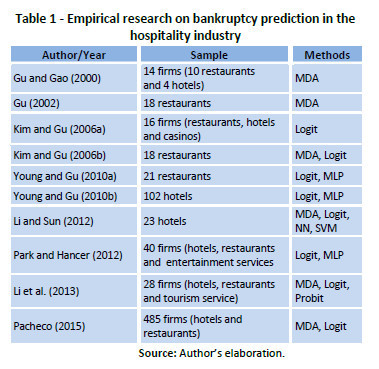
Nine very relevant studies have been developed recently; three of them are focused on restaurants; two on hotels, and the remainder, on different industries, with at least one of them being a hotel or restaurant.
Gu and Gao (2000) published the first study predicting bankruptcy in American hotels and restaurants, using a MDA model. After this work, other studies were done focusing on the way the environment and the financial structure affects business viability.
More sophisticated statistical models, like Logit and NN were published later. Kim and Gu (2006a) were the first to define a Logit model, using a Logit regression for data from 32 firms (restaurants, hotels and casinos), with 16 bankrupt firms and 16 solvent firms. Kim and Gu (2006b) proposed a Logit model using the same restaurant data used by Gu (2002) aiming to compare the predictive ability of Logit with MDA. Results showed that Logit had higher accuracy rates.
Three empirical studies were published later, comparing accuracy rates obtained with Logit and NN. MLP was used for the three papers. The first one (Young & Gu, 2010a) used a sample of 21 bankrupt restaurants and a similar one for solvent restaurants to estimate a prediction model, for one and two years in advance; this was previously done only by Kim and Gu (2006a). After this study, the same authors published another study focused solely on a sample of Korean companies, using Logit and NN models (Young & Gu, 2010b). In this case, results showed that for bankruptcy prediction for the Korean firms, the NN model achieved slightly higher prediction accuracy (83.33% vs 77.27% rate for NN on in-sample firms, and 87.75% vs 81.82% rate for NN on the hold-out sample) but even so, they highlight that Logit may be employed to identify different ways to prevent bankruptcy.
Li and Sun (2012) used a sample of 7 failed hotels matched with 16 solvent hotels operating in the Chinese market. This study compared different methodologies to predict insolvency: MDA, Logit, NN and SVM. Results concluded that NN and SVM had an advantage over the others in prediction accuracy, with rates of 92% and 91%, two and three years prior to failure.
Park and Hancer (2012) aimed to compare the accuracy of NN to that of a Logit model in predicting bankruptcy in the hospitality industry (hotels, restaurants and entertainment services); so the same sample was used for both analyzed data (40 bankruptcies matched with 40 solvent firms). Results show that NN obtained a higher accuracy rate than Logit in an in-sample test; and with a hold-out sample, for verification, both models reached a 100% accuracy rate.
Li, L, Chang and Sun (2013) investigated if random oversampling improves the modeling performance of the default risk prediction of Chinese tourism firms when the available volume of samples is small. In this case, the data reduction method of integrating Isomap and Locally Linear Embenddings (LLE) balanced the tourism data set for default risk prediction and increased the information and ease of use for visualization.
Lastly, Pacheco (2015) use MDA and Logit models in order to ascertain which factors determine a greater probability of default in SMEs Portuguese hotels and restaurants, Results show that financial leverage variables are the best default predictors, with accuracies of 69 %.
3. Variables, sample and data
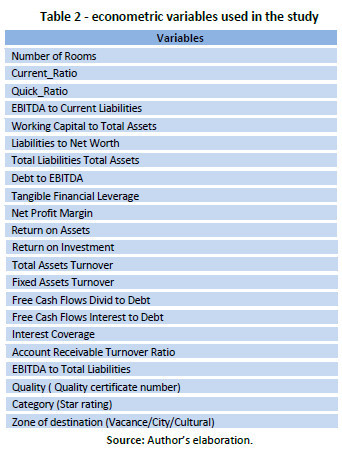
Most published insolvency prediction studies use financial ratios as classifying variables. This study selected a total of 22 explanatory variables as predictors of bankruptcy. Nineteen are quantitative variables (financial ratios) selected from previous studies in the hospitality industry, and they represent liquidity, efficiency, leverage and profitability. Another three non-financial variables have been included in the study to test if higher performance in bankruptcy prediction can be achieved when including the level of quality, the zone of destination and the category of the hotel.
Table 2 shows the econometric variables used in the study. In addition, a categorical variable has been used and it will be the dependent variable to identify the firm as non- bankrupt or bankrupt.
The sample data collection for this paper identified 108 bankrupt and non-bankrupt hotels, whose activity was carried out in Spain between 2005 and 2012. Pursuing conclusions related to bankruptcy prediction that can be extrapolated to other industries, an important methodology and data from a wide and representative sample of bankruptcy firms in the hotel industry have been used.
The definition of firm failure varies from one study to another, depending on the purpose, on the country, or the range of action. In the hospitality industry, firm failure refers to three different concepts: economic failure, technical insolvency, and bankruptcy (Gu, 2002; Young & Gu, 2010a, 2010b). In this paper, the hotels included in the sample have been selected based on the legal status of bankruptcy.
The data used in this study to identify the bankrupt and non-bankrupt firms in the hotel industry was obtained from the National Institute of Statistics (INE), which provides information on the bankruptcy of firms in Spain from 2004. The information given includes 626 hotels and the corresponding financial information for the period 2005-2012. It represents an average of 89.42 firms per year.
After that, the data was studied in order to ensure that it was representative. Fifty four bankrupt hotels were matched with fifty four non-bankrupt hotels. Hotels classified as non-bankrupt hotels were randomly selected among Spanish hotels that held the status of active hotels in 2012. It has been a common practice in bankruptcy prediction research to use a one-to-one match of failure and solvent cases (Gu, 2002). The studys aims required the combination of data from different statistical sources on financial and non-financial variables. The absence of a database of Spanish hotels that combines financial and non-financial variables, such as the star rating or environment quality certificates, led us to construct one from the sources listed below.
The financial variables were obtained from the annual accounts that companies provide to the Commercial Registry Offices. The Registries are official bodies that publish the compulsory accounting statements of Spanish companies. The annual accounts include the main financial data of the firm (balance sheet, profits and losses, and annual reports) for the year under study and meet the accounting standards required by the European Union.
In the case of non-financial variables, the Professional Guide to Spanish Hotels, which provides information on the number of rooms and star rating of all the Spanish establishments, was used as a data source. This rating classifies hotels by category, from 1 to 5, according to different items, mainly services provided at the hotel, the room size, air conditioning or restaurant services among others. The guide is published and updated every year by the Spanish Tourism Institute, which is a body belonging to the Spanish Ministry of Industry, Tourism and Trade.
Finally, data regarding environment quality certificates and hotel group membership were obtained from the corporate information provided by each establishment. Companies with this certificate have been audited to ensure their high quality, safety, professionalism and opinions on the web.
A statistical technique has been used to select the companies from the data; it enables knowing the minimum number of companies that must be selected to guarantee a sampling error less than 2%. Secondly, companies were selected among all Spanish hotels. A study of the sample selected firms whose corporate information offers details of their establishments. Out of a total of 141 firms in the initial sample, only 108 met the information requirement (76.59% of the total).
In addition, and in order to validate the models to be estimated and to test predictive ability, test samples were used that are different and unrelated to those used in estimating the models. Consequently we proceeded to divide the data into two different samples, one used to build the models (training data) and another for testing them (testing data).
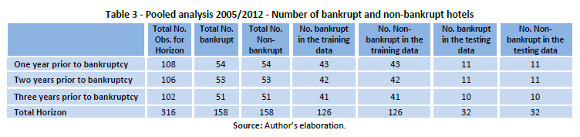
Most of the previous studies related to bankruptcy prediction in the hospitality industry have analyzed one year prior to bankruptcy (Gu & Gao, 2000; Gu, 2002; Kim & Gu, 2006b; Park & Hancer, 2012), and several have analyzed two and three years in advance (Young & Gu, 2010a, Kim & Gu, 2006a; Li & Sun, 2012). In this study, three pools of data have been built for the period 2005-2012. The first one includes the information one year prior to bankruptcy; the second one includes data two years prior to bankruptcy; finally, the third one is based on the financial information three years before bankruptcy. The total number of hotels used for each pool of data is shown in Table 3.
4. Methods and NN architecture
4.1. Multi-Layer Perceptrons (MLP)
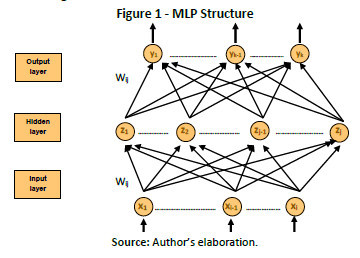
MLP is a feed forward neural network formed by a layer of input data (nodes), an output layer and a certain number of intermediate layers, known as hidden layers in that they do not have any connection with the exterior (Haykin, 2008). These hidden layers make a projection in which patterns of the input layer turns out to be linearly separable, in such a way that allows a correct classification of those patterns in the output layer.
Each input node is connected to the nodes of the second layer, and these, in turn, with those of the third layer, and successively. The objective of the network is to establish a correspondence between the desired entry and output group.
The architecture of MLP networks is characterized by the fact that each output neuron connects in cascade to all of those in the previous layer and does not admit connections between neurons in the same layer (Isasi & Galvan, 2004), as can be seen in Figure 1.
In a given group of pairs of learning patterns {(x1,y1), (x2,y2) (xi,yk)} and one error e (W, X, Y), the training process implies the search of a group of weights (W) that minimize the training error E(W) (Shang & Wah, 1996):
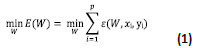
Most analytic models, used to minimize the error, use methods that require the assessment of the local gradient of the function E(W). They are also considered as techniques based on second order derivative (Flórez & Fernández, 2008).
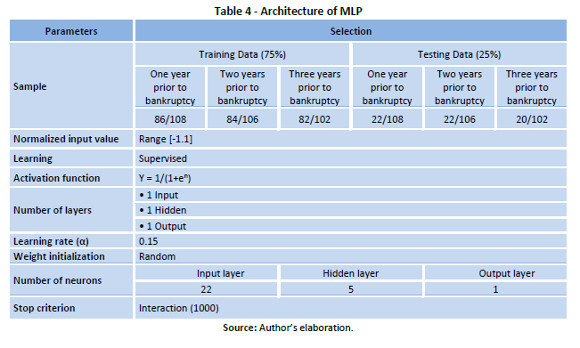
There are several critical points that must be adjusted to complete the implementation of a MLP type network, amongst them, the architecture of the network and the training parameters. In this paper, we took into consideration that the common approach to determine the number of hidden layers in the network is that of trial and error. However, it has been shown that a MLP network, of at least three layers (an input layer, a hidden layer and an output layer) is able to learn complicated non-linear functions (Cybenko, 1989). In addition, a great number of layers complicates the learning of the network. For these reasons, the chosen design has been that of a three-layered MLP network. The number of neurons must be determined for the three layers mentioned above. Therefore, the length of the characteristic vectors or input patterns is measured on the input layer, which in this particular case, corresponds to 22. The output layer is composed of the total number of conditions to be classified or the possible states of the system, which in this paper are two (bankrupt /non-bankrupt).
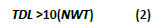
On the other hand, we followed the proposal of Principe, Euliano and Lefebvre (2000) to determine the exact number of neurons in the hidden layer, and that are derived from a mathematical approach (see equation (2)) that relates the total number of weights of the network (NWT) to the total number of training signals of said network (TDL).
The MLP network is entirely interconnected, in other words, all the neurons in each hidden layer are connected to all the neurons in the preceding and following layer. In this sense, the total number of weights (NWT) is directly related to the total number of neurons in each layer. In the case of a three-layered network, the total number of weights is given by the following equation (3).
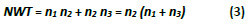
where n1 is the number of neurons in the input layer (layer 1), n2 is the number of neurons in the hidden layer (layer 2), and n3 is the number of neurons in the output layer (layer 3).
In this way, if we have 22 neurons in the input layer (n1) and one neuron in the output layer (n3), we would need to determine the number of neurons in the hidden layer (n2). Replacing equation (3) in equation (2), we get:
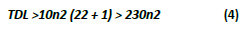
From equation (4), we can deduce that the number of training data restricts the number of neurons in the hidden layer, because a higher amount of training data would be necessary, if we increased the number of neurons in the hidden layer. In relation to the amount of training data, we carried out testing with a group from the sample, taking 75% for training and 25% for testing.
With respect to the training parameters, in this paper we considered the following: first, we normalized the input in a range of [-1,1], as the normalization of input values increases the numeric stability of the internal calculation process of the neuronal network during the training and testing (Yao & Lin, 1997); and second, as regards the type of learning, we chose the supervision form, because we already know the relationship between the existing signals or patterns and the classes to which they belong, so that one output (desired output) corresponds to one training pattern. To this effect, we have taken into account the results of a training using the two functions, hyperbolic tangent sigmoid and logarithmic sigmoid, with 1000 iterations. Finally, the network trained through the tangent function requires more training time than that used by the logarithmic function, as well as that training with the latter yields better results. For that reason, logarithmic function was selected.
Table 4 presents a summary of the training parameters used to analyze company details based on the MLP type network.
4.2 Probabilistic Neural Network (PNN)
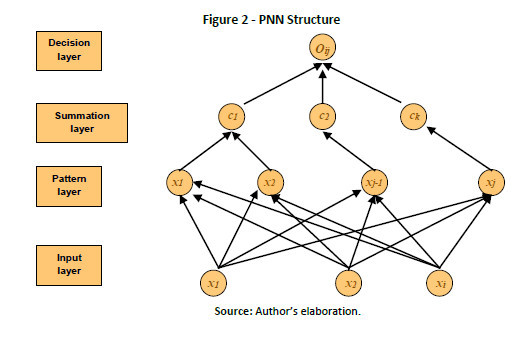
PNN combines the simplicity, transparency and speed of the traditional statistic classification models together with the force of computational power and the flexibility of the neuronal back-propagated network (Spetch, 1990; Ancona, Colla, Rovetta & Zunino, 1997). In the process used for MLP, adjustments of weights are done according to the error shown, but in the process of classification for PNN no adjustment o weights are done, and only outliner patterns are calculated by comparison and calculation of distances. The structure of the PNN is based on four layers. Every single node or neurone of the input layer represents an attribute of the independent variable. The neurons of the input layer do not perform any activation, they simply propagate information they receive from the outside. The entries to the network are completely interconnected with the nodes that form the next layer known as the pattern layer. In said layer each node corresponds to a training pattern. This implies that the input vector xi shall be processed by the nodes of the pattern layer through an activation function, which produces the output generated by the nodes. Next layer in the PNN is the summation layer, whose mission is to evaluate the output generated in the previous layer and produce an output vector with the probabilities. Finally, the decision layer selects the maximum of these probabilities and produces one for this kind, and cero for the rest (Figure 2).
In general, between the input and hidden layer there are no weights, but there is an analogue procedure that calculates the euclidean distance between the input vector and its centroid (point that the activation function focuses on). This procedure results as displayed by equation (5). For its part, the activation function is in charge of calculating the level or state of activation of the neuron depending on the input. It is the main feature of the network and that, which most defines its behavior. The most usual form of the activation function is the exponential.
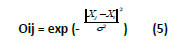
where Oij is the output of the network, Xj is the vector of the j nodes of the pattern layer, Xi is the input vector, and s represents the smoothing parameter, which controls the weight of the activation function.
The result of the activation function shall be within the decimal range [0,1]. As such, when the distance ||Xj – Xi|| increases, the output of the node j, approximates zero, indicating the small similarity between the details of both vectors. In contrast, when the distance ||Xj – Xi|| decreases, the output node j approximates to the unit, indicating the great similarity between the data of each vectors. When Xi is equal to Xj, then the output of the pattern node j shall be exactly, 1. The parameter s controls the weight of the activation function, so that when s approximates 0, any small difference between the Xi and the Xj will make the output Oij approximate 0, whilst the larger values of s shall produce more uniform values.
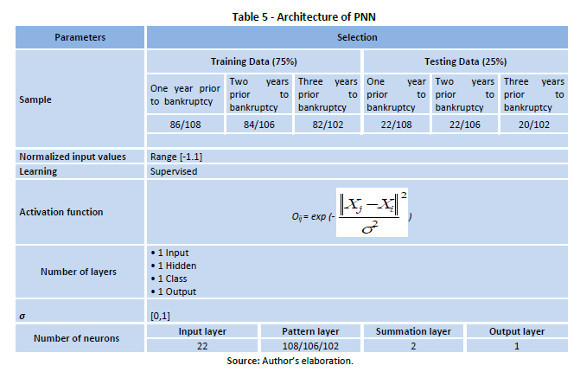
In the PNN case, designed for this paper, and due to the input layer being a projection of the data of the independent variables, said layer was comprised of 22 neurons. The number of training vectors gives the number of neurons in the hidden layer. In this study, the number of neurons in the hidden layer is 108, 106, and 102, that represent training data. At the same time, the number of classes in the summation layer is given by the number of desired results of the network, which in our case, would be two, with and without exceptions. Table 5 is a summary of the parameters used in the training/testing for the structure of the PNN.
4.3 Sensitivity Analysis
The use of PNN enabled us to solve the most important criticisms that have been presented against the use of NN. It concerns understanding the nature of the internal representation generated by the network to solve a certain problem sooner (De Laurentiis & Ravdin, 1994). For this we carried out a sensitivity analysis (Lisboa, Mehridehnavi & Martin, 1994); this allows us to know the importance of every single one of the different variables described in the NN model; that is, the influence that every one of them has on the result.
We have observed and calculated the changes occurred in the output NN model to obtain the sensitivity. First, we establish the value of all the variables and choose the one to calculate its sensitivity. Second, we fix the value of those variables that will not be analyzed and we only oscillate the value of that variable whose sensitivity we want to know. Third, the sensitivity of the variable analyzed (X) will be the sum of the absolute values obtained by subtracting the output value of the NN model from each value of X minus the network output value from the minimum value of X. This process will be repeated for each variable.
The sensitivity has been obtained by the following expression:
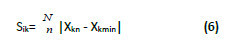
where Sik is the measurement of the sensitivity of the input variable i on the output k, Xkn is the value of the output k obtained from the increase of n in the variable, and XkMin is the value of the output k obtained with the minimum possible input value i.
5. Results
5.1. Exploratory analysis
The exploratory analysis aims to observe the data before building the bankruptcy prediction model. Thereby, the relationships that may exist among the variables can be seen (Tukey, 1997). In this paper, the exploratory analysis follows a descriptive analysis that will allow us to identify the classical statistical parameters.
Table 6 presents the median values of every variable and the results of Wilcoxon-Mann Whitney test, because data do not have a normal distribution. Generally, the values of non-bankrupt hotels are higher, with certain exceptions. Bankrupt hotels are smaller than their non-bankrupt counterparts and have higher levels of debt (measured by the following variables: Liabilities to Net Worth, Total Liabilities to Total Assets, Tangible Financial Leverage). These results are the same for one, two and three years prior to bankruptcy, while for the third year, we highlight the higher values of the following variables: Current ratio, Working Capital to Total Assets and Debt to EBITDA in bankrupt firms, which confirms results obtained in one and two years prior to bankruptcy. The descriptive statistics present higher a priori data for most variables analyzed in non-bankrupt hotels than in bankrupt hotels, and hence a general conclusion obtained from the exploratory analysis is that bankrupt hotels seem to have a smaller size and poorer efficiency, liquidity, cash flow and profitability. Additionally, they have higher levels of debt.
5.2 Comparing NN and PNN results
Table 7 shows the results obtained with MLP and PNN models. With MLP the accuracy rates for the in-sample (training data) are 97.30%, 94.31% and 90.30% for one, two and three year prior to bankruptcy. Testing the model for the out-sample (testing data), the accuracy rates are slightly lower, 94.30%, 91.70% and 90.02%. Comparing the level of prediction for the model studied (MLP and PNN), a higher accuracy rate for MLP is seen. PNN offers a slightly lower accuracy rate, but it allows us to determine the sensitivity of the variables, which may help to reduce the number of variables.
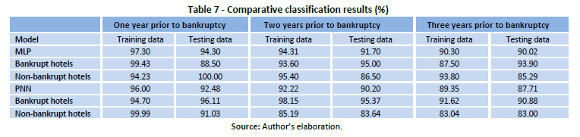
The results of the present study show that those models developed in this paper are able to increase the ability to predict bankruptcy in hotels, compared with previous studies. Using data one year prior to bankruptcy, the prediction accuracy is 94.30%. These results are higher than those published by Young and Gu (2010b), which were 81.82% using NN and 77.27% applying Logit. Our results also show higher accuracy rates three years prior to bankruptcy. In this case, prediction accuracy is over 90%, while the best results shown in previous studies (Li and Sun, 2010) have shown accuracy rates of 87% using NN and 83% using MDA.
The accuracy levels obtained exceed those achieved in previous studies, possibly due to the larger variable set used in this study, which also includes non-financial variables such as Quality, Category and Zone of Destination. Specifically, Quality and Category are variables that have shown sensitivity in the constructed models. The structural differences between the various categories of hotels have also been tested by Fernández and Becerra (2013), who confirm the importance of controlling for the effect of the star-rating category. Additionally, the significance of Quality in the model is compatible with the works of several authors who also confirm the strong relationship between quality and hotel efficiency (Wheelwright, 1981; Fine, 1983; Brown & Ragsdale, 2002).
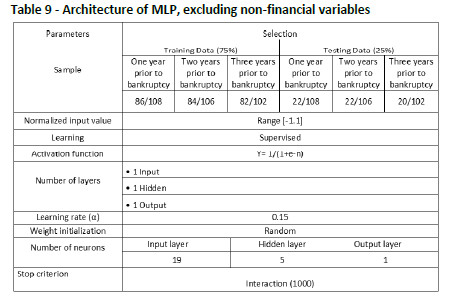
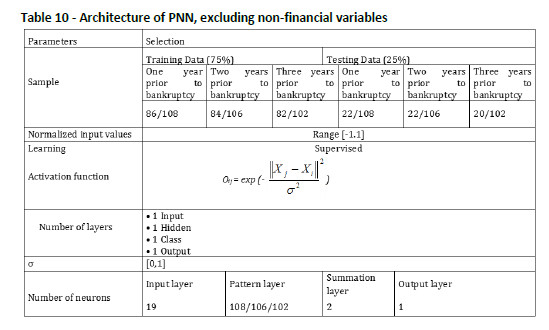
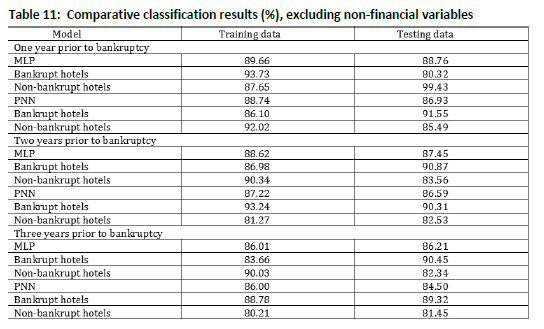
In order to reinforce our hypothesis that the inclusion of non-financial variables increases the ability of predicting bankruptcy models, Tables 9 to 11 are shown in the annex, and no differences are found compared with previous studies developed for different countries and in different temporal contexts (Young & Gu, 2010a; Li & Sun, 2012). In all the cases, accuracy thus is lower when only financial variables are included.
The sensitivity of the input variables for the PNN model is shown in Table 8. One year prior to bankruptcy, EBITDA to Current Liabilities, Net Profit Margin, Liabilities to Net Worth, Total Liabilities to Total Assets, and Accounts Receivable Turnover are the most sensitive variables for the PNN model. Two years in advance, variables that show the highest sensitivity are EBITDA to Current Liabilities, Total Liabilities to Total Assets, Category, Free Cash Flow Divid to Debt, and Net Profit Margin. Finally, three years prior to insolvency, the best variables turned out to be Return on Assets, Free Cash Flow Dividends to Debt, Net Profit Margin, EBITDA to Current Liabilities, and Current Ratio.
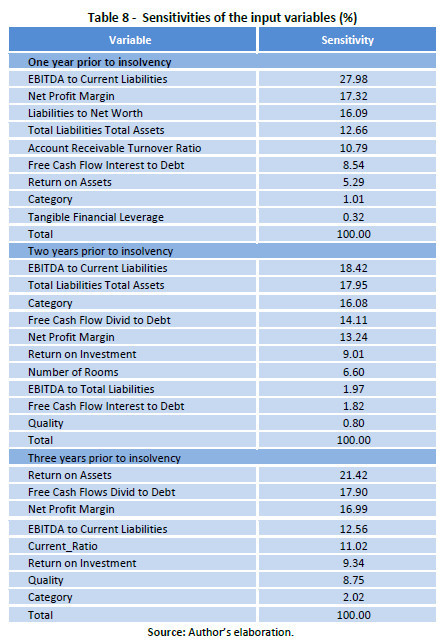
These results on the sensitivity of the variables indicate that using information nearer to insolvency (one and two years earlier), the most important variable is EBITDA to Current Liabilities, but with the information furthest removed (for three years), Return on Assets is the best predictor of insolvency. In this way, it is understood that hotels with a higher probability of failure begin to show signs of alert through a lower rate of profitability (Return on Assets), which subsequently causes the resources generated by the hotel (EBITDA) to be insufficient to handle the volume of debt (Current Liabilities). Furthermore, the variable Net Profit Margin has proved sensitive in all models constructed, becoming another important alert signal. The results have allowed us to verify that the insolvent hotels have a minimal capacity to deal with the current liabilities through the EBITDA obtained, because the EBITDA to Current Liabilities ratio amounted to 0.043; 0.079 and 0.083 for one, two and three years prior to insolvency, respectively. However, solvent hotels often have even higher values of this ratio, with rates consistently exceeding 0.580. Likewise, insolvent hotels have always presented negative values for the variables Net Profit Margin and Return on Assets, which contrasts with the consistently positive values for solvents hotels.
As a solvency signal, Return on Assets measures the ability of the hotel's investments to generate profits. A lower rate of Return on Assets indicates that the hotel is not profitable in its activity, and that Net Profit Margin can also be lower. Given a scenario of absence margins and profitability, it is very difficult for the hotel to generate sufficient resources to meet its payment obligations, thus its rate of EBITDA to Current Liabilities will also be very low. So it is critical to increase the profitability of the hotel's operations.
The results of the present study on the sensitivity of the variables in predicting hotel insolvency are comparable with those of Young and Gu (2010b), the only study to date that has commented on this sensitivity. However, they only partially coincide. As already stated, Young and Gu (2010b) using information from only one financial year before insolvency, detected that the variable Interest Coverage Ratio was the most sensitive in the model. However, in our work, the variable with the greatest impact has proved to be EBITDA to Current Liabilities. The different definitions of insolvent hotels used in this work could possibly explain such differences: Young and Gu (2010b) included as insolvent hotels those with negative net income for three consecutive years, while in our study, insolvent hotels were those that had legally declared bankruptcy.
6. Conclusions
The aim of this paper is to prove that using PNN techniques in the prediction of insolvency in the hotel sector enables identification of the most sensitive variables in those models with the highest accuracy rates. To that end, a sample of 108 Spanish hotels for the period 2005-2012 was studied. From that data, a set of financial and non-financial variables was defined and results obtained from PNN and NN techniques (specifically MLP) with higher accuracy rates were compared.
Results let us conclude that EBITDA to Current Liabilities is the most sensitive variable for the PNN model one and two years prior to insolvency in the hotel industry. With data from three years before bankruptcy, hotel profitability, measured by Return on Assets ratio is the most sensitive variable. The variable Net Profit Margin, although with lower sensitivity, has been significant in all models constructed, becoming another important warning signal. Thus we know that hotels with a higher probability of failure begin to show signs of alert through a lack of profitability, leading subsequently to the revenue generated by the hotel not being sufficient to cover the amount of its debt.
Another conclusion of this study is that the predictive accuracy of the estimated MLP model is higher than that achieved using PNN and provides very similar results for bankrupt and non-bankrupt hotels within the same model (MLP or PNN). PNN enables clarification of the sensitivity of the variables; this might be useful to minimize the number of variables for testing the risk of bankruptcy.
Results confirm a higher power of NN in the development of models to predict bankruptcy in hotels, versus traditional statistical models like Logit or MDA. The prediction of bankruptcy in hotels is a question of classification, and in this specific case, NN offer a higher versatility of use because their use does not depend on the theoretical principles on which statistical techniques are based (multivariate normality of the data, homogeneity of variance-covariance matrices, linearity and absence of multicollinearity). Moreover, NN accept both financial and non-financial variables (Funahashi, 1989). These features transform NN into good general-purpose tools that are flexible and nonlinear; they achieve higher results in comparison with traditional statistical models used in different areas of economic research, where the probability of finding linear rather than nonlinear data is lower, which is required by traditional models (Granger & Teräsvirta, 1993).
In addition to the advantages mentioned above, it is important to highlight the computational cost required in their training, which is higher than that for statistical techniques. Ultimately, it will be the decision of the researcher to choose the use of one type of architecture or another.
Finally, it has also been found that using the non-financial variables of the hotel together with the traditional financial variables can help improve the accuracy levels of bankruptcy prediction models. The category of the establishments and the quality levels offered by them have proved significant in the models constructed.
Future research on bankruptcy prediction in the hotel industry could examine the benefits of using other variables such as information on the intangible assets of the hotel, corporate reputation and intellectual capital. Likewise, we consider that this study about prediction of bankruptcy in hotels was done for the period of the global economic downturn, and this is why it can be considered as a limitation of our conclusions. So for future research, this study can be done for growth economic periods. Last, it would also be interesting to include other non-financial factors in the study, such as the macroeconomic factors, as they do have an impact on the companys financial ratios.
References
Abdullah, N.A.H., Halim, A., Ahmad, H. & Rus, R.M. (2008). Predicting Corporate Failure of Malaysia's listed companies: comparing multiple discriminant analysis, logistic regression and the hazard model. International Research Journal of Finance and Economics, 15, 201-217. [ Links ]
Alici, P.Y. (1996). Neutral networks in corporate failure prediction. The UK experience. In A. P. N. Refenes, Y. Abu-Mostafa, J. Moody & A. Weigend (Eds.). Neural Networks in Financial Engineering (pp. 393-406). Singapore: World Scientific. [ Links ]
Altman, E.I. (1968). Financial ratios, discriminant analysis and the prediction of corporate bankruptcy. Journal of Finance, 23(4), 589-609. DOI: 10.1111/j.1540-6261.1968.tb00843.x [ Links ]
Ancona, F., Colla, A.M., Rovetta, S. & Zunino, R. (1997). Implementing Probabilistic Neural Networks. Neural Computing & Applications, 5(3), 152-159. [ Links ]
Atiya, A.F. (2001). Bankruptcy Prediction for Credit Risk Using Neural Network: A Survey and New Results. IEEE Transactions on Neural Networks, 12(4), 929-935. DOI: 10.1109/72.935101 [ Links ]
Brown, J.R. & Ragsdale, C.T. (2002). The competitive market efficiency of hotel brands: an application of data envelopment analysis. Journal of Hospitality and Tourism Research, 26(4), 260-332. DOI: 10.1177/109634802237483. [ Links ]
Callejón, A.M., Casado, A.M., Fernández, M.A. & Peláez, J.I. (2013). A System of Insolvency Prediction for industrial companies using a financial alternative model with neural networks. International Journal of Computational Intelligence Systems, 6(1), 29-37. [ Links ]
Chen, C.-M., & Yeh, C.-Y. (2012). The causality examination between demand uncertainty and hotel failure: A case study of international tourist hotels in Taiwan. International Journal of Hospitality Management, 31(4), 1045-1049. DOI: 10.1016/j.ijhm.2011.12.011. [ Links ]
Cheng, C., Chen, C.-L. & Fu, C.J. (2006). Financial Distress Prediction by a Radial Basis Function Network with Logit Analysis Learning. Computer and Mathematics with Applications, 51, 579-588. DOI: 10.1016/j.camwa.2005.07.016. [ Links ]
Coats, P.K., Fant, L.F. (1993). Recognizing financial distress patterns using a neural network tool. Financial Management, 22 (3), 142-155. [ Links ]
Article history:
Submitted: 30.04.2015
Received in revised form: 21.10.2015
Accepted: 25.10.2015
Annex