


Serviços Personalizados
Journal
Artigo
 Inglês (pdf)
 Artigo em XML
 Referências do artigo
 Enviar este artigo por email
Indicadores
-
 Citado por SciELO
 -
 Acessos
Links relacionados
-
 Similares em
SciELO
Similares em
SciELO
Compartilhar

 Permalink
Tourism & Management Studies
versão impressa ISSN 2182-8458versão On-line ISSN 2182-8466
TMStudies vol.14 no.Especial Faro 2018
https://doi.org/10.18089/tms.2018.14SI109
HOSPITALITY MANAGEMENT: SCIENTIFIC PAPERS
Neural network analysis for hotel service design in Madrid: the 3Ps methodology and the frontline staff
Análisis de redes neuronales para el diseño del servicio hotelero en Madrid: Metodología de las 3Ps y staff en primera línea
Javier De Esteban Curiel1, Mª Luisa Delgado Jalón2, Sandra Flores Ureba3, José Ángel Rivero Menéndez4
1Rey Juan Carlos University, Paseo de los Artilleros, s/n. Spain, Javier.deestaban@urjc.es
2Rey Juan Carlos University, Spain, marialuisa.delgado@urjc.es
3Rey Juan Carlos University, Spain, sandra.flores@urjc.es
4Rey Juan Carlos University, Spain, joseangel.rivero@urjc.es
ABSTRACT
This paper takes into account a fresh approach to hotel service experience based on the concept of “3Ps Methodology” and “Neural Network Analysis” (NNA). Traditional tools of experience management have been implemented by hotel management in the last decades in order to fulfil the requirements of customer experiences.
A more discriminating distinction is proposed in this research, based on the neural network algorithm (the Multilayer Perceptron) in order to achieve more efficiency. In this sense, Madrid hotels are analysed from the visitor’s perspective for showing the relationships established between front-line employees and customers. A face-to- face survey were conducted in several tourism hotspots in Madrid in order to investigate the hotel frontline service and the emotional experience of customers.
The findings have been treated with statistical procedures and, after carrying out the neural network analysis, we have concluded that the Servicescape model could be classified under the category of “People- processing service”.
Keywords: Front-line employees, neural network analysis, hotels, visitor emotional experience .
RESUMEN
Este artículo aborda un nuevo enfoque en el análisis de las experiencias del servicio en hoteles basado en la “metodología de las 3Ps” y el “análisis mediante redes neuronales” (NNA). Hasta ahora, las herramientas tradicionales de gestión de experiencias han sido aplicadas por la dirección de los hoteles con el fin de cumplir con los requisitos de la experiencia del cliente.
En esta investigación y con el fin de lograr una mayor eficiencia, se propone un enfoque más exigente, basado en el algoritmo de las redes neurales (el perceptrón multicapa). En concreto, se analizan los hoteles de Madrid desde la perspectiva del visitante para mostrar las relaciones que se establecen entre los empleados de primera línea y los clientes. Con el fin de investigar el servicio de hotel en primera línea y la experiencia emocional de los clientes, se llevó a cabo una encuesta cara a cara en varios puntos representativos del turismo en Madrid.
Los resultados fueron procesados estadísticamente y, después de llevar a cabo el análisis de redes neuronales, llegamos a la conclusión de que el modelo Servicescape se podría clasificar en la categoría de "Personas- Proceso del Servicio”.
Palabras clave: Empleados de primera línea, análisis de redes neuronales, hoteles, experiencia emocional de visitante.
1. Introduction
Marketing practitioners could use the service marketing theory, and particularly the 3Ps (Perceptions, Procedures and People) theory as a basis on which to implement relevant strategies so as to enhance their customers’ experience. The delivery of tourism services is particularly dependent on people (in the sense of frontline employees). Indeed, the interaction that takes place between the frontline provider and the customer is fundamental to the service user’s satisfaction. A tourism service is performed in front of the client and is less standardised than the production of goods, signifying that it is subject to variations in quality and requires greater control.
Not everyone is well-suited to being a frontline customer service provider, and customer contact personnel must therefore have the right combination of traits to ensure that the customer has a positive experience. This explains why the frontline employee’s job is both difficult and important, since this person is in charge of expressing and showing the brand’s identity. In fact, s/he is the one directly offering the service to the customer.
In view of the above discussion, the following hypothesis is therefore proposed:
H1: The frontline employees (people) at hotels in Madrid provide a high level visitor emotional experience
The academic reasons for performing this study on the aforementioned 3Ps were that, while seeking information on the subjects being studied, we discovered that there is still a gap in terms of tourism research. The little research that has been carried out on these subjects to date, originates from universities in the US and Asia. European universities would appear to be more focused on the management of experiences improving the service quality dimensions. This model is therefore a fresh new perspective as regards measuring tourist behaviour and the implementation of marketing strategies.
2. Literature Review
2.1 Tourism and hospitality in Madrid: an outlook
Tourism has grown in 2015. According to Turespaña, (2015a) quarterly report for the second quarter of 2015, at aggregate level the turnover tendency for this set of services rose positively by 4.6% in the month of April.
With regard to accommodation services and the activity of travel agents, neither of which had grown in recent years, according to this same report it can be seen that in the month of April there was a growth of 7.2% and 7.6%, respectively. In this same sector it is possible to highlight the activity of restoration which has maintained a more stable behaviour.
The positive growth of this sector is owing to the fact that the number of tourists increased by about 15% in April and May as opposed to 4.9% in the first quarter of 2015 (Turespaña, 2015a).
The increase in the hotel segment in this period is owing to both the arrival of foreign tourists and overnight stays by non- residents.
This upward tendency can also be observed in the month of July in which Spain was visited by 8.8 million foreign tourists, 6.3% more than in the same month of the previous year (Turespaña, 2015b).
With regard to the type of accommodation, non-residential tourists principally opted for hotels, at 58.2% of the total (Turespaña, 2015b), while the remainder opted for types of accommodation that were not hotels. The independent travel organisation (without packages) was, meanwhile, that which underwent an increase as opposed to package holidays, and the mean spending of this collective increased.
Spain’s home-grown tourist population has also increased in the last year and a half, with an inter-annual rate of more than 6% for both hotel accommodation and overnight stays.
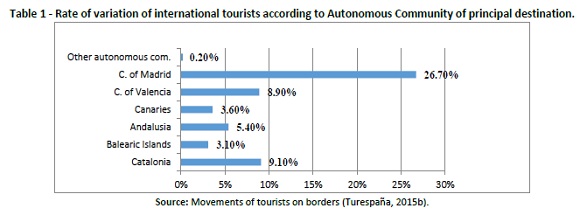
Of the principal autonomous communities as regards tourism, we should highlight the Community of Madrid with an inter- annual rise of 26.71% (with 444,930 non-residential tourists in the month of July), as is shown in Table 1.
Together with the increase in foreign tourists who chose the Community of Madrid as their tourism destination in the first seven months of 2015, we should also highlight the growth of national tourism to that destination. The numbers of both national and foreign tourists who visited Madrid in the first seven months of 2015 are shown in Table 2.
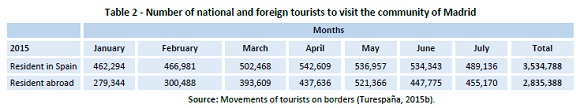
Table 2 shows a general upward trend of both national and foreign tourism in 2015, with a slight decline during the months of May and June. The increase in foreign tourism was principally owing to the arrival of tourists from Asian countries and the United States, with an increase in the latter of 40.5% owing principally to the strong dollar, according to data from Turespaña (2015b). With regard to European countries, there was a reduction in the number of French visitors while the number of Italian visitors increased.
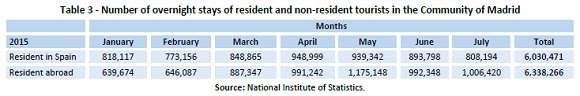
As is indicated in Table 3, this growth was maintained as regards the number of overnight stays of the aforementioned tourists, which increased to 1,814,614 in July, this being 6.57% more than in the July of the previous year (2014) with an average stay of 2 days.
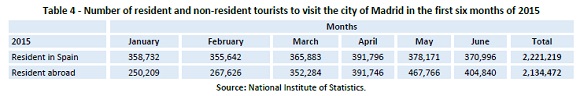
Of the 5,425,870 national and foreign tourists who visited the Community of Madrid between the months of January and June, 80% chose the city of Madrid as their destination. This data is itemised in Table 4.
In addition to the increase in the number of tourists, what also stands out is the growing trend as regards the number of overnight stays in the months analysed, as also occurred in the other places visited in the Community, with the most significant increase taking place in the month of May when a total of 1,735,984 visitors spent an average of two days there.
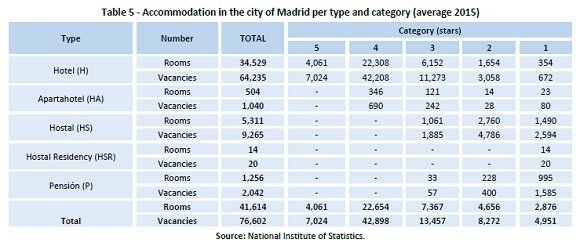
With regard to accommodation in the city of Madrid, Table 5 shows that hotels stand out, the most numerous being those with four stars, representing 65% of the vacancies (42,208 vacancies).
And finally, having analysed the structure of accommodation in Madrid, Table 6 shows the degree to which hotel accommodation was occupied in the aforementioned sector in the first six months of the year.
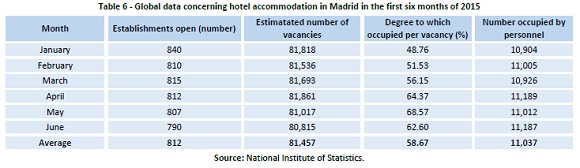
According to the data obtained, the average number of establishments open in the first six months of the year rose to 812, with the number of vacancies estimated as being 81,457 and the occupation of these being almost 60%, most of these occurring in April and May. The number of people employed in this sector in the months analysed was around 11,037, with a clear increase occurring in April.
2.2 What are services?
According to Bitner (2007), services are the combination of processes and experiences that are connected to each other via humans and interpersonal delivery systems, and they must focus on process, delivery and experience innovation. Zeithalm and Bitner (1996) also state that it is important to differentiate between the concept of service as the product of a business and the concept of guest services. The service as a product is generic and can be offered to all kinds of customers, while a guest service implies more knowledge about the guests´ needs.
The main features that distinguish service marketing from industrial marketing are (apart from intangibility and tangibility):
§ Inseparability. This refers to the simultaneous production and consumption of services
§ Heterogeneity. This refers to the potential for high variability in the performance and the quality of services, caused by the interaction between the service employee and the customer
§ Perishability. This refers to the fact that services cannot be saved, stored, resold or returned
According to Vellas and Bechérel (1999) tourism services have several distinctive features that differentiate them from goods, such as:
§ Inseparability. Unlike a product, services are being provided at the same time that they are being produced.
§ Heterogeneity. No matter where or when, tourism services are provided and received by different people at different times, and their perceptions of these services may be completely different. It is a “live” moment.
§ Intangibility. Although there are tangible elements (such as a meal in a restaurant) tourism services also have intangible elements (image, friendliness, etc…).
§ Labour Intensity. Tourism firms know that satisfied customers are synonymous with satisfied and motivated staff, which means that the flashpoint for attaining a good tourism service is highly dependent on the frontline performance.
2.3 What are experiences?
According to Pine and Gilmore’s (1999) theory, the more developed nations overcame the service theory, thus leading to an experience economy and new service design to meet the expectations of customers, who are more and more demanding. In an experience economy, the main idea is to provide the customer with a memorable experience, treat him/her in a personal manner and make his/her perception positive, as experiences create emotional connections that are revealed over time rather than merely at the moment of delivery. Pullman and Gross (2003) state that the experience economy explains the practical and organisational situation of how an experience is delivered to the customer.
Experience within the tourism framework is a temporary set of feelings and experiences that occur at a particular location and is the interaction with all stakeholders and target resources. Experiences could be measured in terms of many dimensions, such as satisfaction, emotions, feelings or happiness, among others.
2.4 What is design?
Burkhardt (1995) explained that the objective of service design is to design services that are useful, usable and desirable from the user perspective, and efficient, effective and different from the provider perspective. It is a strategic approach that helps providers to develop a clear strategic positioning for their service offerings. Service design looks at the experience by focusing on the full customer journey, including the experiences before and after the service encounters. Service design is creative and visual, it goes beyond the given and visualizes and orchestrates solutions that do not yet exist.
According to Kjaer Mansfeldt et al. (2008), there are four meanings of experience and design which explain the different ways in which contact occurs between the customers and the employees.
Meaning 1: “Experience and Design as nouns” could be understood as the most static version of the two variables we are talking about. In this case, we represent an event with some participators in a specific place and time at which the experience takes place.
Meaning 2: “Experience as a noun and Design as a verb” means that we can find an experience that has the same location and time characteristics, depending on the way in which it is seen. Consumers are therefore more important at the moment at which the experience is taking place. They can reshape the whole meaning because the actual network-based interaction is not fully attended to.
Meaning 3: With regard to the third and last part of the model that we are studying, it can be differentiated from the two first parts because the location and time do not limit the subjective experience, as they are less controlled variables.
Meaning 4: This definition explains that the experience is purely individual; it depicts a framework of how the tourist shapes his/her emotional sensations and physical performances through the unfolding of the experience as a process stretching out over time and space.
2.5 Main models for tourism experience design
2.5.1 Destination experience model
The competitiveness of any product or service depends on customer satisfaction, which is determined by the customer’s expectations and the actual experiences with the product delivery process. Tourism is a service-intensive industry which focuses on the customer experiences before, during and after the stay (Stickdorn, 2009).
Communication technologies are a decisive tool as regards allowing customers to obtain information before booking and paying, sharing reviews and comparing prices in real-time.
Tourism products gain the same importance as a tourism destination, and each of the services experienced that is related to a destination affects the image of the destination itself and also its perceived quality (Ritchie and Crouch, 2000).
2.5.2 The assessed customer journey model
The customer experiences a service process consisting of certain touch points (Stickdorn, 2009 and Lane, 2007), and they define which are important and which they do not pay attention to or merely take a glance at.
The customer journey analysis has another benefit for the complex service structure of tourism service products, because it can show specific touch point sequences of customer groups and can deliver additional information.
The touch points of the pre-service period create the customers’ expectations towards a service product, later confirmed or otherwise by the experiences they have with that same product, thus leading to the result of their satisfaction with the whole product.
2.5.3 The co-creation model
Customers have, over the last few years, begun to gain control over products and companies, signifying that these companies must converse with them, Binkhorst (2006). Prahalad and Ramaswamy (2004) state that co-creation between companies and customers is the basis of innovation. According to Binkhorst (2006) companies still innovate their products from the centric point of view. This means that their success will be something coincidental but that later growth will force these companies to start doing market research.
In the tourism area the co-creation experience takes on more relevance because, according to Binkhorst (2006), this experience is the result of the interaction between the individual, the specific place and time within the context of a specific act.
2.5.4 The P-models
The P-model proposed by Lovelock et al. (2009) attempts to manage the value of services. The meaning of value was traditionally connected to the idea of monetary worth, but Ziethalm and Birner (1996) determined that value is different for each guest depending on how they perceive quality, costs, prestige and performance. In this context, Lovelock´s P-model (2009) is designed on the basis of: Process, Perception and People.
2.6 The 3Ps model used to design tourism experiences (applied to this research)
2.6.1 General features of the 3Ps Model and the SERVICESCAPE Model: procedures, perceptions & people
According to Lovelock et al. (2009) the 3Ps model contains the fundamental aspects of Service Marketing. The Service can be structured like a process in which one company develops its product. This means that there are different steps to follow. The Blueprint model shows how to create an efficient service process.
The Service has a place in a real and physical area, which means that the environment is an essential element as regards generating perceptions, feelings and emotions. The Servicescape model is a good tool with which to control these aspects and to create the best feelings according to the service.
Bitner (1992) developed the most complete Servicescape Model, which “describes the complex mix of environmental factors that can influence the internal responses and external behaviors of both customers and employees”. It also traces how managers have to design and control the atmospherics in order to achieve their objectives.
The model exposes the fact that “factors are perceived by customers and employees and that both groups may respond cognitively, emotionally and physiologically to the environment”. Their responses will then determine their behavior in relation to the physical environment and the social interactions between them. (See Figure 1).
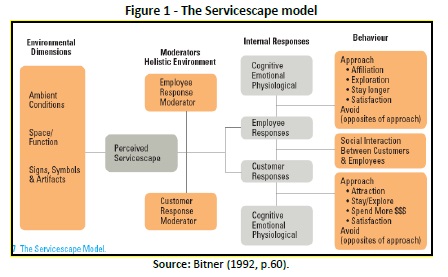
Although the servicescape should be designed for both customers and employees, managers should manage the physical environment to satisfy the needs of those people that spend more time in the service firm, taking into account the already explained types of servicescapes based on the customers’ and employees’ actions.
Bitner’s model is composed of five important factors which, when combined, define the servicescape: Behavior, Internal Responses, Moderators, Holistic Environment and Environmental Dimensions. Each one is explained and detailed according to the model in the following sections.
It should be noted that this research focuses on the performance of the moderator “employee” in terms of friendliness, pro-activeness and efficiency as regards interactions with visitors.
2.7 Tourism and Neural Network Analysis
Neural Network Analysis (NNA) has been used very little as regards studying and predicting the dimension of tourism. Researchers have preferred to use other prediction techniques, such as “Multiple Linear Regression” or “Structural Equation Modelling”, among others. However, some works with NNA have recently been implemented for tourism demand forecasting (Claveria et al. 2015; Berenguer et al. 2015; Cang, 2014) with a high emphasis on econometric purposes. In this respect, these analytical procedures suggest the idea of non-linear models and using the basis of “Multilayer Perceptron” to evaluate the future of tourism demand. It should be noted that NNA has not previously been applied to perception studies of tourism demand as occurs in this research, and the present study therefore provides fresh new insights into the body of tourism knowledge.
3. Methodology
3.1 Techniques applied in this research
3.1.1 Face-to-face survey
A face-to-face survey or, in other words, an interview survey has been implemented so as to gather and analyse the primary data collected for this research paper. According to Creswell (2012, p. 376), a face-to-face survey design is a procedure in
quantitative research in which the researcher surveys a sample of people in order to describe the population’s attitudes, behaviour, opinions or characteristics. A face-to-face survey thus involves the systematic collection of data and places importance on standardisation. Precise samples are selected for this kind of surveying and attempts are made to standardise and eliminate errors from data gathering tools (Gray, 2011). Moreover, Hair et al. (2006) affirm that a face to face survey design has several advantages, such as: the interviewer can explain confusing and complex questions by using visual aids. This helps generate large amounts of feedback from the respondents.
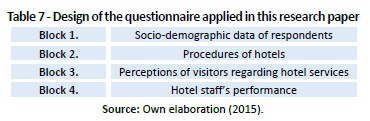
Therefore, 306 face-to-face survey interviews were carried out during this research process. The interviews were conducted on a random basis with respondents in the City of Madrid in the following places: at the entrance to the Prado Museum (102 subjects), at the Adolfo Suarez Barajas Airport (102 subjects) and at the Atocha Railway Station (102 subjects). Every third visitor/ tourist who passed by the entrance/ exit of the station, museum and the international airport was approached. The questionnaire used for this survey was filtered beforehand by means of a pilot pre-test. The questionnaire consisted of a formalised set of questions (see Table 7) with which to obtain information from the survey respondents. The main goal of this questionnaire layout was to translate the researchers´ information needs into a set of specific questions that the respondents would be willing and able to answer.
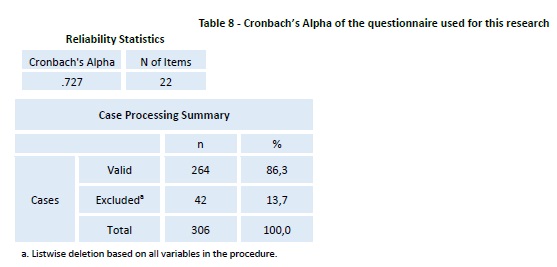
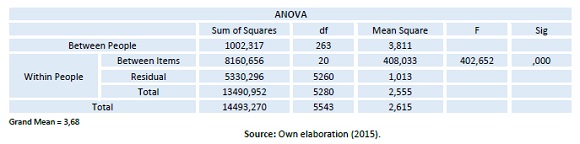
The questionnaire was prepared in two languages: Spanish and English, in order to apply it to both national visitors and foreign tourists. Both versions were pre-tested and swept away accordingly before final field work with a Cronbach’s Alpha of 0.727 (signifying that the reliability of the questionnaire is highly acceptable, see Table 8), and the F-test with statistical significance (<0.001).
In order to fulfil the survey technique, 360 subjects were approached, but 54 of them refused to respond to the questionnaire. Hence, the refusal rate of this survey is 15%. The variables of the questions have been measured using five-point Likert-type scales. The specific details on the field work applied are presented in the Technical Datasheet.
As a final point, the primary data obtained from the survey has been analysed by using the IBM SPSS V.20 quantitative software programme in order to describe the main patterns and identify the main causal relationships between tourists/visitors and hotel services in Madrid as a destination.
3.1.2 Neural Network Analysis for data information
The neural network models were designed to analyse non- linear temporal series, relate past facts with future facts and establish structural relationships between these facts (Shachmurove & Witkowska, 2000). They are also capable of learning, i.e. of identifying whether dependent relationships exist between the facts being analysed. These networks stand out thanks to the following properties (Pérez Ortiz, 2002):
· Non-linearity.
· Adaptability.
· Tolerance to faults.
In practice, there are are two different groups of neural networks:
· Supervised Neural networks: these establish non-lineal connections between certain input data and the desired results and, by means of training using a learning algorithm in a reiterated manner, they modify the weights of each item until they find the set that obtains the results required (García, 2002). The purpose of training or learning is to minimise the number of output errors in each of the layers of the neural network (Trigo & Constanzo, 2007).
· Self-organised Neural Networks: in this case there is no external pattern to indicate whether the network3. is operating correctly or incorrectly, since there is no output objective towards which the neural network should tend (Martín del Brío & Sanz, 2001).
In this study we have used Supervised Neural Networks. In this type of Networks, the perceptron is a learning algorithm that is used to correct errors that minimise the error of the Network, and readjusts the weights in proportion to the difference between the actual output of the Network and that which is desired (Martín del Brío & Sanz, op cit.).
As is shown in Figure 2, we modelled a neural Network with two intermediate layers, each of which had supervise learning, such that the outputs of one layer consisted of the inputs for the next layer. These are MLP-Multi-Layer Perceptron- (Akin, 2015; Alpaydin, 2004). This architecture is trained using a Backpropagation, or BP, algorithm whose purpose is to minimise output errors in each of the layers of the neural NVV Vetwork (Trigo & Constanzo, 2007).
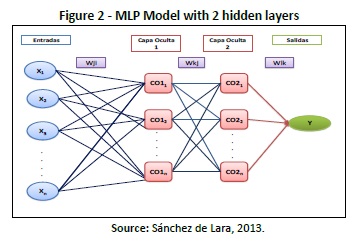
We opted to use two hidden layers, since this is the so-called universal classifier, which is prepared for any type of neural network (Sánchez de Lara, 2013).
Mathematically, an MLP model with two hidden layers would be represented as follows:
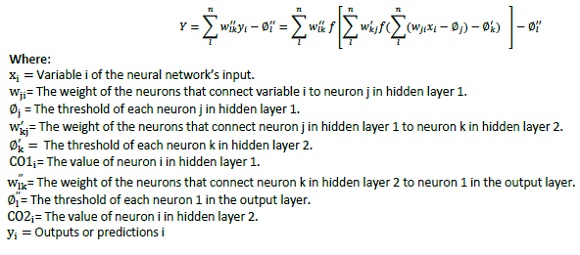
The basic concerns when constructing an MLP model are those of determining the optimal network topology and the duration of training. This is because an over-parameterised and/or overtrained model may overfit the data and lose its ability to generalise unknown data. The optimal network strategy and duration of training can be determined in several different ways (Costa and Markellos, 1997).
Various Works (e.g., Cherkassky, et.al., 1994; Ripley, 1996) have compared the relationship between neural networks and conventional statistical techniques. Neural networks have, in general, proved to have a similar or better capacity for classification that the statistical techniques presented, in addition to having the advantage that they can be used without having to formulate theoretical suppositions about these techniques (Pitarque et al., 2000), and are therefore considered to be free distribution techniques and not parametric. Neural networks are thus more appropriate when the categories are badly defined, the relationships are non-lineal or the data are very noisy’ (Pitarque et al. 2000), i.e. these are a lot of errors in the data.
Upon comparing the statistical methods with neural networks, Karlaftis and Vlhogianni (2011) pointed out that neural networks are superior because of their flexibility when modelling sets of complex data with possible non-linear relationships or from which much data has been lost. In these cases, since they do not have restrictions, neural network models are preferred because of their capacity to predict, which is greater than the explicative power of statistical methods. The same authors recommended the use of neural networks when:
(1) particular emphasis is placed on obtaining good’ predictions rather than on the way in which they are obtained; (2) the original data generation process is unknown and difficult to identify; (3) the idealised assumptions of statistical models (e.g. normality, linearity, seasonality) are not valid, and (4) the results of traditional statistical methods are extremely tedious and difficult to interpret.
According to Martín del Brío and Sanz (2001), thanks to their learning capacity, robustness, non-linearity and tolerance to the imprecision and uncertainty of the environment, neural networks have for years been obtaining excellent results in diverse applications. We can therefore state that neural networks have become a very useful model with which to carry out complex analyses in the economic and financial spheres which would otherwise be difficult to realise. Nevertheless, the use of traditional statistical techniques should not be rejected, but rather made complimentary to that of neural networks.
In an interesting work, Chen (2011) proposed the combination of lineal and non-lineal models in order to improve the precision of predictions. Among the the models combined with ARIMA that he analyses are Support Vector Regression (SVR) models and neural networks (NN) which, when combined, would appear to attain the best predictive results.
3.2 Technical data-sheet
All the steps taken in the methodology used in this research project are shown in table 9.
4. Findings
4.1 Bivariate: Pearson correlations
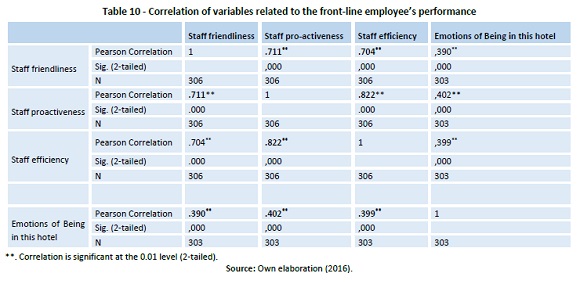
With regard to the Pearson Correlation Analysis, we can highlight that “emotions of being in the hotel” do not really depend on either “staff friendliness”, “staff pro-activeness”, or “staff efficiency” if the analysis of the variables is carried out one-by-one, on an individual basis (see Table 10). None of these three variables reach the cut-off of 0.5 as stated by the statistical literature (0.390; 0.402 and 0.399, respectively).
4.2. Multivariate: Neural Network
As explained above, the Neural Network Analysis is based on a neural network algorithm: the Multilayer Perceptron (MLP). More specifically, the analysis has been carried out as follows:
Dependent variable: Emotions of being in the hotel (DV- Q18) Independent variable:
· Staff friendliness (IV- Q14)
· Staff pro-activeness (IV- Q15)
· Staff efficiency (IV- Q16)
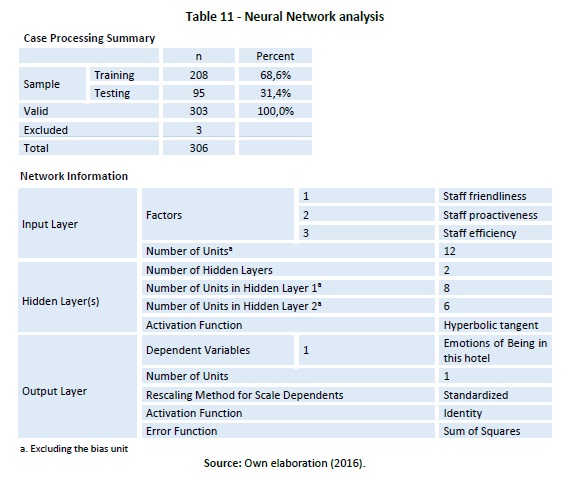
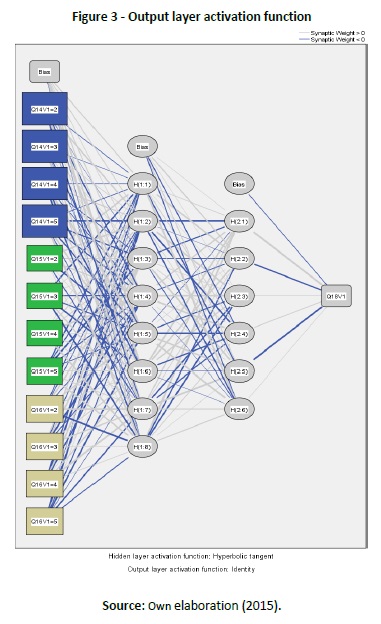
Data Sample Training is highlighted at Table 11 and Figure 3 with an accuracy up to 68.6% for staff friendliness, proactiveness and efficiency.
The relative error is affordable for a Neural Network Analysis as it stands for 35.2% (see Table 12 and Figure 4).
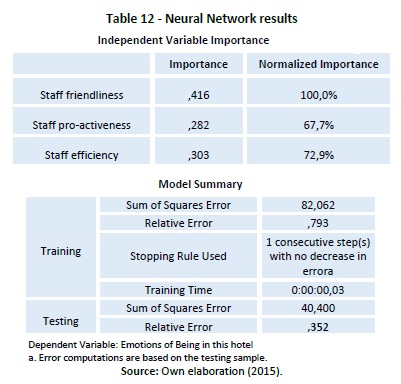
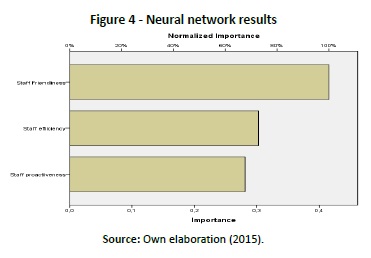
With regard to the set of tables and figures for the Neural Network Analysis shown above and as a “group effect” by combining all the staff features simultaneously, the Neural Graph and the other set of Tables demonstrate that “Emotions of being in the hotel” depends on “staff friendliness” (41,6%), “staff efficiency” (30,3%) and “staff pro-activeness” (28,2%). It is also worth noting that the dependent variable “Emotions of being in a hotel” has been influenced by the “Bias” factor, i.e. other variables from the Bitner Model (Servicescape model) such as ambient conditions, space/function, signs, symbols, artefacts and other customers around the hotel. More in-depth research should be carried out to determine which are the most relevant.
5. Conclusions and recommendations
5.1 Conclusion and recommendations for professionals: hotel marketing practitioners
After carrying out the neural network analysis, we have concluded that the Servicescape model could be classified under the category of “People-processing service” explained by the fact that “emotions of being in the hotel” depends on “staff friendliness”, “staff efficiency” and the “staff pro-activeness”. Therefore, the initial hypothesis H1of this research has been accepted as the contact staff (people) at hotels in Madrid provide a high level visitor emotional experience. Hence, the level of recommendation and therefore, word-of-mouth or e- word-of-mouth (electronic through social networks such as Facebook, Twitter and so on), could be very significant as regards customers communicating the performance of staff at hotels. Each visitor would recommend the event to a friend, which means they would spread their satisfaction with the hotel and talk about the brand itself. This signifies that tourism service delivery involves an intangible action towards the customer in person and the customer is part of the production process when consuming.
In addition, and according to the findings, there are still other impacts that also have a significant influence on the “emotions of being in the hotel” and are grouped into the descriptor “bias effect”. Factors like the music, smells or signs must be analysed in detail because of the prompt effect they have on the purchase decision. Further research must be carried out at individual and group level as to how these factors affect customers’ perceptions of and future reactions to the hotel firm or brand.
5.2 Conclusions for the body of knowledge
The work is an extension to the Servicescape, which is not normally carried out in terms of front-line performance. Moreover, the contribution of this paper as regards the aforementioned Servicescape is that it attempts to fill the gap in terms of tourism research while seeking information about this object of study. To date the small amount research on this subject has originated from universities in the US and Asia. European universities seem more focused on the hotel management of experiences through the improvement of physical surroundings. This model is therefore a fresh new perspective with which to measure tourist behavior and for the implementation of marketing strategies.
6. Limitations and further research
This research has certain acknowledged limitations that should be mentioned when interpreting the findings. First, the research has focused solely on data from hotels in Madrid; comparisons of the findings in other destinations are clearly appropriate. Secondly, the number of variables used to analyze the “Servicescape” (perceptions) in the survey questions were deliberately minimized to avoid respondent bias resulting from tiredness; further research might include additional variables in order to describe the full analysis of the “Servicescape”. Thirdly, the representativeness of this study is relatively limited, owing to the fact that only 306 subjects participated in the research survey; further research should enlarge on the number of respondents for a more analytical refinement from the tourist’s perspective.
REFERENCES
Akın, M. (2015). A novel approach to model selection in tourism demand modeling. Tourism Management, 48, 64-72.
Alpaydın, E. (2004). Introduction to machine learning. Cambridge: The MIT Press.
Berenguer, T.M., Berenguer, J.A.M. & García, M.E.B. (2015) Models of artificial neural networks applied to demand forecasting in nonconsolidated tourist destinations. Methodology. European Journal of Research Methods for the Behavioral and Social Sciences, 11(2), 35- 44. [ Links ]
Binkhorst, E. (2006). The co-creation tourism experience. ESADE. Retrieved 12 July 2016 from http://www.esade.edu/cedit2006/pdfs2006/papers/esther_binkhorst_paper_esade_may_06.pdf [ Links ]
Bitner, M.J. (1992) Servicescapes: The Impact of Physical surroundings on customers and employees. Journal of Marketing, 56, 57-71. [ Links ]
Bitner, M. J. (2007). Service Blueprinting: A Practical Technique for Service Innovation. USA: Arizona State University. [ Links ]
Burkhardt, L. (1995). Design ist unsichtbar. Berlin: Hatje Cantz Verlag. [ Links ]
Cang, S. (2014) A comparative analysis of three types of tourism demand forecasting models: Individual, linear combination and non- linear combination. International Journal of Tourism Research, 16(6), 596-607. [ Links ]
Chen, K.-Y. (2011). Combining linear and nonlinear model in forecasting tourism demand. Expert Systems with Applications, 38(8), 10368- 10376. [ Links ]
Cherkassky, V., Friedman, J. H. & Wechsler, H. (1994). From statistical to neural networks. Springer - Verlag. Berlin.
Claveria, M., Monte, E. & Torra, S. (2015) Tourism demand forecasting with Neural Network Models: Different ways of treating information. International Journal of Tourism Research, 17(5), 492-500. [ Links ]
Costa, Á. & Markellos, R. N. (1997). Evaluating public transport efficiency with neural network models. Transportation Research Part C: Emerging Technologies, 5(5), 301-312. [ Links ]
Creswell, J. (2012). Planning, conducting, and evaluating quantitative and qualitative research, 4th ed. Boston: Pearson Education.
García, P. (2002). Aplicaciones de las redes neuronales en las Finanzas. Documento de Trabajo. Universidad Complutense de Madrid, Facultad de CC. Económicas y Empresariales.
Gray, D. E. (2011). Doing research in the real world, 2nd ed. Hampshire: Ashford Color Press.
Hair, J., Bush, R. & Ortinau, D. (2006). Marketing Research. Within a changing environment,3rd ed. New York: McGraw-Hill. [ Links ]
Instituto de Turismo de España. Turespaña (2015 a). Boletín trimestral de coyuntura turística, II trimestre 2015 (Coyuntur, 2015). Retrieved July 20, 2016 from www.iet.tourspain.es
Instituto de Turismo de España.Turespaña (2015 b). Movimientos turísticos en fronteras. Julio 2015 (Frontur, 2015). Retrieved July 20, 2016 from www.iet.tourspain.es
Instituto Nacional de Estadística (2015). Encuesta de ocupación e infraestructura hotelera. Retrieved July 20, 2016 from www.ine.es [ Links ]
Karlaftis, M. G. & Vlahogianni, E. I. (2011). Statistical methods versus neural networks in transportation research: Differences, similarities and some insights. Transportation Research Part C: Emerging Technologies, 19(3), 387-399. [ Links ]
Kjaer Mansfeldt, O. Vestager, E. M. & Baek Iversen, M. (2008). Experience design in city tourism. Copenhagen: Nordic Innovation Center. [ Links ]
Lane, M. (2007). The Visitor Journey: the new road to success. International Journal of Contemporary Hospitality Management, 19(3), 245-254. [ Links ]
Lovelock C., Wirtz J. & Chew P. (2009). Essentials of Service Marketing. Singapore: Pearson Education. [ Links ]
Martín del Brío, B. & Sanz, A. (2001). Redes neuronales y sistemas borrosos: introducción, teoría y práctica. Ra-ma. Madrid.
Pérez Ortiz, J. A. (2002). Modelos predictivos basados en redes neuronales recurrentes de tiempo discreto. Tesis doctoral. Universidad de Alicante. [ Links ]
Pine, B. J. & Gilmore, J. H. (1999). The Experience Economy. Boston: Harvard Business School Press. [ Links ]
Pitarque, A., Ruiz, J. C. & Roy, J. F. (2000). Las redes neuronales como herramientas estadísticas no paramétricas de clasificación. Psicothema, 12(Suplemento), 459-463. [ Links ]
Prahalad, C. K. & V. Ramaswamy (2004). The Future of Competition: Co- creating Unique Value with Customers. Boston: Harvard Business School Press.
Pullman, M. E. & Gross, M. A. (2003). Welcome to your experience: Where you can check out anytime you'd like but you can never leave. Journal of Business and Management, 9(3), 215-231. [ Links ]
Ripley, B.D. (1996). Pattern Recognition and Neural Networks. Cambridge University Press, Cambridge, G.B.
Ritchie, J. R. B. & Crouch, G. I. (2000). The competitive destination : A sustainable perspective. Tourism Management, 21, 1-7. [ Links ]
Sánchez de Lara, M. (2013). Estudio predictivo de costes y financiación del servicio de transporte urbano colectivo en las empresas españolas mediante la aplicación de redes neuronales artificiales. Tesis doctoral. Universidad Rey Juan Carlos. [ Links ]
Shachmurove, Y. & Witkowska, D. (2000). Utilizing artificial neural network model to predict stock markets. University of Pennsylvania: Center for Analytic Research in Economics and the Social Sciences. [ Links ]
Stickdorn, M. (2009). Service Design in Tourism, in Miettinen S. & Koivisto, M. (eds.), Designing Services with Innovative Methods. Helsinki: Taik Publications. [ Links ]
Trigo, L. & Costanzo, S. (2007). Redes neuronales en la predicción de las fluctuaciones de la economía a partir del movimiento de los mercados de capitales. El Trimestre Económico, 415-440.
Vellas, F. & Bécherel, L. (1999). The International Marketing of Travel and Tourism (A Strategic Approach). Publishing House: Palgrave Macmillan. New York.
Ziethaml, V. & Bitner, M. J. (1996). Services Marketing. New York: McGraw Hill. [ Links ]
Acknowledgements
This research has been carried out in the framework of the following project: “Ayudas a la Actividad de Grupos de Excelencia Investigadora URJC-Banco de Santander”. GRUPO DE EXCELENCIA GARECOM (Grupo de Análisis de Redes Complejas en las Ciencias, la Sociedad y la Tecnología). REF: GI_EXCELENCIA 30VCPIGI11 (GARECOM).
Receiced: 10 January 2017
Revisions required: 12 March 2017
Accepted: 18 July 2017

