


 English (pdf)
 Article in xml format
 Article references
 Send this article by e-mail
 Cited by SciELO
  Similars in
SciELO
Similars in
SciELO 
 Permalink
1. Introduction
With globalization, due to their busy working lives and changing population structures and lifestyles, people no longer cook and eat at home as much as before (Bengül & Güven, 2019). Thus, it is possible to spend more time in food and beverage businesses and to purchase more services from these businesses. As the variety of products offered to customers in restaurants increases, customers are also more likely to have further expectations from the businesses due to such developments. The quality perception of customers regarding the service offered by the business affects their commitment to the business, which causes restaurant companies to pay more attention to the issue of quality (Bengül & Güven, 2019). While the production process proceeds with certain standards in concrete goods-producing enterprises, production in service businesses consists of stages with intensive customer focus and complex structures (Gowan et al., 2001). Therefore, it is extremely important to meet the expectations and satisfaction of customers in service businesses (Parasuraman et al., 1985). Providing quality service in restaurants is very important, as in other service sector businesses (Markovic et al., 2010), because, besides the purposes of fulfilling their physiological needs, people go to restaurants for reasons such as having a good time, having fun, participating in social and cultural activities, or trying different flavours (Doğdubay & Karan, 2015). It is observed that the task of restaurants is not only to meet people’s food and beverage needs, but also to cater to the desires of having a good time, participating in social life, and so on. Increasing competition has led to different expectations among customers (Tuncer, 2017). Businesses based on meeting customer expectations and providing service quality, sincerity, and customer-oriented behaviour continue their existence (Güler, 2007). In this context, it becomes important to determine the quality of the service perceived by the customers in restaurants with their premises and results.
Restaurant businesses, which are competing in a fierce race today, make efforts to satisfy and retain customers with quality service delivery because one of the reasons why some businesses are not able to survive in difficult market conditions is a lack of customer satisfaction and the failure to show the necessary sensitivity to word of mouth (WOM) and electronic WOM (eWOM). It directly affects customer satisfaction in cases of customers recommending the business to others and revisiting the business, the growth of the business, and complaints and the sharing of the experience of the customer (Ladhari et al., 2008).
According to the resources utilized in our literature review, although it has been tested whether the effect of customers in restaurants in general is based on their satisfaction with the services they receive, few studies were encountered on the effect of service quality dimensions on satisfaction, behavioural intention, and eWOM and the role of atmosphere on this effect. Thus, this research was undertaken to fill this gap in the literature. The objectives of this research are: (1) to investigate the effects of restaurants’ service quality dimensions on satisfaction, eWOM, and behavioural intention; (2) to look at the effects of customers’ satisfaction on eWOM and behavioural intention; (3) to test the effect of eWOM on behavioural intention; (4) and to determine the moderator role of restaurant atmosphere in the relationship between the service quality of the restaurants and eWOM. After giving information about restaurants, service quality, restaurant atmosphere, and eWOM, the application section follows. Initially, the quality of service in restaurants was determined by explanatory factor analysis (EFA), and then confirmatory factor analysis (CFA) and second-order CFA were performed and a measurement model and path analysis were applied to test service quality, customer satisfaction, behavioural intention, eWOM, and restaurant atmosphere. Then, in order to test the moderating effect, path analysis was performed with the observed variables. Finally, the research findings, a discussion, and conclusions are presented.
2. Literature review
2.1 Restaurants
With the Industrial Revolution after the second half of the 19th century, a period of urbanization and industrialization began. The increase in the number of working women and a busy pace of life has made it necessary for individuals to spend more time away from home and to eat out more. This has increased the need for restaurants (Scanlon, 1992). Moreover, outside eating activities are undertaken as a different experience than a basic requirement (Johns & Kivela, 2001; Gustafsson et al., 2006; Pettersson & Fjellström, 2007). Therefore, restaurants should always strive to make the experiences of individuals extraordinary. Given that a customer leaving the business unsatisfied will not come back and may spread negative WOM and eWOM, restaurants should pay attention to customers leaving the restaurant in a satisfied way (Hançer, 2003).
When the issue of food and drink, among the basic needs of individuals, is considered, the importance of restaurants is clearly understood (Demirkol, 2004). In this sense, restaurants can directly influence tourists who want to explore local cuisines and can contribute to the promotion of destinations. Restaurant businesses are generally commercial businesses offering service for a certain fee to meet the food and beverage needs of people. In addition to allowing people to meet their food and beverage needs outside of their homes, restaurants are also used for entertainment or social purposes, act as a part of accommodation businesses, or can be established as private businesses (Doğruyol, 2014). By another definition, they are businesses established for profit purposes that offer food and beverage services independent of hotels or in hotels (Akat, 2008). Restaurant businesses, which provide services to meet the needs for food and beverages, have tangibles such as the physical and technical structure, as well as some abstract features such as service quality and atmosphere (Çetiner, 2010). The quality of service is an important point to be considered in these businesses, where processes such as production, storage of products, and presentation of food and beverages should be carried out in a timely manner (Doğdubay & Karan, 2015).
2.2 Service quality
Today, people do not only expect high quality in goods or services, but demand quality improvement in all areas. Quality applies in all public or private sectors. Quality varies according to the expectations and wishes of the customers, the structure of the society, and its development and habits (Bozkurt, 1995).
According to Parasuraman, Zeithaml, and Berry (1988), service quality is the difference between the customer’s expectations of the service and the customer’s perception of the service. Grönroos (1984), on the other hand, claimed that the quality of service, the expectations in the mind of the customer, and the thoughts that occur after the service has been experienced are stages of evaluation. Cronin and Taylor (1992) noted that the most important factor in service quality is customer opinion.
Customers evaluate and interpret many features related to the quality of the service they purchase from their own perspectives. In other words, they compare the expected service with the perceived service. If the expected service is better than the perceived service, the quality does not satisfy the customer. If the perceived service is better than the expected service, it can be said that the service quality satisfies the customer. In summary, if services that meet the expectations are offered to customers, the service quality can be increased (Okumuş & Duygun, 2008).
The most important condition for increasing service quality is to determine the expectations of the customers, since service quality is a process carried out by all employees in the enterprise (Wu & Cheng, 2013). Determining how service quality is perceived by customers is important for ensuring the continuity of businesses in a competitive environment (Grönroos, 1984; Grönroos, 2001). While the quality of service perceived by the customer is effective in purchasing behaviour and customer satisfaction, the customer’s perception of the service affects customer loyalty (Caruana, 2002).
In the rapidly growing and developing service sector, the concept of quality is an important factor for restaurants, as in all businesses that produce services (Markovic et al., 2010). Businesses that produce quality services stand out from their competitors by increasing their market volume, profit potential, and customer loyalty (Zeithaml et al., 1990). While identifying the methods for determining the needs of customers, businesses aim to provide more affordable and higher quality services to their customers than their competitors by focusing on quality (Küçükaltan, 2007).
2.3 Measuring service quality and DINESERV
It is easier to evaluate the quality of goods for concrete products than services. Concrete products, which can be measured by physical methods in certain stages, are checked before they are presented to the customer and can be withheld in the event of a production error (Bateson & Hoffman, 2008). It is difficult to measure the quality of a service due to the difficult understanding of services and the production and consumption occurring at the same time (Diab et al., 2016).
The most important condition for ensuring quality in services is to measure the quality of the service. One of the most frequently used methods for measuring service quality is the SERVQUAL scale developed in 1985 by Parasuraman, Zeithaml, and Berry (1985) to measure service. They stated that the quality of service consists of 10 dimensions in order to determine the service perceived by the customers who purchased it from an enterprise (Parasuraman et al., 1985). Parasuraman, Zeithaml, and Berry (1988) later reassessed those 10 service quality dimensions that they developed as a result of their studies and reduced them to 5 dimensions: tangibles, reliability, responsiveness, reliability, and empathy.
Apart from the SERVQUAL and SERVPERF scales designed for all service businesses, the first scale designed specifically for restaurants was the DINESERV scale. Stevens, Knutson, and Patton (1995) took the SERVQUAL scale as their basis while developing the DINESERV scale in their studies. Service quality consisting of 5 dimensions was later developed by the researchers and DINESERV was created with statements specific to the food and beverage industry. Stevens et al. (1995) argued that the SERVQUAL scale was insufficient in measuring services and they developed the DINESERV scale consisting of 29 variables in order to measure service quality in restaurants (Stevens et al., 1995). This model was developed specifically for the food and beverage sector after the examination and evaluation of the SERVQUAL and LODGSERV scales (Chang et al., 2009). The DINESERV scale is a method used to determine how the quality of service in restaurant enterprises is perceived by customers and it explains what the expectations of the customers are (Stevens et al., 1995). The DINESERV measurement model consists of 29 statements and 5 dimensions (tangibles, reliability, responsiveness, assurance, and empathy), and it is applied in restaurants through a survey. Thanks to the score that the customer gives to the service, the level of expectation is determined (Stevens et al., 1995).
2.4 Electronic word-of-mouth communication
The advent of the Internet has extended the concept of WOM communication to online content known as the electronic word of mouth (eWOM), which is capable of reaching large audiences in a short period of time (Abubakar & Ilkan, 2016). eWOM transformed the more traditional form of WOM communication into a new form of information sharing that can take place via various virtual platforms (Yang, 2013).
eWOM is defined as all informal communications from consumers through Internet-based technology regarding the use or features of certain goods or services or their vendors (Litvin et al., 2008; Jalilvand & Samiei, 2012). By another definition, eWOM communication refers to positive or negative discourses written by consumers for individuals or institutions and published on the Internet about products or services (Hennig-Thurau et al., 2004). In general, eWOM includes comments on product performance, service quality, product impressions, and reliability shared by current or previous consumers (Arroyo & Pandey, 2010). The natural effect of eWOM on consumers’ behavioural intentions may be stronger than that of traditional WOM communication (Eunha & Soocheong, 2011).
Many tourists visit forums and virtual environments on the Internet to determine their choice of restaurants in travel destinations because they believe that evaluations made in virtual environments are useful in their choices. Indeed, Ye et al. (2011) determined that tourists who want to travel for fun and pleasure use the comments of other tourists in virtual environments as a source of information.
2.5 Restaurant Atmosphere
The term “atmosphere” was first used for service establishments by Philip Kotler in 1973. Kotler (2000) defined the concept of atmosphere as “the whole set of factors that shape the perceptions of a customer when he enters a certain place.” In other words, the atmosphere consists of both physical and non-physical elements and also affects those in the service business with its presence (Akkus Karkin, 2009).
The quality of the restaurant atmosphere consists of a multi-dimensional structure. It is affected by the atmosphere of dining places, the comfort of the decor, light, cleanliness, heat, smell, and music. According to Sulek and Hensley (2004), atmospheric elements in restaurants include decor, noise level, temperature, cleanliness, smell, lighting, colour, and music. Lin (2004), on the other hand, included visual signs (colour, light, staff, and design), auditory signs (noise and music), smell, emotional response, and cognitive and behavioural responses as the elements of atmosphere. In this study, the noise, air quality, ambient temperature, smell, and music atmospheres as used by Jani and Han (2014) are discussed.
Atmospheric elements in restaurants play an important role in creating the first impact on customers because customers encounter atmospheric elements before encountering employees (Lin, 2004). These atmospheric elements have effects on both customers and employees (Bitner, 1992). Recent studies conducted in restaurants found that the atmosphere affects customers and staff more than the food itself and is a tool for changing behaviour and attitudes (Heide & Gronhaug, 2009). Customers are exposed to the atmosphere because the product produced in the service sector is consumed where it is produced. This affects their emotions (Ryu & Jang, 2008), their satisfaction and behavioural intentions (Heide & Gronhaug, 2009), and their efficiency and motivation (Bitner, 1992).
It has been determined in the literature that the atmosphere is effective on service quality (Reimer & Kuehn, 2005; Jang & Namkung, 2009), customer satisfaction (Sulek & Hensley, 2004; Lai, 2005; Ryu & Jang, 2008; Heide & Gronhaug, 2009; Lin, 2010), and customer behavioural intention (Weiss et al., 2004; Lai, 2005; Harris & Ezeh, 2008; Ryu & Jang, 2008; Jang & Namkung, 2009; Ha & Jang, 2010).
2.6 General information about Diyarbakır
Diyarbakır, which is one of the oldest settlements in Anatolia, has become the commercial and cultural centre of its region due to its location on trade routes and on the banks of the Tigris River. It has also hosted many different cultures and civilizations. Diyarbakır is located in the north-central part of Mesopotamia and the South-Eastern Anatolia Region of Turkey, with about 2 million inhabitants, and is located between the most important cities in the world.
An important city waiting to be discovered for the local tastes of the southeast and for its historical buildings and settlements, Diyarbakır is also a rich destination in terms of cultural and historical assets. Especially its castle ramparts, which is one of the 15 UNESCO World Heritage list assets located in Turkey, and the Hevsel Gardens are extremely important. The Diyarbakır castle, walls, and bastions were created in line with the needs of the civilizations, cultures, and periods prevailing in the region, and they remain an original and unique source of cultural heritage for world history, maintaining their originality after 7000 years of historical existence. Hevsel Gardens also reveals unique value as an area open to public use throughout its history in a geography where garden culture is very important (General Directorate of Cultural Heritage and Museums, 2015).
Diyarbakır, which is very rich in terms of local cuisine and eating and drinking culture, has 20 restaurants with a business certificate from the Ministry of Culture and Tourism. In addition to the local and foreign tourists coming to the city centre, there are also dozens of local restaurants that provide food, entertainment, and socialization services to local people living in Diyarbakır or visiting the sights from the surrounding cities and towns.
2.7 Development of the hypotheses
In the literature, the perception of service quality of restaurant customers is found to be influenced by many variables such as atmosphere (Markovic et al., 2011), price (Kim et al., 2009), food quality (Soriano, 2002; Barber et al., 2011), and employee relations (Bitner, 1992). In this study, the service quality elements of restaurants are discussed in terms of their tangibles, reliability, empathy, and assurance dimensions created by using the DINESERV scale.
Stevens et al. (1995) stated that restaurant service quality affects customers’ intentions to visit again. According to Soriano (2002), it has been determined that food quality in restaurants is a factor affecting the return of customers to the restaurant. Similarly, Chow et al. (2007) found that there is a relationship between the service quality of restaurants and WOM and customers’ intention to return. Likewise, Zhang et al. (2014) revealed that the taste of the food in restaurants and the restaurant environment affect the WOM intentions of customers. In another study conducted with 201 university students in the United States, it was determined that the service and service quality, fairness of price, and restaurant atmosphere had positive relationships with eWOM (Jeong & Jang, 2011). In another study, Zhang et al. (2010) examined the effects of restaurants’ service quality, atmosphere, and food on customers’ online comments. It was determined that positive eWOM has effects on the popularity of restaurants in online channels. In some studies, it was determined that the quality of service of restaurants has effects on satisfaction and behavioural intentions (Stevens et al., 1995; Yüksel & Yüksel, 2002; Soriano, 2002; Chow et al., 2007; Ha & Jang, 2010; Akinyele, 2010; Nam & Lee, 2011; Diab et al., 2016; Chen, 2016). Based on this body of literature, hypotheses H1, H2, and H3 were created as follows in order to examine the effects of service quality of restaurants on customer satisfaction, eWOM, and behavioural intention:
H1: The restaurant’s service quality has a positive and significant effect on customer satisfaction.
H2: The restaurant’s service quality has a positive and significant effect on eWOM.
H3: The restaurant’s service quality has a positive and significant effect on behavioural intention.
The satisfaction of the restaurant customer is a frequently used concept for customers to return to a restaurant. While there is no guarantee that satisfied customers will visit a restaurant again, a dissatisfied customer is not expected to return to a restaurant (Soriano, 2002). With satisfaction in the product or service given to the customer, the probability of the customer’s intention to spread positive eWOM increases (Yang, 2013; Tsao & Hsieh, 2012). In a study conducted by Jeong and Jang (2011), it was found that positive eWOM shared by customers about the quality of the services offered by restaurants helped the restaurant business, and the experience and quality of the atmosphere as perceived by satisfied customers affected the eWOM significantly. In addition, researchers (Kivela et al., 1999; de Matos & Rossi, 2008; Kim et al., 2009; Liu & Jang, 2009; Serra-Cantallops et al., 2018) determined that the satisfaction of customers going to restaurants has possible effects on their behavioural intentions. Again, in previous studies conducted, WOM (Kim et al., 2009; Ha & Jang, 2010) and eWOM (Tsao & Hsieh, 2012; Lii & Lee, 2012; Serra-Cantallops et al., 2018) were determined to have positive effects on the behavioural intentions of customers. In order to test these findings in the literature, as shown in Figure 1, hypotheses H4, H5, and H6 were created as follows:
H4: The satisfaction of restaurant customers has a positive and significant impact on eWOM.
H5: The satisfaction of restaurant customers has a positive and significant impact on behavioural intention.
H6: The eWOM intention of restaurant customers has a positive and significant impact on behavioural intention.
In a study conducted by Milliman (1986), it was determined that the music broadcast in restaurants increased the amount of orders and the sitting time of the customers. In a study in which restaurant atmosphere was studied in terms of the moderating effect of the music’s tone in relation to age, Harrington et al. (2015) concluded that those aged 40 and above perceived the restaurant atmosphere as better when there was no music, while those aged 39 and below perceived it as better in the case of soft music. Reimer and Kuehn (2005) determined that concrete and abstract elements have an effect on perceived service quality in restaurants. Jang and Nawkung (2009) also noted that customers’ perceptions of atmosphere in a restaurant positively affect service quality perceptions and behavioural trends. The atmosphere is extremely important in hotel businesses and restaurants and has a key role in customer satisfaction (Heide & Gronhaug, 2009). The cleanliness, smell of the restaurant, layout of the restaurant, atmosphere of the staff, and appearance of the staff all affect the loyalty of customers (Harris & Ezeh, 2008). According to Sulek and Hensley (2004), there is a significant relationship between atmosphere elements of restaurants and customer satisfaction and coming back. In light of these results in the literature, hypothesis H7 was created assuming that the restaurant atmosphere will have a positive moderating effect on the effect of the service quality of restaurants on eWOM (Figure 1).
H7: Restaurant atmosphere has a moderating effect on the effect of the service quality of restaurants on eWOM.
3. Methodology
3.1 Questionnaire and measures
In this study based on hypothesis testing, a quantitative approach has been adopted, and the survey technique has been used for data collection. As a result of the literature review, the scales that could best demonstrate the relationship between the variables were determined. A survey form was prepared by making the necessary arrangements and adaptations of the scales. The survey consists of two parts. In the first part, there are statements to determine the demographic findings of the local tourists participating in the study. In the second part, there are statements to determine the service quality dimensions, satisfaction, eWOM, behavioural intention, and atmosphere of the restaurants.
Accordingly, the DINESERV scale developed by Stevens et al. (1995) consisting of 5 dimensions and 29 statements was used to measure the assessments of local tourists coming to Diyarbakır of the service quality dimensions of restaurants. These dimensions included the tangibles of restaurants (10 statements), reliability (5 statements), responsiveness (3 statements), assurance (6 statements), and empathy (5 statements). In addition, statements utilized to determine the satisfaction of local tourists (3 statements) were obtained from the study by Han and Ryu (2012), statements utilized to determine eWOM (5 statements) from the studies by Nadiri et al. (2008) and Uslu and Karabulut (2018), statements utilized to measure behavioural intention (3 statements) from the study by Clemes et al. (2009), and statements utilized to measure the restaurant atmosphere dimension (5 statements) from the study by Jani and Han (2014). A 5-point Likert scale was used in the survey, where 1 = “I definitely disagree” and 5 = “I definitely agree.”
3.2 Population and sample of the research
The population of the research comprises local tourists coming to the luxury restaurants with operating certificates from the Ministry of Culture and Tourism in the city centre of Diyarbakır. The survey created for the research was administered to local tourists visiting the restaurants by random sampling method in August, September, and October of 2019. There are 20 Ministry-certified luxury restaurants operating in the city centre of Diyarbakır. In total, 410 surveys were collected by visiting the restaurants located in the city centre of Diyarbakır by 3 students who knew the purpose of the research, making random face-to-face contact with local tourists. As a result of the examination of the collected surveys, 25 surveys were not included in the research due to reasons such as incompleteness or having been filled out without properly reading the instructions. It was decided that 385 surveys were suitable for use in the testing of the research model. In 2019, considering that the number of local tourists coming to Diyarbakır was 488.729 (Diyarbakır Provincial Directorate of Culture and Tourism, 2019), the number of samples should be at least 384 with a 95% confidence interval of a research population up to 1 million (Cohen, Manion, & Morrison, 2017). Therefore, it can be said that the 385 suitable surveys obtained in this research were sufficient for the sample.
4. Findings
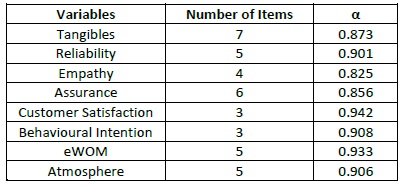
In order to evaluate the research findings, it was necessary to test the lost data, extreme values, homogeneity, and reliability of the raw data obtained from the surveys. When the lost data of the study were analysed, it was observed that the ratio of the items left blank was not more than 15% (Tabachnick & Fidell, 2007) and no data were replaced. Of the extreme values, it was observed that there were no values surpassing the “Z” and “T” scores of +3 and -3. As a result of the homogeneity test, it was decided that the data were homogeneous since the p value was greater than 0.05 (Kalaycı, 2008). A pilot study was carried out with 50 local tourists visiting the Ministry-certified restaurants of Diyarbakır between 1 and 15 July 2019. At first, the number of statements used in the survey was 45 and Cronbach’s alpha value (α=0.945) was found to be highly reliable, and so the study was continued. At last, the number of variables entering the model was 38 and Cronbach’s alpha value (α=0.938) was highly reliable.
According to the 385 samples, Cronbach’s alpha (α) values were examined in order to ensure the structural reliability and validity of the scales used in the research. As observed in Table 1, quality of service as included in the research model (CFA) is the variable with the highest reliability value (α=0.942) among the variables of satisfaction, eWOM, behavioural intention, and atmosphere, and all variables had Cronbach’s alpha values (α) above 0.70, being highly reliable (Byrne, 2010).
4.1 Demographic features of local tourists
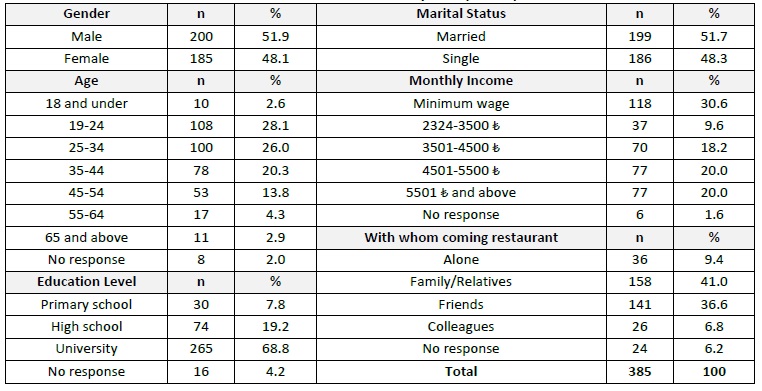
The frequency and percentage distributions of the demographic features of the local tourists surveyed within the scope of this research are shown in Table 2. It was determined that 51.9% (200 people) of the participants were male, 48.1% (185 people) were female, 51.7% (199 people) were married, and 48.3% (185 people) were single. Furthermore, 28.1% (108 people) of the local tourists participating in the research were in the age range of 19-24 years, 26.0% (100 people) were 25-34, and 20.3% (78 people) were 35-44, with the sample mostly consisting of young and middle-aged tourists. When the education levels of the tourists were analysed, it was determined that the majority of them were university graduates at a rate of 68.8% (265 people). Upon examining the monthly income of the participants, it was observed that 30.6% (118 people) received the minimum wage, while 20% (77 people) had incomes between 4501 and 5500 Turkish Lira (₺) or 5501 ₺ and above. Looking at who came to the restaurants, almost half (41.0% = 158 people) of the participants visited with family or relatives and 36.6% (141 people) with friends. Looking at all these results in general, it can be stated that the local tourists visiting the restaurants in Diyarbakır were mostly married and young or middle-aged, with the majority having incomes above 4500 ₺.
4.2 Explanatory factor analyses (EFA)
Initially, explanatory factor analysis was applied to test the construct validity of the scales used in the research. In this context, factor analysis was carried out on the variables of restaurant service quality, customer satisfaction, eWOM, behavioural intention, and restaurant atmosphere via the research scale. Kaiser-Meyer-Olkin (KMO) and Bartlett’s tests were performed to test the suitability for factor analysis. As a result of the EFA, the KMO value was 0.905 and the Bartlett’s test χ2 value was 3989.319 (p<0.000) for service quality dimensions. The KMO value was 0.761 and the Bartlett’s test χ2 value was 976.393 (p<0.000) for customer satisfaction, KMO was 0.881 and Bartlett’s test χ2 value was 1602.087 (p<0.000) for eWOM, KMO was 0.740 and Bartlett’s test χ2 value was 62 for behavioural intention 680.039 (p<0.000), and KMO was 0.822 and Bartlett’s test χ2 value was 950.771 (p<0.000) for restaurant atmosphere. All these results indicate that performing factor analysis is acceptable (Kalaycı, 2008).
As observed in Table 3, the EFA results were first evaluated for the statements of service quality dimensions for the restaurants in the research. As a result of the conducted EFA, the service quality dimensions for the restaurants had a 4-dimensional structure, wherein the eigenvalues of the factors should be at least 1 and the factor loads should be above 0.45. As a result of the analysis, three statements used to measure responsiveness within the restaurant service quality dimensions were loaded and overlapped because they had not been collected in a single dimension. The statements of TAN8, TAN9, and TAN10 belonging to the tangibles dimension were subject to overlapping and were removed from the analysis because they were also collected under different factors. After removing those statements, a 4-factor structure was obtained, which explained 58.268% of the total variance. The factors of tangibles, assurance, empathy, and reliability that emerged as a result of EFA constituted the service quality dimensions in restaurants and factor loadings were between 0.791 and 0.445.
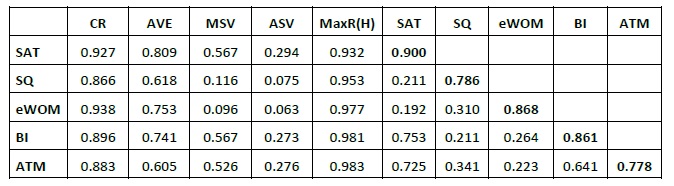
SAT= Customer satisfaction, SQ=Service Quality, eWOM, BI=Behavioural Intention, ATM=Atmosphere, CR= Composite Reliability, AVE= Average Variance Extracted, MSV= Maximum Shared Variance, ASV= Average Shared Variance, Max R(H)= Maximum H Reliability.
Note: Diagonal values written in bold are square roots of AVE values.
As a result of EFA, the statements about customer satisfaction were gathered within a single dimension; the total variance level was 89.276% and factor loads were 0.863, 0.841, and 0.815, respectively. Likewise, it was observed that the statements related to eWOM were gathered within one dimension and the total variance explanation level was 78.897%. The factor loads of the statements that made up this variable were between 0.928 and 0.772. The statements of the behavioural intention variable were determined within a single dimension explaining 82.552% of the total variance and had a factor load between 0.924 and 0.886. The statements related to the restaurant atmosphere were gathered within a single dimension explaining 66.637% of the total variance. The factor loads of the statements that made up these variables were determined to be between 0.888 and 0.757.
4.3 Convergent and discriminant validity
Within the scope of determining the reliability and validity of the study, composite reliability (CR), average variance extracted (AVE), maximum shared variance (MSV), and maximum H reliability (MaxR (H)) values were examined (Table 3). CR values are expected to be 0.70 and above and AVE values are expected to be over 0.50 (Byrne, 2010; Hair et al., 2014). If the AVE value is higher than 0.50, it means that the variables associated with the factors are explained adequately, while a CR value greater than 0.70 means that the internal consistency of the factors is high (Fornell & Larcker, 1981). The facts that the MSV and ASV values are lower than the AVE value, the MaxR (H) value is higher than the CR value, and the square root of the AVE value of the latent variable with other variables is higher than the correlation values mean that discriminant validity is provided (Fornell & Larcker, 1981; Hair et al., 2014).
When Table 3 is examined, it is determined that the lowest AVE value calculated for the latent variables is 0.618 and the lowest CR value calculated is 0.866, and it is understood that this provides the assumptions of convergent validity. Furthermore, the MSV and ASV values of each latent variable entering the model for decomposition validity are smaller than the AVE value, and the MaxR (H) value is higher than the CR value. In addition, it is observed that the correlation values between the square roots of the AVE value and the variables are acceptable, thereby ensuring the discriminant validity for all latent variables. Again, the correlation values among all variables included in the model mean that each of them is less than r>0.85 (Raykov & Marcoulides, 2006), so the dimensions in the model are separate structures and relationships between variables can be researched.
4.4 CFA of Service quality dimensions of restaurants
CFA was also performed to test the construct validity of the scales used (see Table 4). CFA is also known as latent variable analysis and is used in testing causal models with a theoretical basis. A wide range of fit indices can be seen in CFA. For these fit indices, the chi-square fit test (Δχ²≤5) is often used with root mean square error of approximation (RMSEA≤0.080), goodness of fit index (GFI≥0.80), adjusted goodness of fit index (AGFI≥0.80), comparative fit index (CFI≥0.90), and incremental fit index (IFI≥0.90) values as the acceptable goodness of fit values (Schumacker & Lomax, 2010; Wang & Wang, 2012).
Table 4 EFA, CFA and second order CFA values
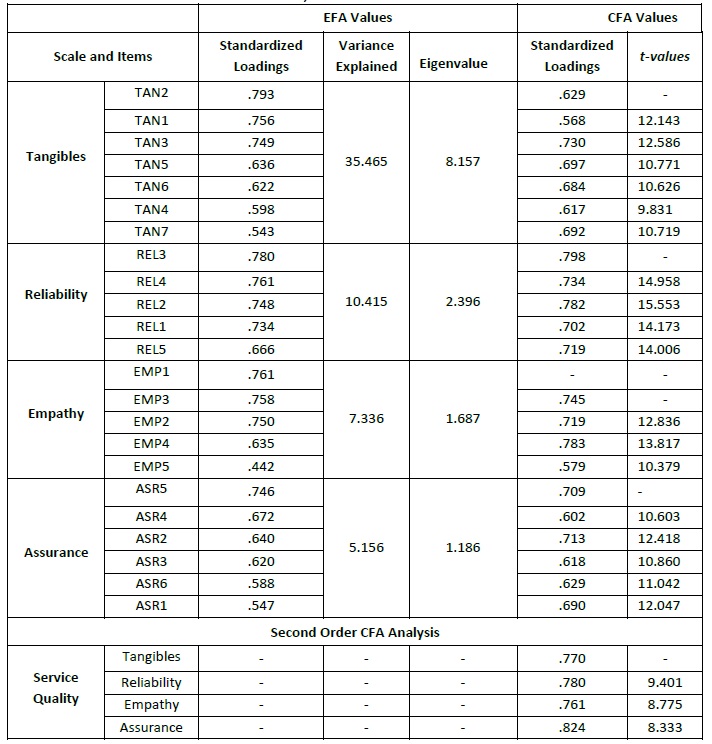
Source: SPSS and AMOS output.
Note 1: Extraction Method = Principal Component Analysis; Rotation Method= Varimax Rotation
Note 2: Goodness-of-fit statistics of CFA: χ2/df=2.522; RMSEA=0.064; CFI=0.916; GFI=0.892; IFI=0.917
Note 3: Goodness-of-fit statistics of second order CFA: χ2/df=2.357; RMSEA=0.060; CFI= 0.934; GFI=0.910; IFI= 0.934.
In this research, EFA was first performed on the service quality dimensions of the restaurants and then it was carried out on the dimensions of customer satisfaction, eWOM, and behavioural intention. CFA was then performed on the service quality dimensions of the restaurants and statement EMP1 was removed from the model due to its low factor loading and lowering the goodness of fit of the model. As a result of the re-analysis, it was determined that the factor loadings of all statements were over 0.50 (Kalaycı, 2008). In order to increase the goodness of fit values in CFA, TAN2 (e1) and TAN1 (e2), TAN2 (e1) and TAN3 (e3), and REL2 (e10) and REL5 (e12) were corrected and goodness of fit values and standardized values were improved. In the final state, the goodness of fit values of CFA were χ2/df=2.522; RMSEA=0.064; CFI=0.916; GFI=0.892; IFI=0.917. These results showed that the CFA had sufficient goodness of fit values (Hair et al., 2014).
In order to reduce the service quality dimensions of the restaurant that would be included in the research to a single dimension (service quality), second-level CFA was conducted. Since the factor loads of statements ASR3 and ASR4 were very low and the modification indexes were high, the model was corrected between ASR2 (e20) and ASR6 (e22) and ASR1 (e23) and ASR6 (e22) in order to increase the goodness of fit. Goodness of fit values of second-level CFA were χ2/df=2.357; RMSEA=0.060; CFI=0.934; GFI=0.910; IFI=0.934. According to these results, the CFA had sufficient goodness of fit values (Hair et al., 2014).
4.5 Measurement model and testing the hypotheses
The relationship between restaurant service quality, customer satisfaction, eWOM, behavioural intention, and restaurant atmosphere used in the research model was examined and it was tested whether the first condition of creating a model had been met. As a result of the measurement model, it was determined that the observed variables were related to the latent variables to which they were linked, and that the relationships between all variables were significant at the level of p<0.05 while the covariance values between the variables were less than 0.85. When the criteria of goodness of fit for all variables related to the measurement model were examined, they were χ2/df=2.303; RMSEA=0.059; CFI=0.913; GFI=0.830; IFI=0.914. These results indicated that the goodness of fit values were sufficient (Hair et al., 2014).
After verification of the measurement models, the relationships between the variables used in the study were tested in the structural model. Within the scope of the structural model analysis, 6 different hypotheses were analysed to determine the effects of service quality on customer satisfaction, eWOM, and behavioural intention; customer satisfaction on eWOM; and behavioural intention again on eWOM’s behavioural intention. In addition, another unique part of the study was tested in order to determine whether atmosphere had a moderating effect on quality of service and its impact on eWOM. The path diagram of the findings obtained as a result of the structural model realized for all of these purposes is indicated in Figure 1.
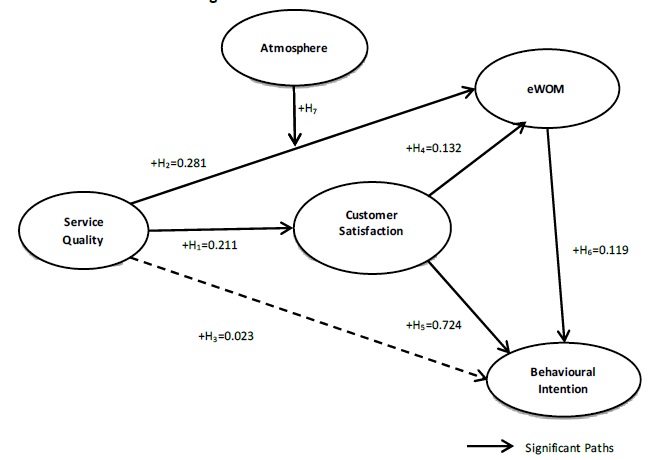
As seen in the path diagram in Figure 1, the service quality of the restaurants has a positive effect on customer satisfaction and eWOM, but not on behavioural intention. It is also understood that customer satisfaction has a positive effect on eWOM and behavioural intention, and eWOM on behavioural intention. Furthermore, it is observed in the model in Figure 2 that the variance explanation rate of the behavioural intention variable is 58.0% (R2=0.58) and that the variance explanation rate for the eWOM variable is 11.0% (R2=0.11).
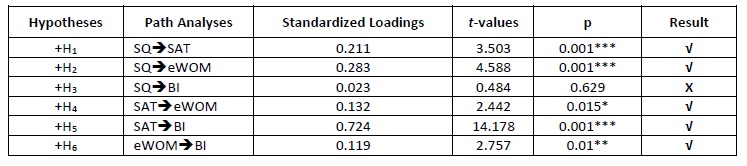
When the t values in Table 5 are examined, it is observed that the t values between the service quality of the restaurants, customer satisfaction and eWOM, customer satisfaction and behavioural intention, and eWOM and behavioural intention are greater than 2.56 and at the significance levels of p<0.001 and p<0.01 (Schumacker & Lomax, 2010), while the t values between customer satisfaction and eWOM are lower than 2.56 and at the significance level of p<0.05 (Schumacker & Lomax, 2010). In the relationship between service quality and behavioural intention variables, t values were found to be lower than 1.96 and not at the significance level of p<0.05 (Schumacker & Lomax, 2010). In addition, when looking at the values of goodness of fit for path analysis regarding the significance of the structural model, it was observed that they were χ2/df=2.282; RMSEA=0.058; CFI=0.925; GFI=0.853; IFI= 0.926. These are acceptable goodness of fit values (Hair et al., 2014).
Table 5 Results of path analyses
Source: AMOS output.
Note 1:***p<0.001, ** p<0.01, * p<0.05, Note 2: Goodness-of-fit statistics of Path Analysis: χ2/df=2.282; RMSEA=0.058; CFI=0.925; GFI=0.853; IFI= 0.926.
When the research model in Figure 1 and the hypothesis results in Table 5 are examined, it is observed that the quality of service of the restaurants as perceived by local tourists has a positive and significant effect on customer satisfaction and eWOM (H1: β=0.211, t=3.503, p=0.001; H2: β=0.283, t=4.588, p=0.001). Therefore, hypotheses H1 and H2, “The restaurant’s service quality has a positive and significant effect on customer satisfaction and eWOM,” were accepted. The service quality perceived by local tourists was not found to have a positive and significant effect on behavioural intention (H3: β=0.023, t=0.484); therefore, hypothesis H3, “The service quality of the restaurants has a positive and significant effect on behavioural intention,” was rejected.
It is observed that customer satisfaction has positive and significant effects on eWOM and behavioural intention (H4: β=0.132, t=2.442, p=0.015; H5: β=0.724, t=14.178, p=0.001). Therefore, hypotheses H4 and H5, “The satisfaction of the restaurant customers has a positive and significant impact on eWOM and behavioural intention,” were accepted. Similarly, a positive and significant effect was found between eWOM and behavioural intention (H6: β=0.119, t=2.757, p=0.01). Hence, hypothesis H6, “eWOM intention of the restaurant customers has a positive and significant impact on behavioural intention,” was accepted. Path analysis was carried out using the AMOS program to test the moderator role of restaurant atmosphere under the influence of eWOM of the restaurant’s service quality (Table 6).
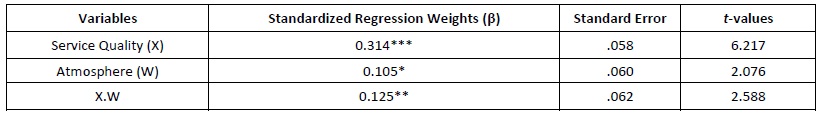
Table 6 Results of moderating effect (n=385)
Source: AMOS output.
Note 1: R2=.136; ***p<0.001, ** p<0.01, * p<0.05, Dependent Variable= eWOM
The maximum likelihood calculation method was used in the path analysis with the observed variables. The results of the path analysis are shown in Table 5. Before the analysis, the values of the forecaster and moderator variables were standardized. It was observed that all the estimation variables included in the path analysis explained approximately 13% of the change in eWOM (R2=0.136). It was further determined that eWOM, service quality (β=0.314, p<0.001), and restaurant atmosphere (β=0.105, p<0.05) have positive and significant effects. The interaction quality (moderating effect) of service quality and restaurant atmosphere variables on eWOM was found to be significant and positive (β=0.125, p<0.01).
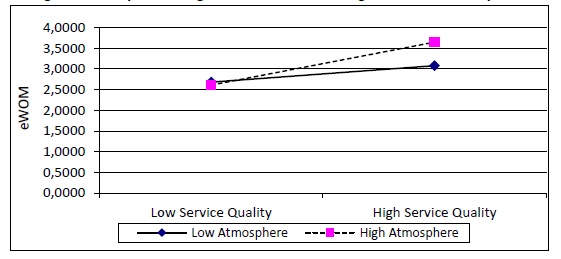
In cases where the quality of service is low and high, in order to determine the form and direction of the effect of the restaurant’s service quality and the interaction of the restaurant atmosphere, the views of the restaurant’s atmosphere as low and high regarding the eWOM are graphically provided in Figure 2.
Source: AMOS output and own elaboration.
Figure 2 Graphical Diagram of the moderating effect the atmosphere
Whether the slopes in Figure 2 differed significantly from the value of zero was analysed by slope test. As a result of the slope test, the relationship between the service quality offered by restaurants and eWOM is significant and positive in both high and low restaurant atmospheres (respectively β=0.50, p<0.001 and β=0.24, p<0.001). Consequently, it was observed that customers who perceive that a restaurant has a high level of atmosphere share more eWOM than customers with a low perception when there is high service quality, and in this case hypothesis H7 is accepted. According to this result, it can be stated that when restaurant managers use the restaurant atmosphere by considering the service quality features, customers may increase their eWOM.
5. Conclusions
Considering today’s increasingly competitive conditions, restaurants have become a mediator in terms of creating important economic development and destination brand images for cities. Cities have to highlight their strengths in order to use their available resources effectively and become important centres of attraction. Diyarbakır is moving towards becoming a gastro city where local food and food culture are highly respected. As a result of the quality of the services provided by the restaurants in Diyarbakır, the satisfaction of the tourists coming to the region will be ensured and local people who are fond of eating will recommend it online and face-to-face to others. In consequence of the facts that the local security situation has improved dramatically in recent years, there are places to see in Diyarbakır, and the number of qualified restaurants is attracting the attention of both local and foreign tourists day by day, this is expected to continue increasingly.
In order to identify the relationship between the quality of service, perceptions of service quality of local tourists visiting Diyarbakır for pleasure, satisfaction and eWOM, and behavioural intentions and also to determine whether restaurant atmosphere has a moderating effect between service quality and eWOM, 7 hypotheses were created based on the literature, 6 of which have been accepted.
While the service quality dimensions of the restaurants are handled in 5 dimensions according to the literature, as a result of the analyses carried out in this study, they were handled in 4 dimensions as tangibles, reliability, empathy, and assurance. CFA and second-level CFA were then performed and their relationships with other variables in the model were measured under the name of service quality. According to the research findings, the service quality perceptions of the restaurants increase customer satisfaction and eWOM. These findings are consistent with many studies including those conducted by Zhang et al. (2010), Jeong and Jang (2011), Zhang et al. (2014), and Uslu and Karabulut (2019). It has been determined that the service quality of a restaurant does not affect the behavioural intention of local tourists. This does not correlate with the findings obtained in the studies by Stevens et al. (1995), Soriano (2002), Akinyele (2010), Diab et al. (2016), and Chen (2016). These results do not reveal local tourists’ satisfaction as a result of the high perceived service quality of restaurants and their behavioural intentions to come back as stated online while increasing their eWOM. Indeed, with this considered, it can be thought that the low probability of local tourists coming to the same restaurant again may be a result of having too many restaurants to choose among in Diyarbakır. Again, as observed in the studies of Bulut and Karabulut (2018), Uslu and Karabulut (2018), and Uslu and Karabulut (2019), it is very likely for satisfied tourists to be happy to recommend a restaurant to others either face-to-face or via online channels even if they are not intent on returning themselves. On the other hand, it should not be forgotten that tourists who have negative experiences in a restaurant have more intentions to spread negative WOM than those who have positive experiences (Susskind, 2002).
Meanwhile, as another finding of this study, it has been determined that the satisfaction of the local tourists coming to the restaurants positively affects the eWOM and behavioural intentions. These results are similar to those obtained in the studies of Kivela et al. (1999), Soriano (2002), de Matos and Ross (2008), Kim et al. (2009), Liu and Jang (2009), Jeong and Jang (2011), and Serra-Cantallops et al. (2018).
5.1 Implications
Apart from the findings of this research that match those in the literature, another important finding that has been revealed is that restaurant atmosphere has a positive moderating effect on the effects of the service quality offered by restaurants on eWOM. As an important area within the tourism sector, restaurants are places where production and consumption occur simultaneously and where personal and face-to-face communication with customers is intense. Therefore, employees of restaurants should always be careful about the quality of the service they provide to their customers. Spaces should be designed professionally by restaurant managers who will make the restaurant’s ambience, smell, comfort, lighting, and table order service quality dimensions be of higher quality.
The quality of the services offered by restaurants and the atmospheres of the products affect the satisfaction and loyalty of the customers. It is also important now that the atmosphere of restaurants (social distancing table layout, food and beverage hygiene and presentation, etc.) be reorganized in a new way to be determined for restaurants in light of the uncertainties caused by the Coronavirus (Covid-19) epidemic that emerged in China in December 2019 and affected the whole world.
5.2 Limitations and future research
As with any research, this research has some limitations, of which the most important is the sampling method. In future studies, using the quota sampling method, the characteristics of the sample can be grouped in more detail and analysed. This research was also geographically limited to the city of Diyarbakır, Turkey. It was carried out in the Ministry-certified luxury restaurants operating in the city centre of Diyarbakır in August, September, and October 2019. In addition, in this study, a model specific to Diyarbakır’s restaurants was created with the data collected in Diyarbakır. In future studies, research can be compared at luxury restaurants and hotels in other destinations.

