


 English (pdf)
 Article in xml format
 Article references
 Send this article by e-mail
 Cited by SciELO
  Similars in
SciELO
Similars in
SciELO 
 Permalink
1. Introduction
The concept of qualification emphasized by different disciplines refers, in the studies in which it is discussed, to the characteristics of an individual such as educational status, knowledge, skills, experience, and talents. When these attributes either exceed or fail to meet job qualifications, it is regarded as a quality mismatch (Erdogan, Bauer, Peiró & Truxillo, 2011; Bickes, Yilmaz, Samur & Demirtas, 2020). Although quality mismatch does not have a perfect equivalent in Turkish, an individual’s having more qualifications than is required by the position can be defined as “overqualification,” while having fewer qualifications than is required by the position can be regarded as “underqualification” (Ünsal Akbıyık, 2016).
In the related literature, the concept of overqualification has generally been considered to be a negative phenomenon (Erdogan et al., 2011). In many studies it is reported that the concept of overqualification negatively affects job-related attitudes and behaviors (Johnson, Morrow, & Johnson, 2002:439; Maynard, Joseph, & Maynard, 2006:549). In addition, it is observed that the concept of overqualification has a negative impact on job performance (Ünsal Akbıyık, 2016). Fine and Nevo (2008), on the other hand, concluded that overqualified individuals have at least moderate levels of job performance. In the studies examined, no study addressing these two variables on chefs has been encountered. The studies examining overqualification and employee performance have concluded a positive correlation between the variables (Fine and Nevo, 2008), whereas some studies have revealed that the correlation between the two variables is negative (Ünsal Akbıyık, 2016). Özdevecioğlu, Kaya, and Dedeoğlu (2015:8) concluded that perceived overqualification negatively affects employee performance. In the literature, it is possible to find studies dealing with two concepts from different aspects. Howewer there is no studies were found which are examining these variables for chefs. For this reason, the purpose of this study is to reveal the effect of perceived overqualification on employee performance. As it was thought that this research would fill the gaps in this field, the study was deemed worthwhile.
Various factors such as continuous technological changes and developments, along with globalization in the business world and the increasing trend of population rates, has led to certain changes in the labor market (Güneren & Karakuş, 2015). An individual who believes that he/she is more qualified than required by his/her current job either becomes unemployed or maintains his/her job with fear of being unemployed. Due to various reasons such as economic or family-related concerns, he/she agrees to be employed for a position that requires a lower educational level and less work experience and skills than he/she has. In such cases where individuals have to work at a position that requires less skill or experience than they have, the research shows that these employees have higher turnover intentions and lower levels of organizational commitment (Akın and Ulukök, 2016). Presently, businesses wish to work with more qualified employees with higher performance. Therefore, the effect of perceived overqualification on employee performance will be discussed in the current study.
Nevşehir is a village that was known as Muşkara during the Ottoman period. In the 18th century, the name was changed to “Nevşehir,” which means “new city” in Persian. This city, also known as the land of beautiful horses, was an important retreat and shelter for the Christian world and escaped Roman pressure after the Hittites. For this reason, there are many important museums and historical sites in the region according to the history of Doğan and Karakuş (2014), and it is among the regions that Christians visit during pilgrimages. At the same time, this region is also the center of the fairy chimneys formed by the effects of the Erciyes, Melendiz, and Hasan mountains. Göreme Natural and Historical National Park, which is among the regions where fairy chimneys are most intense, is included on the UNESCO World Natural and Cultural Heritage list. The region, with its unique appeal, is rare in the world. Nevsehir is a city that does not have advanced job opportunities in industry; however, it is among the most important tourism centers in Turkey. Therefore, tourism activities are given importance in the region. The dry cream, wine, pumpkin seeds, pottery, and ceramics of the Kaymaklı region (which is a town of the Nevşehir region) are noteworthy as tourist products. In this region, there is hot air ballooning, trekking, mountain biking, horseback safaris, ATV trips, church visits, vintage events, etc., available as tourist activities (Tanıtma Genel Müdürlüğü, 2020). According to the 2019 data, there are 111 accommodation enterprises with tourism operation certificates and tourism investment certificates in the region, which has developed in a way that is considered to be significant thanks to tourism. The total bed capacity of these hotels is 11,230. A total of 3,834,134 people visited the region in 2019. The number of tourists visiting Nevsehir, compared to the number of tourists who visited Turkey (51,860,042), constitutes about 7% (TUIK, 2020; Nevşehir Provincial Culture and Tourism Directorate, 2020). The city of Nevsehir, which is so important in terms of tourism, was selected as the study region.
In a study conducted on the Nevşehir region, cultural tourism was identified as the main motivation source for tourists visiting the region (Aslan, Güneren, & Çoban, 2014). But gastronomic elements are one of the factors that significantly affect the satisfaction of tourists visiting the region (Aslan et al., 2014; Karakuş, Onat, & Güneren, 2019, Karakuş, Onat, & Güneren, 2020). Professional chefs are needed to present these gastronomic elements to tourists. Because the importance given to food increases day by day, the number of tourists traveling for food and beverage is also increasing (Kivela & Crotts, 2006). It is the performance of the chefs that is most important in meeting such an important tourist need. For this reason, perceived overqualification variables that are thought to affect the performance of chefs were considered worthy of investigation.
2. Literature Review
2.1 Perceived overqualification and employee performance
The concept of overqualification can be examined in two different ways: subjectively and objectively. From the objective perspective, overqualification refers to the standard of skills that individuals must have and an educational level of the individual that is higher than that required by the work (Fine, 2007; Maltarich, Reilly, & Nyberg, 2011). From the subjective perspective, on the other hand, overqualification is the perception that the skills of an individual exceed what is required by the work (Maltarich et al., 2011). Subjective overqualification refers to individuals' perceptions of whether they are overqualified for their current jobs or not (Erdogan et al., 2011). Individuals’ perceptions of their own overqualification may not always reflect the reality. In other words, an individual who does not have the knowledge, skills, abilities, and education level required for the work may consider himself to have those qualifications. This comes to the forefront as the main difference that distinguishes subjective overqualification from objective overqualification (Maltarich et al., 2011:236-237; Maynard et al., 2015:211).
The concept of perceived overqualification was discussed by Kristof-Brown (2000:53) in the context of demand-ability mismatch. The term “demand” represents the requirements of the work within the organization, while “talent” refers to the level of knowledge, skills, training, experience, and other possible qualifications of the person performing the work. In other words, demand-ability mismatch means that the individual has more knowledge, skills, training, experience, and other possible qualifications related to the work. Therefore, the current study focuses on the concept of perceived overqualification. Person-job (PJ) cohesion is one of the narrower scopes of person-environment cohesion (PE) and expresses the harmony between an employee's characteristics and the job or task (Krıstof-Brown, Zımmerman, and Johnson, 2005). There are basically two types of PJ compatibility. One of these is demands-talents, and the other is needs-facts (Krıstof-Brown et al., 2005; Arvan, Pindekb, Andelc, & Spectora, 2019). What is addressed here is the demand-ability fit. In the context of perceived overqualification, there is no person-job fit. As a result, it is observed that individuals experience lower organizational commitment and job satisfaction (Fine and Nevo, 2008:346). Furthermore, it is regarded as a perception that escalates the individual's turnover intentions (Maynard and Parfyovona, 2013:437; Erdogan & Bauer, 2009:558; Maynard et al., 2006:549).
Performance is a concept that defines the extent to which individuals can make use of their potential or actual knowledge and skills to achieve their goals or expectations. In other words, it is the percentage of a person’s use of his/her capacity to successfully complete a task within a certain period of time (Kaynak et al., 1998). More specifically, the concept of performance is defined as the degree to which the goal is achieved. Performance refers to what extent an organizational goal is reached by an individual, group, work unit, or firm through performing predefined tasks (Kasnaklı, 2002).
Çoban and Eren (2017) examined employee performance under the framework of organizational performance. According to Kuebg and Krahn (1999), Kueng (2000), Eren (2007), Zerenler and İraz (2006), and Özdemir and Yılmaz (2016), employee performance is one of the factors that increase or decrease organizational performance. In other words, performance demonstrated by employees plays a great role in paving the way for an organization to reach its goals. Employee performance, which is of great importance for businesses, can be improved through a number of activities. Compulsory practical training provided in culinary schools and universities plays an effective role in increasing the performance of chefs, which have been selected as the sample group for the current study (Bucak & Yiğit, 2018). Furthermore, on-the-job training, motivation-boosting meetings, increases in salary, and promotions are the sorts of factors that increase employee performance (Yılmaz, 2018:103; Uygur, 2007).
In the literature, it is observed that person-job fit is associated with job performance (Kristof-Brown et al., 2005:317). The relationship between perceived overqualification and employee performance was discussed in the study of Ünsal Akbıyık (2016a), and it was concluded that perceived overqualification had a negative effect on employee performance. From this point of view, it is predicted in the current study that perceived overqualification is associated with employee performance, and in this context the following hypothesis is proposed to reveal the relationship between the concepts in question.
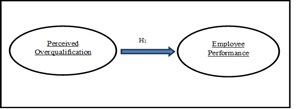
Hypothesis 1: Perceived overqualification has a negative effect on chefs’ performance.
As indicated in the conceptual model of the current study (see Figure 1), it is predicted that perceived overqualification will have an impact on employee performance.
3 Research Methodology
3.1. Research variables and measurement
In order to measure the concept of perceived overqualification, which is the independent variable in the current study, a scale developed by Maynard et al. (2006) is used. The scale consists of nine items that assess perceived overqualification, as follows: “My job requires less education than I have”; “The work experience that I have is not necessary to be successful on this job”; “I have job skills that are not required for this job”; “Someone with less education than myself could perform well on my job”; “My previous training is not being fully utilized on this job”; “I have a lot of knowledge that I do not need in order to do my job”; “My education level is above the education level required by my job”; “Someone with less work experience than myself could do my job just as well”; and “I have more abilities than I need in order to do my job.” The original scale is in the format of a 7-point Likert scale. Assessments range from “1 - strongly disagree” to “7 - strongly agree.”
The dependent variable in the current study is employee performance. In order to measure the performance of kitchen staff in hotel businesses, the employee performance scale developed by Kirkman and Rosen (1999:67) and adapted by Sigler and Pearson (2000:34) is used. The adapted scale consists of five items, whereas the original scale is in the format of a 7-point Likert scale. Employee performance was assessed using the 5-item scale of employee performance, as follows: “I complete my tasks on time”; “I meet my goals”; “I exceed my goals”; “I make sure that products meet or exceed quality standards”; and “I respond quickly when problems come up.” Assessments range from “1 - strongly disagree” to “7 - strongly agree.”
As a result of the comprehensive literature review on the scales, it was observed that a great number of studies tested and verified the reliability and validity of the scales used to measure perceived overqualification and employee performance. For instance, the performance scale was used by Kirkman and Rosen (1999), Sigler and Pearson (2000), and Çöl (2008), while the perceived overqualification scale was used by Ünsal Akbıyık (2016); Alfes, Shantz, and Van Baalen (2016); and Liu, Luksyte, Zhou, Shi, & Wang (2015). Therefore, it was decided to adopt the scales in question in the current study as well.
3.2 Sample and data collection
In the current study, the convenience sampling method, which is a non-probability sampling technique, was used as sampling tool. In this sampling method, the researcher collects data from the most easily accessible subjects until reaching the sample size required for the research (Gürbüz & Şahin, 2015:130). The reason underlying the preference of this sampling method in the current study is to conduct the questionnaire with as many eligible chefs as possible to reach in a short time the sample size that will represent the research population. In this sampling technique, the ability to represent the research population is low. Since the data collected from the same population in different time periods may differ, the collected data cannot be generalized over the population (İslamoglu, 2009).
The research population consists of chefs working in 4- and 5-star hotels in Nevşehir. According to the data dated October 30, 2018, obtained from the Nevşehir Provincial Directorate of Culture and Tourism, there are 17 4-star and six 5-star hotels operating in Nevşehir. The research was conducted throughout January and February of 2019. A total of 200 questionnaires was handed out to kitchen chefs and managers at hotels. Of these, 153 questionnaires were returned. However, it was observed that 15 questionnaires were left blank or never filled in. Therefore, those forms were excluded from the sample. The number of eligible questionnaires was 138. In order to use structural equation modeling, the minimum number of samples should be 5 to 10 times greater than the number of observed variables (Gürbüz & Şahin, 2015:324; Reisinger & Mavondo, 2007:42; Hair, Anderson, Babin, & Black, 2010). The number of observed variables in this study is 14. As the number of observed variables is multiplied by 10 (14 * 10 = 140), the result indicates that the structural equation modeling can be performed in the current study.
3.3. Data analysis
The data collected for this study were analyzed in a computer environment using SPSS and AMOS programs. In the study, normal distribution of data was tested via scatter plot matrix and also on the basis of the skewness and kurtosis values. Since the research data showed normal distribution, it was continued with parametric analyses. The scales adopted in the current study were developed and used in previous studies; therefore, confirmatory factor analysis was performed to test the reliability of the scales. As a result of confirmatory factor analysis, two items violating the reliability were excluded from the analytical process. Following the exclusion of the items, the normal distribution of the scales was re-tested, and reliability analysis was re-performed. Finally, structural equation modeling (SEM) was conducted since it allows error variances to be included in the model and its explanatory power is statistically greater than regression analysis.
4. Research Findings
4.1. Descriptive statistics of respondent employees
Table 1 provides the descriptive statistical data (frequency and percentage [%]) of the employees who form the sample in the current study.
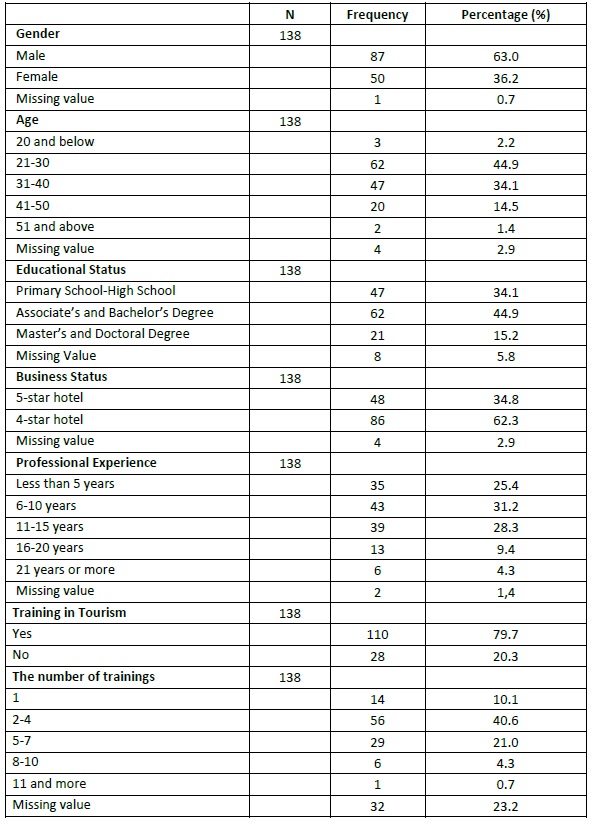
Regarding the gender of the employees involved in the study, it was observed that the majority (87) were men, who represented 63% of overall respondents. It was noted that the number of women respondents in the study was 50 with a rate of 36.2%. It was observed that 0.7% of the employees who participated in the study left this item unmarked. With regard to the age of the respondent employees, it was observed that 44.9% of overall respondents were aged between 21 and 30 years. In other words, the majority of the respondent employees in the current study was composed of young chefs. Upon examining the other statistics, it was noted that three respondent employees were aged 20 years or below (2.2%), 47 employees were aged 31-40 (34.1%), 20 employees were aged 41-50, and two employees were aged 50 or above (1.4%). It was observed that four (2.9%) respondent employees left this item unmarked. Regarding the educational status of the respondent employees, it was observed that the majority (62 respondents) was composed of chefs with bachelor’s and associate degrees. Upon examining the other statistics, it was noted that the number of respondents with primary and high school education was 47 (34.1%), and the number of those with master’s and doctoral degrees was 21 (15.2%). The remaining eight respondents left this item unmarked. Regarding the enterprise status of the hotels where respondent employees worked, the majority of respondents (86 respondents) were employed as chefs at 4-star hotels. The number of respondents from the kitchen departments of 5-star hotels was 48 (31.2%). The remaining four respondents (2.9%) left this item unmarked. Regarding the respondents’ years of professional experience, it was observed that the majority (43 respondents) had 6-10 years of experience in the sector. Other respondents’ years of experience are as follows: 35 respondents had less than five years (25.4%), 39 respondents had 11-15 years, 13 respondents had 16-20 years (9.4%), and six respondents had 21 years or more (1.4%). It was observed that the majority of employees (110 respondents) (79.7%) had training backgrounds in the field of tourism. On the other hand, it was noted that 28 respondents (20.3%) had no training experience in the field. As the respondents were asked about the number of tourism-oriented training events they had attended, the majority (56 respondents) (40.6%) responded that they attended such training events 2-4 times at maximum. It was reported that 14 respondents had attended once (10.1%), 29 respondents had attended 5-7 times (21.0%), six respondents had attended 8-10 times (4.3%), and one respondent had attended 11 times or more. Since 28 respondents had not been involved in such training before, they left the item unmarked. In addition, the remaining four respondents left the item unmarked despite the fact that they had attended such training.
4.2. Psychometric properties
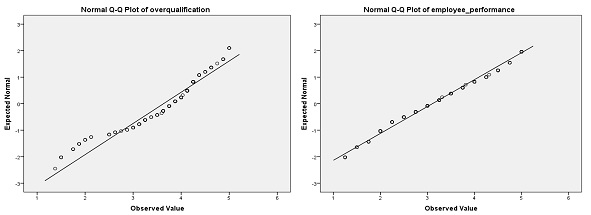
It is predicted that the variables in the research scale show normal distribution separately and in combinations with all variables (Çokluk, Şekercioğlu, & Büyüköztürk, 2018:16-17). In other words, it is assumed that the reciprocal effect of the variables in the research will show normal distribution (Hair, Black, Babin, & Anderson, 2014:686). Multivariate normality tests can be run graphically and statistically. One of the simpler graphical methods is to examine the histograms for each variable by plotting them on the normal curve. Q-Q plots can be shown as the more popular chart type. In this graph, the observations are ascending and graphed to correspond to the expected normal scatter plots. The values observed in this chart are on the X-axis, and the expected values are on the Y-axis. In charts with normal scatter, points are collected around a straight line. As the values (points) of the variables move away directly, the deviations from normality increase. As the points approach the line, that is, just above and below the line, it can be interpreted that the deviations from the norm are not excessive (Çokluk et al., 2018:15).
As a result of the Q-Q analysis, it can be said that our data provides normality.
In Figure 2, the distribution of normality is given by the Q-Q plots. It is observed that the data in this matrix show a close distribution to the line.
Statistically, multivariate normal distribution can be assessed in the light of skewness and kurtosis values (Hair et al., 2014:31-32; Çokluk et al., 2018:16; Tabachnick & Fidell, 2014:113). Levels of significance differ at critical skewness and kurtosis values which are presented below. Hair et al. (2014) indicate that the threshold value of normality should be ±2.58 at the significance level of 0.01 and ±1.96 at the significance level of 0.05. As a result of the skewness and kurtosis tests (p > 0.05), it is noted that skewness values range between -0.869 and 0.076 and kurtosis values range between -1.112 and -0.105. Since the analysis results fall into the range of the recommended values, it will undergo parametric tests in the following stages of the study.
The reliability coefficient of the scales in a study should be minimum (Cronbach’s alpha) and/or greater than 0.70 (Hair, Anderson, Tatham, & Black, 1998). In other studies in the literature, 0.60 and 0.50 are also considered acceptable. In the current study, an acceptable threshold of reliability was determined to be 0.70. It is observed that the values in Table 2 (perceived overqualification: 0.862, employee performance: 0.817) are above the acceptable level of reliability.
Factor analysis is an analysis method utilized to test measurement models that bring together a large number of variables that are linked to one another, and it aims to discover a small number of conceptually meaningful constructs (factors, variables) based on the large number of variables, or to identify correlations between the factors and their indicators. Factor analysis is one of the statistical techniques used to obtain evidence for construct validity in the scope of studies in the social sciences where the main purpose is to develop or adapt a scale and in studies where an already-developed scale is used for a different purpose or on a different sample (Çokluk et al., 2018:177- 178; Tabachnick &Fidell, 2014).
Factor analysis is divided into two categories as exploratory factor analysis (EFA) and confirmatory factor analysis (CFA) (Çokluk et al., 2018:177-178; Tabachnick and Fidell, 2014:614; Salvation, 2010:189). Although exploratory factor analysis is generally performed at the first stage of the research, it is mostly conducted to determine under which factor the measurement items accumulate. In general, it is employed in research of an exploratory nature. It is performed to explore the construct within variable sets of a newly developed measurement scale. Basically, in this analysis, it is not possible to predict in advance the number of factor groups under which the correlations between variables will accumulate. The researcher conducting the study examines the dimensions which are formed as a result of grouping the variables in line with the level of relevance in terms of content and factor loadings, renames the factors, and defines the dimensions (Kurtuluş, 2010:189). At this point, the fact that the factors to be formed at this stage show consistency with the theory is of great importance for the explanatory power of the study. On the other hand, in confirmatory factor analysis, the researcher has a theoretical argument about the measures of a construct (Hair et al., 2014:93). In the scope of CFA, the correlations laying out the foundation of the construct formed by the variables are put forward through validation of the theoretically developed specific hypotheses. In general, CFA is performed to identify whether the original construct of the previously used measurement scales is verified via the collected data in the study (Gürbüz & Şahin, 2015:326). Whether the model formed as a result of the confirmatory factor analysis and the collected data fit one another is assessed in light of the goodness-of-fit indices. The goodness-of-fit indices of SEM and CFA in the current study are presented in Table 2.
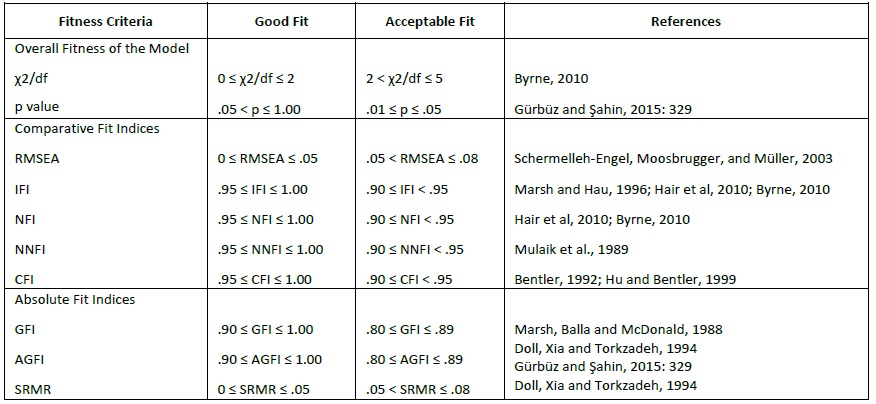
The root mean square error approximation (RMSEA) is mostly the comparative fit index preferred in large samples. It is an index used to determine the population covariances in the decentralized Chi-square distribution (Meydan & Sesen, 2015:34).
The comparative fit index (CFI), compared to NFI and NNFI, is a less sensitive comparative fit index. The harmony of the model is determined by comparing the model with the independence model/absence model, which assumes that there is no relationship between the variables. In other words, the independence model compares the covariance matrix and the proposed model's covariance matrix (Meydan and Sesen, 2015:34).
The goodness-of-fit index (GFI) is the absolute fit index for evaluating the model fit independently of the sample size. It shows how much the GFI model, which is similar to R2 in multiple regression, measures the covariance matrix in the sample. In other words, it deals with the amount of variance and covariance that can be explained by the model (Meydan & Sesen, 2015:34).
The normed fit index (NFI) is the preferred comparative fit for most large samples, and it is found by determining the ratio of the tested model to the Chi-square value of the independent model (Meydan & Sesen, 2015:33).
The adjusted goodness-of-fit index (AGFI) is the absolute fit index preferred for larger samples and is a regulated form of the GFI where the sample width is taken into account. More parameters are released and based on the correction to the model's degree of freedom (Meydan & Sesen, 2015:35).
The standardized root mean square residual (SRMR), in addition to being a general fit measurement based on the fit of values (such as RMR), depends on the variance and covariance sizes of the observed variables. This makes it almost impossible to decide whether the RMR value fits well or badly when the scales of the variables are not taken into account. SRMR was also developed to close this gap (Schermelleh-Engel et al., 2003:12).
In the non-normed fit index (NNFI), the model's Chi-square value is added to the Chi-square ratio of the independent model and the degree of freedom (df) of the model (Meydan & Sesen, 2015:33). The term TLI (e.g., in AMOS software) is also a comparative fit index used instead of the NNFI.
The incremental index of fit (IFI) uses a calculation that is essentially the same as NFI and is based on sample size and parsimony. Unlike the NFI, the degree of freedom is also taken into account (Byrne, 2010:79).
In the current study, the perceived overqualification scale developed by Maynard et al. (2006) and the employee performance scale developed by Kirkman and Rosen (1999:67) and adapted by Sigler and Pearson (2000:34) were used. Since the scales in the present study were adopted from previous studies, the multi-factor first-order CFA analysis was performed to determine whether the measurement constructs are validated by the collected data. The results of the multi-factor first-order CFA are provided in Table 3.
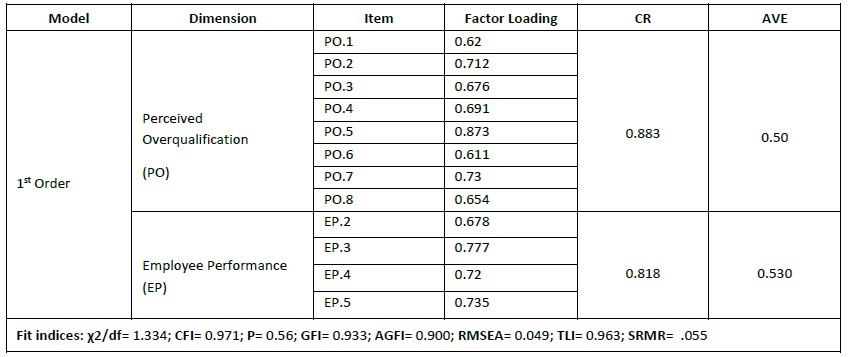
Following the confirmatory factor analysis, the items PO.9 (“I have more skills than required to perform my job”) and EP.1 (“I fulfill my tasks on time”) were excluded from the analysis as their factor loadings were below 0.50, which hindered the verification of convergent validity and discriminant validity. For convergent validity, the average variance extracted (AVE) and composite reliability (CR) values were tested on the basis of each latent variable. The AVE values and factor loadings must be greater than 0.50 while CR values must be greater than 0.70 (Hair et al., 2014:619; Dedeoğlu, Balıkçıoğlu, & Küçükergin, 2015:9; Dedeoğlu, 2019:523). In SEM, the researcher predicts a fit between the theoretical argument and the data; therefore, x2 is supposed to be deemed insignificant. The x2 value is highly dependent on the sample, and it is generally deemed significant at sample sizes of n < 200 (Gürbüz and Şahin, 2015:329). In the current study, the x2/df (1,334) and p (0.56) values are at the expected levels; in other words, the model is validated by the collected data. The ranges of the other goodness-of-fit indices are provided in Table 2.
4.3. Hypothesis testing with AMOS
The main objective of structural equation modeling (SEM) is to test a set of correlations between one or more independent variables and one or more dependent variables (Gürbüz & Şahin, 2015:323). The structural model developed in the scope of the current study employs one independent and one dependent variable. This model can be tested via classical methods of analysis. Nevertheless, the reason underlying the preference of SEM in the present study is that SEM, unlike the classical methods of analysis, incorporates statistical error variances into the analytical process and thus increases the explanatory power of the model. Furthermore, in classical methods of analysis that aim to test the correlations between the constructs, it is difficult to test a specific model in a holistic way. However, in SEM, whether a research model involving different correlations is holistically verified by the research data can be assessed based on goodness-of-fit indices. In the scope of the study, SEM was conducted to test the model and the hypothesis developed based on the current literature. The findings of the SEM analysis are provided in Table 4 in detail.
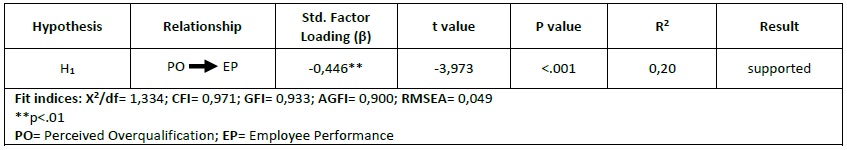
As seen in Table 4, perceived overqualification affects employee performance negatively and significantly (β = -0.446; t = -3.973; p < .001). Therefore, H1 is supported in the light of this finding. In parallel with the findings in Table 4, employee performance is predicted to decrease by -45% in the event of one-unit alteration in perceived overqualification. The goodness-of-fit indices provided in the structural model are a part of the goodness-of-fit indices presented in Table 2.
5. Conclusion and Recommendations
The current study discusses how perceived overqualification affects employee performance. It was predicted that employee performance would decrease as individuals’ perceived overqualification increased. As a result of the analysis, it is put forward that perceived overqualification affects employee performance negatively and significantly. In other words, employees may engage in lower job performance when they perceive that they have more skills than is required by the job. More clearly, this condition results in the fact that employees do not use their knowledge and skills to achieve organizational goals. In this case, for hotels in Turkey, such a condition can cause some disruption-for example, by employees slowing down work in the kitchen, failing to fulfill orders, or doing incomplete work. This can affect businesses through economic cost and loss of customers. As to the reasons why chefs might consider themselves to be overqualified, the following opinions are included in the literature: not seeing themselves as higher than the organization, not finding that they belong to that organization and not seeing the value they deserve, not getting the fee they deserve, not using the knowledge and experience they gained at school adequately in that workplace, etc. (Maynard & Parfyovona, 2013; Erdogan & Bauer, 2009; Maynard et al., 2006). It is seen that the findings of the current study show parallelism with the findings of other studies in the literature (Ünsal Akbıyık, 2016a; Ünsal Akbıyık, 2016b; Erdogan et al., 2011: 266; Kristof-Brown et al., 2005). As highlighted by Holtom, Mitchell, Lee, & Eberly (2008) in their study on turnover intention and willingness to stay in the organization, when individuals perceive alternative job opportunities, they have lower job performance, and those working with ambition will engage in such attitudes and behaviors that lead to a higher turnover intention. In such a country as Turkey where the unemployment rate is high, overqualified individuals may continue fulfilling the tasks and responsibilities assigned by managers and business owners so as not to lose their jobs. Nevertheless, those individuals will have higher turnover intentions as they perceive better job opportunities in the business world. Furthermore, they may have lower job performance, as well. In addition, individuals becoming aware of the fact that they are highly overqualified may start showing greater interest in other job opportunities. Consequently, the job performance required for an organization to reach its goals begins decreasing, which is an undesirable condition for organizations. Therefore, organizations must make sure that they take all necessary measures to avoid such a situation.
In the current study, it is observed that perceived overqualification explains employee performance by -45%. In the literature, employee performance is explained by such concepts as organizational justice (Kalay, 2016), organizational commitment (Uygur, 2007), perceived empowerment (Çöl, 2008), employee competence (Eren and Onat, 2018; Karakuş, Onat, & Ardıç Yetiş, 2018), burnout (Lee, Migliaccio, Lin, & Seto, 2020), high performance business practices (training, empowerment, rewarding) (Karatepe, 2013), and creativity (Ngo, Nguyen, Lee, & Andonopoulos, 2020). This study has attempted to explain employee performance through perceived overqualification, and this is the limitation of the study. Future research may encompass other concepts explaining employee performance, and those concepts may be tested via complex models, and thus, the explanatory power of employee performance can be increased.
The objectives of this study were: to reveal the effect of perceived overqualification on employee performance, to make recommendations for the literature and practice as a result of the research, to fill the gap in the literature, and to guide future studies. As a result of this research conducted on chefs, a negative and significant relationship was found between the perceived overqualification and employee performance. As a result of the research, suggestions for the literature and practice were made. This work on chefs contributes to fill the gap in literature.
It is anticipated that the findings of the current study will contribute to the literature. In this regard, the current study has revealed the fact that perceived overqualification affects employee performance negatively and significantly. Taking into consideration this finding, it is recommended that organizations give weight to the PJ fit during the hiring process. The hotels in the Nevşehir region should determine the requirements of the positions in the company in detail when hiring chefs and should ensure that the chefs know these detailed instructions during the recruitment process. At the same time, the recruitment of chefs can be undertaken by conducting interviews and practices incorporating these requirements. In this way, the desired employee-work harmony will more likely be achieved. In addition, orientation training can be provided to the hired chefs to achieve employee-business harmony. The losses mentioned above for the hotel business will be minimized in the enterprises where employee-work harmony is achieved. Commitment to the organization can be increased by providing motivational meetings, occupational safety training, and in-house training (e.g., knife use techniques, cake making techniques, new cooking techniques, information on how to use new technologies in the kitchen) to new chefs. Additionally, organizations can eliminate employees’ negative attitudes and behaviors towards the organization by increasing the material and immaterial acquisitions/profits distributed to the employees. At the same time, the fact that executives in organizations adopt performance-based remuneration systems in the context of assigning tasks and responsibilities can provide a positive contribution to the efficiency of such organizations.

