


 English (pdf)
 Article in xml format
 Article references
 Send this article by e-mail
 Cited by SciELO
  Similars in
SciELO
Similars in
SciELO 
 Permalink
1. Introduction
Loyalty programs (LPs) are a strategic way for companies to engage their customers, increase loyalty, and gain competitive advantages (Pesonen, Komppula & Murphy, 2019). Customer involvement tends to increase the loyalty, trust, and ratings of the company or brand (Harrigan et al., 2017). When properly designed, LPs induce positive results, such as loyalty based on consumer satisfaction (Koo, Yu & Han, 2020; Zhang, Zhang and Lu, 2020).
The marketing literature is notorious for claiming that consumers are in charge of brands (Keller, 2020). These claims conclude that the consumer has motivation (involvement), ability (lighting), and opportunity (empowerment) to influence companies. However, for Keller (2020), only a few consumers get involved with the company, and this involvement is often for a short time. Most consumers have little or no relationship interest with a company other than purchasing and consuming products and services. If the involvement leads to loyalty, it emphasizes the need to identify effective ways to influence consumers further.
Studies have continuously explained consumer involvement in loyalty in a wide variety of sectors (Itani et al., 2019; Meire et al., 2019), which indicates a theme of robust research. However, there is still a lack of further studies (Chandni & Rahman, 2020). Wei and Martin (2020) show the existence of different types of consumer involvement. They pointed out the need to explore these differences since consumer involvement affects behavioral and psychological dimensions. There is a need for various approaches for groups with different characteristics and combinations. It is also necessary to understand the factors that can influence the level of consumer involvement in the perceptions of value (Vivek et al., 2014). Some authors recommend that future studies on consumer involvement employ robust statistical tests to extinguish the possibility of variance in the common method of research (Vivek et al., 2014; Chandni & Rahman, 2020). Fournier (1998) mentions that a more comprehensive understanding of consumer involvement with the brand will lead to a greater understanding of the different types of relationships between them. Our research contributes to examining the levels of consumer involvement, thus addressing this identified need for further study on LPs.
The central idea of a LP is to achieve a solid long-term relationship with the consumer. The perceived benefits can explain why consumers participate in them (Bolton et al., 2004). Consumers' perceptions can indicate whether relationship marketing is efficient or not (De Wulf et al., 2001). The benefits perceived in LPs refer to the perceived value that customers consider in their experience with the program (Holbrook, 1996; Keller, 1993). Perceived functional value (PFV) has been identified as the main influence on LPs' consumer choice (Sweeney and Soutar, 2001). According to the authors, the PFV is a predecessor of consumer satisfaction. As previously noted, satisfaction leads to loyalty (Zhang, Zhang & Lu, 2020). Although these studies point to relationships between them, the literature review suggests that various consumer groups may provide different answers (So, Wei & Martin, 2021).
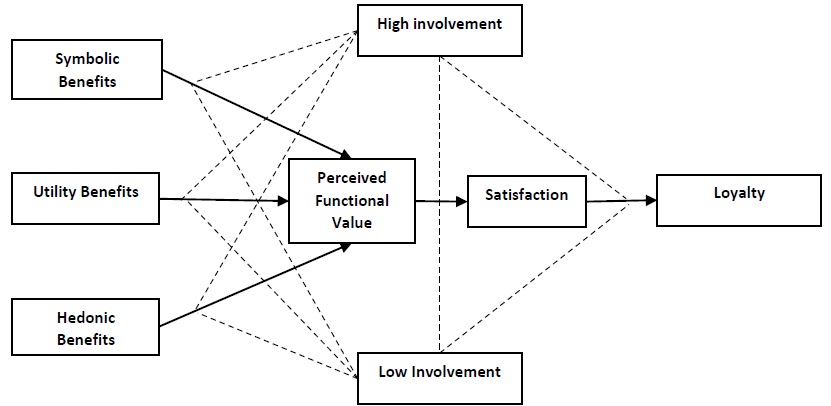
Our study used involvement as a control variable for testing our total respondent sample and subsamples (high and low involvement). Our objective was to analyze the relationships at different levels of involvement of airline LP users or members, with the following set of constructs: hedonic benefits, symbolic benefits, and utilitarian benefits (Mimouni-Chaabane & Volle, 2010); perceived functional value (Sweeney and Soutar, 2001); loyalty (Yi & Jeon, 2003); involvement (Vivek et al., 2014) and satisfaction with LPs (De Wulf et al., 2001). First, we examine the moderating effect of involvement (high and low) on the relationship between perceived benefits and perceived functional value. Second, we examined the relationship between perceived benefits and loyalty and the mediating role of perceived value and satisfaction. This study attempts to develop a greater understanding of LPs and various consumer groups. In developing the analysis, this study addresses a critical research gap that contributes to the advancement of literature and a better understanding of LPs' marketing sector.
2. Loyalty programs
Loyalty programs (LPs) strengthen companies by marketing offers that generate competitiveness, cause consumer resistance, and establish links in the medium and long term as a consequence (Rocha, Toledo & Almeida, 2008). The implementation and use of LPs are typical in various spheres of the economy, a prime example being the airline industry (Stathopoulou & Balabanis, 2016). LPs are among the most widespread marketing tools used by companies. They are generally used to gather information, improve consumer retention and improve consumer relationships and loyalty (Kang et al., 2015; Meyer-Waarden & Benavent, 2009).
Since the relationship with customers requires reciprocity between members, it is possible to generate positive or negative dependence (Hinde, 1979). Because of this, companies strive to add value at a lower price and with several advantages (Ashley, Noble, Donthu & Lemon, 2011). Customers can assess incentives and costs, along with their perspectives, to determine whether they want to be involved in a relationship with the company for its products and services (Steinhoff & Palmatier, 2016). In this perspective, the relationship may have different levels that need to be considered when developing or adjusting a LP (Vivek et al., 2014).
2.1 Involvement
Customer involvement is characterized as positive or negative, and high or low customer behavior (Bruneau, Swaen & Zidda, 2018; Doorn et al., 2010). Customer involvement is important since it can add an active and reliable voice for the brand, help other customers recognize their product and service needs, identify how the company can meet their needs, and overcome barriers between the company and the customer (Vivek et al., 2014).
The literature review indicates that most studies on the effects of loyalty programs (LPs) compare LP members with non- members and only count LP membership to assess the program's effectiveness (Meyer-Waarden, 2008). However, this measure of association may not differentiate between involved and non-involved members, nor can it identify customers who join but never participate in the program. Some studies suggest using more differentiated classifications, identifying various behaviors related to the LP (Bruneau, Swaen & Zidda, 2018).
We used the proposal by Bruneau, Swaen & Zidda (2018) to understand how LPs work through involvement and what can lead to customer involvement with a company. The authors define that customer involvement in LPs are behavioral manifestations concerning the company's LP, in addition to the purchase of a product or service. It is an important driver of the customer's general involvement with the company, as it establishes the their presence in the relationship built through the LP. Thus, customer involvement is characterized by a set of consumer behaviors from the company's LP strategies. Involvement needs to be understood from the customer's perspective, with an emphasis on psychological aspects, since it is capable of increasing consumer loyalty and satisfaction, training, concession, emotional bonding, and commitment (Brodie, Hollebeek, Jurić and Ilić (2011); Brodie, Ilic, Juric & Hollebeek (2013).
2.2 Benefits and the relationship with perceived functional value
The relational benefits generated from the customization of services or loyalty plan (LP) influence consumer behavior and positively improve the company's relationship with the customer (Mota & Freitas, 2008). Dorotic et al. (2012) indicate that the inclusion of rewards in LPs is of paramount importance, and consumers' needs must be continually customized. These rewards tend to increase retention and profitability and strengthen ties between consumers and the brand. One way to reward the consumer is through benefits. According to the authors, customers can obtain three categories of LP benefits: utilitarian, hedonic, and symbolic benefits. Utility benefits refer to the monetary savings that LPs grant to customers, such as a discount on invoices or products, in addition to points, coupons, and vouchers. Hedonic benefits are those related to leisure and exploration that LPs grant to consumers through accumulation and redemption of program points (Stathopoulou & Balabanis, 2016). These awards include evaluating new items, products or services, and reports of new trends, participation in events and festivals, or promotional offers for unique experiences (Mimouni-Chaabane & Volle, 2010). Finally, symbolic benefits are extrinsic values or advantages that LPs offer to consumers. These benefits can provide social status, a sense of belonging to a group, special treatment at a given location, social approval, and recognition by the company (Dorotic et al., 2012; Mimouni. Chaabane & Volle, 2010).
Based on the expectation-disconfirmation theory, Oliver (1997) points out that different processes underly the effects of three types of satisfaction benefits. Utility benefits, which have more tangible attributes, are processed cognitively and generate satisfaction by evoking feelings of trust and security (Chitturi et al., 2008; Jones et al., 2006). In contrast, hedonic and symbolic benefits have experimental and emotional attributes. They are linked to emotional replies that lead to satisfaction by evoking responses of joy and excitement (Aurier and Guintcheva, 2014; Chitturi et al., 2008, Klaaren et al., 1994). Airlines must provide satisfactory service to their customers to succeed in business and gain and retain customer loyalty.
The benefits derived from a LP can be functional, symbolic, or hedonic/experimental. A critical path, which can potentially connect a customer's program loyalty to company loyalty, is the experimental path (Gupta, Gupta & Shainesh, 2018). In this context, involvement is an emerging research construct and has an essential relationship with loyalty; present in several marketing fields (Bijmolt et al., 2010; Hall-Phillips, Park, Chung, Anaza & Rathod, 2016; Raïes, Mühlbacher & Gavard-Perret, 2015; Sprott, Czellar and Spangenberg, 2009). Marketers point out that interaction between customers and the company is essential because the more involvement occurs, the more the customer participates and benefits from its offers (Berry, 2015).
LP benefits include cash rewards (functional value perceived in terms of economic benefits), personalized communication (such as emails and birthday cards), and preferential treatment during purchases (experimental benefits) (Bolton et al., 2004; Mimouni -Chaabane, Volle, 2010). These features of LPs activate the individual's mental processes that link program loyalty to loyalty (Gupta, Gupta & Shainesh, 2018). These relational benefits can lead to perceived value (Chen & Hu, 2010). According to Zeithaml (1988, p. 14), the perceived value is consumer's general evaluation of the product's or service's usefulness based on their perceptions of what is received and what is given. In this way, consumers tend to remain in a relationship when the benefits exceed their expectations. Liljander (2000, p. 165), in his research, claims that the perceived benefits increase the perceived value and consequently increase satisfaction and strengthen the relationship with the brand. Thus we hypothesize:
H1 - The hedonic (a), utilitarian (b), and symbolic (c) benefits positively influence the perceived functional value.
2.3 Perceived functional value and the relationship with satisfaction
Value is defined as the overall assessment of a product's benefit based on perceptions related to what is given and received by consumers (Zeithaml, 1988; Gupta, Gupta & Shainesh, 2018). Perceived value, in the view of Duque-Oliva & Mercado- Barboza (2011), is a construct that surpasses the service's perceived quality. The perceived value can be conceptualized due to the customer's trade-off between the perception of quality and monetary and non-monetary sacrifices (Bolton and Drew, 1991; Zins, 2001). Tynan, McKechnie & Chhuon (2009) categorized the perceived value as utilitarian, functional, experiential, hedonic, symbolic, and expressive. Gupta, Gupta & Shainesh (2018) tested the relationship between loyalty and perceived functional value in loyalty plans (LPs). They stated that the perceived functional value functions as a moderating variable between benefits and loyalty. Besides, Sweeney and Soutar (2001) claim that the PFV is a predecessor of satisfaction. Satisfaction in LPs happens when the benefits are adequate or exceed what is expected by the consumer.
For Kotler & Keller (2012), the chances of satisfaction and repeat purchases are proportional to a product or service's ability to meet the customer's expected value. Thus, it is the cost-benefit equation calculated by the customer when interacting with the brand. Kumar and Shah (2004) suggest that brands can offer added value to customers in addition to products and services, providing customer-centric rewards through LPs. Research by Hsee, Yu, Zhang & Zhang (2003) showed that customers tend to associate greater value with the rewards they obtain and seek to maximize the value offered by the LP rather than the product or service itself. Hu et al. (2010) identified that LPs influence the perceived value of services and customer loyalty.
H2 - The perceived functional value positively influences satisfaction.
2.4 Satisfaction and the relationship with loyalty
One of the main reasons for developing loyalty plans (LPs) is maintaining relationships with customers; therefore, companies generally judge their success by relational results. The general term "relational results" refers to the company's objectives and its relational performance based on a specific marketing action (Briggs, and Grisaffe, 2010; Mimouni- Chaabane & Volle, 2010). Loyalty is the ultimate goal, with satisfaction being one of the most established loyalty factors in the marketing literature (Stathopoulou & Balabanis, 2016).
Customer satisfaction has been an essential determinant for creating loyalty (Hu et al., 2010) and has been considered a critical antecedent of customer loyalty for many years (Kim et al., 2015). Consumers often become members of LPs because of expectations that they will meet their personal goals. Satisfaction tends to result from the positive perception of the LP's performance and its benefits (Oliver, 1997).
The focused loyalty of the LPs' results is linked to the characteristics that guide the customer to consumption of a certain brand, product, or service. These aspects guide the customer's intention to repurchase, resistance to changing competitors, and willingness to recommend the service, product or other brands. Loyalty is also related to how much the consumer is involved with the company and its brand (Jacoby & Kyner, 1973; Tellis, 1988; Hapsari, Clemes & Dean, 2017, Mohd-Any et al., 2019).
Relationship marketing becomes crucial for the consolidation of consumer loyalty through loyalty programs. This is a corporate system that aims to provide the development and support of individual relationships with customers, seeking long-term results. Associated with this panorama are airline loyalty programs, essential for consumer loyalty, not only when purchasing airline tickets but also in countless products related the brand (D'Angelo, Schneider & Larán, 2006).
Organizations implement LPs to expand their customers' regular consumption (Wood & Neal, 2009), accelerate purchase intensity (Meyer-Waarden, 2008), and improve loyalty to the company (Yi & Jeon, 2003). Besides, customers' opinions on LP offsets motivate loyalty to LPs (Evanschitzky et al., 2012; Yi & Jeon, 2003), relationship with LPs (Nunes & Drèze, 2006; Schumann, Wünderlich, & Evanschitzky, 2014 ), choice of LPs (Kivetz & Simonson, 2002) and enjoyment of signing up for an LP (Jang & Mattila, 2005).
With the main focus on customer satisfaction surveys, many researchers have identified a significant and positive relationship between satisfaction and loyalty (Bowen & Chen, 2001; Han and Ryu, 2009; Hu et al., 2010; Lee et al., 2017). When customers are satisfied with services or products consumed, they tend to continue using the them. In this way, the company treats them as loyal guests and expects a positive word-of-mouth impact and a tendency to buy more and pay a higher price in return. Also, Lee et al. (2017) study that went deeper in measuring the loyalty generated by cruise passengers showed an intrinsic connection between passengers' general satisfaction and their loyalty. Therefore, managers of a cruise line or similar industry must properly recognize and monitor passengers' level of satisfaction to fulfill customer loyalty.
H3 - Satisfaction positively influences loyalty.
3. Methodology
We used a quantitative approach to answer the objectives of this study. For this investigation, we used symbolic, hedonic, and utilitarian benefits (Mimouni-Chaabane & Volle, 2010), perceived functional value (Sweeney & Soutar, 2001), loyalty (Yi & Jeon, 2003), and satisfaction (Wulf et al., 2001). These dimensions, as seen in the course of the theoretical development, gave rise to the hypotheses. The scales of each tested construct were used from previously consolidated studies to guarantee the quality of the data and the results. A 5-point Likert scale was used to measure the outcome variable.
In addition, a statistical solution using the post hoc Harman single factor approach was performed after data collection to test whether a single factor did not explain data variance. The factorial analysis, without rotation, was examined and showed that a factor was responsible for 55.89% of the explained variance, being higher than the minimum limit of 40 percent (Babin, Griffin, & Hair, 2016). A pre-test procedure was also carried out to guarantee the questionnaire's usability and verify the comprehensibility of all the respondents' statements (Aaker et al., 2013).
The survey was applied using the Facebook for Business (FB) tool. FB allows creation, tracking, and managing ads on Facebook, the most used social network in Brazil (Wearesocial, 2019). Despite being aimed at companies, this tool has been used to promote research since it allows the researcher to direct research to specific audiences, such as in the research by Pereira and Anjos (2021) and Berselli et al. (2021). We inserted two filter questions to ensure the participant was a loyalty program (LP) consumer. The first question asked whether the participant was a member of any LP. The second question aimed to determine which LP the respondent was a member of. We obtained a sample of 461 respondents. For better data treatment, outliers were removed using the Mahalanobis test, thus generating a sample of 429 validated questionnaires. To establish the minimum sample for each subgroup, we used the Free Statistic Calculator. Regarding the parameter values, we used: the predicted effect size (0.3), the desired statistical power level (0.8) and the probability level (0.01). The recommended sample size was 203 (Soper, 2020). The subsamples identified in this study were 212 respondents with low involvement and 217 with high involvement, thus supplying the required sample. For the initial analysis, we used Statistical Product and Service Solutions (SPSS) software version 23.
For this investigation, structural equation modeling (PLS-SEM) was applied. This analysis technique is used to validate predictive models (Hair et al., 2016) and is the most appropriate for the present study. According to Hair et al. (2017), PLS-SEM has the additional advantage of estimating the measurement model and is more suitable for performing multi-group analyzes (MGA) and avoiding bias estimation due to the unknown nature of the data. Two main steps were performed using SmartPLS version 3. In the first step, the entire sample was tested in the proposed model, which allowed the analysis of the measurement model and the test of relationships between constructs. The sample was soon separated into two groups: users with high involvement and low involvement with the LP company. Then, the Smart PLS software was used to calculate
the measurement model for both. For the bootstrapping, 5000 subsamples were used to calculate the path coefficient of both groups and compare with the entire sample.
In the second phase of the analysis, we used the Multi-Group Analysis (MGA) approach to determine the measurement model's invariance for both groups, as mentioned by the authors (Chin, Mills Douglas, & Steel Andrew, 2016). Comparing the subgroups and verifying if there is a significant difference in the path coefficient between them, we use the permutation test to verify significant differences between the compounds estimated for each group. The following figure shows the proposed model (figure 1).
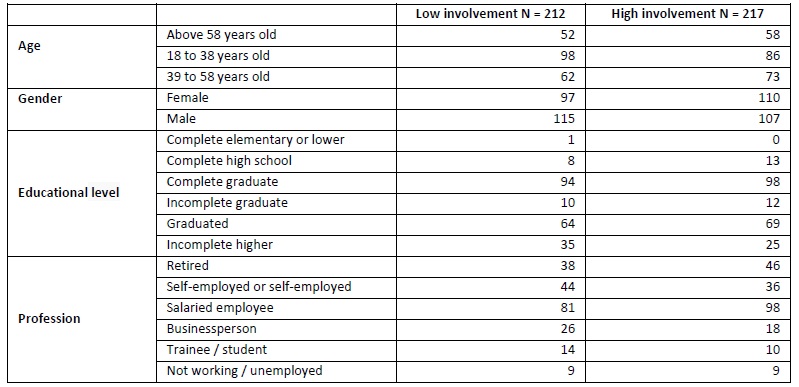
3.1 Sample characterization
After refining the data, we characterized the sample into two groups, with high involvement and low involvement with the company. Regarding the sample with high involvement, 49.30% were male (107), and 50.69% (107) were female. As for age, 39.63% were between 18 and 38 years old, 33.64% were between 39 and 58 years old, 33.64% were over 58 years old. The majority (45.16%) were salaried, retired (21.20%), self- employed (16.59%), entrepreneurs (8.29%), interns or students (4.61%), and without occupation (4, 15%). Regarding education, 45.16% have completed postgraduate studies, and 31.8% have completed higher education. In the sample with low involvement, 46.23% were between 18 and 38 years old, 29.25% were between 39 and 58 years old, 24.53% were over 58 years old. With higher education, they tend to have better jobs and, consequently, higher income. The majority (38.21%) were salaried, retired (17.92%), self-employed (20.75%), entrepreneurs (12.26%), interns or students (6.60%), and without occupation (4,25%). Regarding education, 44.34% have completed postgraduate studies, and 30.19% have completed higher education (table 1).
4. Results
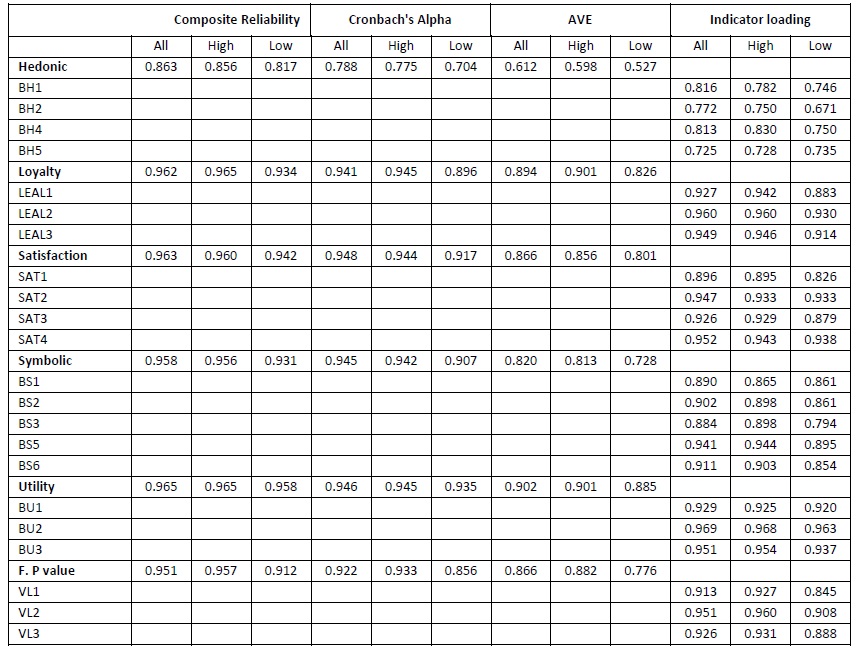
The measurement model allowed us to analyze the constructs' reliability and validity, together with their appropriate dimensions. Convergent validity, discriminant validity, and internal consistency reliability were verified. Within Hair et al. (2016) parameters, convergent validity has two criteria: the extracted average variance (AVE) must be greater than 0.5, and the factors above 0.5. Discriminant validity requires that the external loading of specific construction items is greater than any other constructs' cross-loading. For internal reliability, Cronbach's Alpha must be greater than 0.7 and composite reliability (CR) greater than 0.6.
According to table 2, the measurement model evaluation results show a stroke higher than the required limit. As the nature of the proposed model is reflective, items with low external loads were excluded for a better analysis of the path (Hair et al., 2016). Items BH3, BS4 were removed because they had low values. After removal, the model showed that all items exceed the minimum criterion of 0.5. The results showed that all constructs offer high internal consistency. In contrast, the consistency reliability is higher than 0.6, and Cronbach's Alpha of all constructs exceeds the value suggested by the literature by 0.7. Therefore, these values support the convergent validity and internal consistency in the three models.
For the analysis of discriminant validity, two metrics were applied. First, the Cross Loading matrix was used to ensure that the loading of each item of a specific construct is greater than any of its cross-loading, as recommended by Hair et al. (2016). Table 3 presents the cross-loading matrix result that indicates that each item is unique and distinct from the other items.

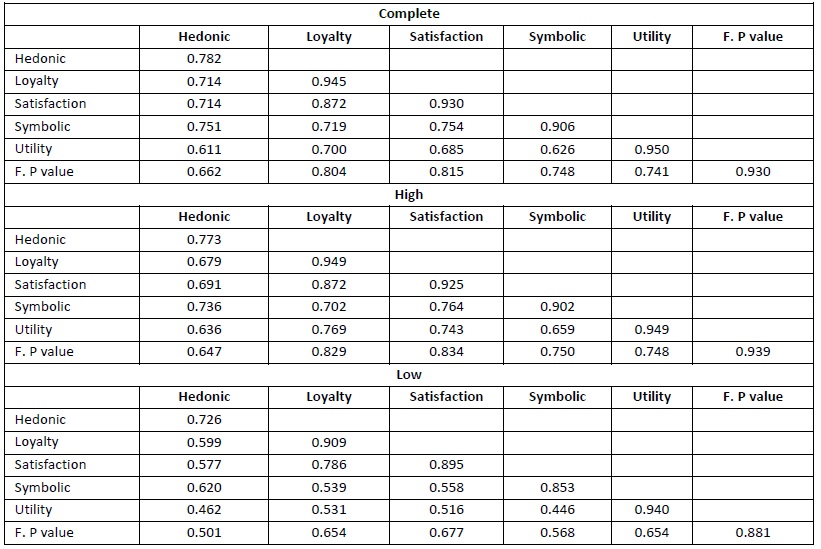
In the second measurement evaluation, the discriminant validity was based on the criterion of Fornell & Larcker (1981), in which the square root of the AVE of each construct is greater than its correlation with all other constructs of the model
(Fornell & Larcker, 1981). The results in Table 4 show that the square root of AVE of each construction is greater than the highest correlation with any other construction.
4.1 Evaluation of the structural model
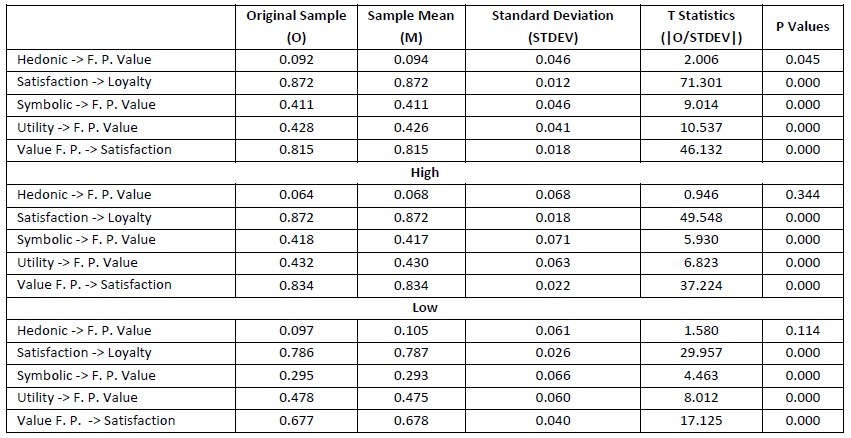
At this stage, the structural model was evaluated to test the path between the constructs based on the proposed hypothesis and the parameters suggested by Hair et al. (2016). The bootstrapping method with 5000 subsamples was used, two- tailed, and with a significance level of 0.05 to generate the standard error and statistics for the entire sample and the two subsamples. As shown in Table 5, the evaluation of the structural model revealed that the relationships across the sample are significant.
The highly-involved sample results show that the path relationship between satisfaction and loyalty is significant, β = 0.018, p = 0.000. This indicates that satisfaction has a positive effect on loyalty. The symbolic benefits and the utilitarian benefits were significant in the perceived functional value, with β = 0.071, p = 0.000 and β = 0.063, p = 0.000, respectively, indicating a positive effect of the two benefits on the perceived functional value. The relationship between the perceived functional value and satisfaction was significant, β = 0.22, p = 0.000, indicating a positive effect. However, the relationship between hedonic benefits and perceived functional value was not supported β = 0.068 and p = 0.344.
In contrast, the sample results with low involvement show that there is a positive effect between perceived functional value and satisfaction β = 0.040, p = 0.000. The utilitarian and symbolic benefits had a significant relationship with the perceived functional value β = 0.60, p = 0.000 and β = 0.66, p = 0.022 respectively, and satisfaction had a significant effect on loyalty. Thus also indicating a positive effect on these relationships. The hedonic benefits for the perceived functional value were not significant in the sample with low involvement with the company. This indicates that the perceived functional value is not affected by the hedonic benefits.
The empirical results show that the symbolic and utilitarian benefits have a greater positive effect in the sample with the highest involvement (β = 0.071 and β = 0.063, respectively) than in the sample with low involvement (β = 0.066 and β = 0.060, respectively). However, the user sample with low involvement has a higher value relationship with satisfaction (β = 0.040) than with high involvement (β = 0.022) and satisfaction with loyalty (β = 0.026; (β = 0.018). The empirical results show that both value and satisfaction are statistically more relevant for the sample of consumers with low involvement with the company.
4.2 Evaluation of measurement invariance
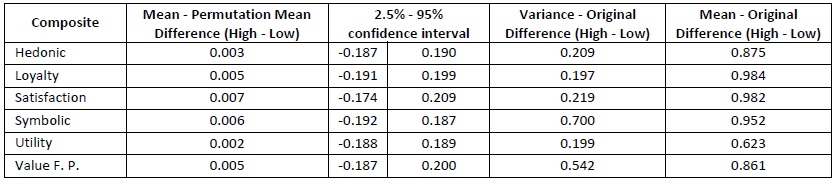
We performed the invariance test to determine whether construction measures are similarly understood in both groups (Henseler, Ringle, & Sarstedt, 2016). First, the invariance is established between all groups' data sets in the measurement model (Table 2 and Table 3). Second, a permutation test confirms that none of the c values is significantly different from each other. As shown in Table 5, all permutations with the values (= 1) are between the upper and lower limits of the 95% confidence interval, thus establishing the compositional invariance in the research model. The partial invariance of the study's measure is established, giving a viable indication for the realization of multi-group analysis (MGA) in the relationships involving the latent variables in the research model.
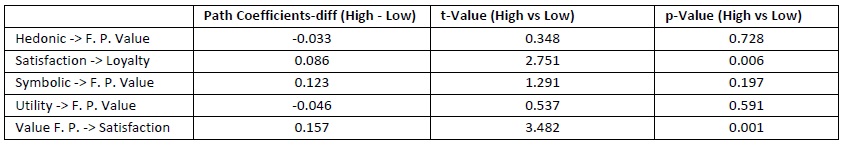
After performing the metric invariance test of the measurement model, the multi-group analysis (MGA) was performed, which allowed the analysis of the two groups' coefficient. Thus, they were used (5000 subsamples, two-tailed test, a significant level of 0.05) to identify the significant differences in the path relationships between consumers with high involvement and low involvement with the company. Table 6 shows the results of the MGA parametric test. The results revealed that there are significant differences between the satisfaction and loyalty groups, t = 2,751, p = 0,006, and perceived functional value for satisfaction, t = 3,482 and p = 0,001. The results showed that there was no significant difference between consumers with high involvement and low involvement with the company in the hedonic benefits for the perceived functional value, t = 0.348 and p = 0.728, symbolic benefits for the perceived functional value, t = 1.291 and p = 0.197, and utilitarian benefits for the perceived functional value, t = 0.537 and p = 0.591.
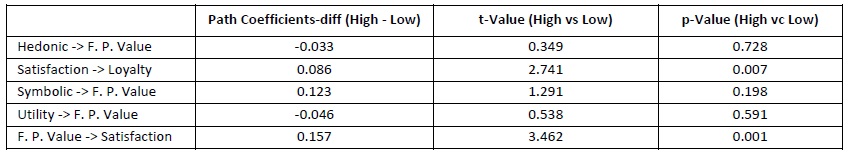
In consistency with the parametric test results, the Welch- Satterthwaite results in Table 7 shows that the difference in the path between satisfaction for loyalty and the perceived functional value for satisfaction was significant, t = 2.771, p = 0.007, t = 3.452, p = 0.001 respectively. In contrast, there were no significant differences between the two groups regarding the hedonic benefits for the perceived functional value, t = 0.349 and p = 0.728, symbolic benefits for the perceived functional value, t = 1.291 and p = 0.1958 and utilitarian benefits for value , t = 0.538 and p = 0.591.
Regarding R² in the model with high involvement, loyalty has R² 0.618, satisfaction (R² 0.459) and perceived functional value (R² 0.529). In the model with low involvement, loyalty has R² 0.618; satisfaction (R² 0.459) and perceived functional value (R² 0.529). The Stone-Geisser Q² values obtained through blindfolding procedures for both groups were greater than zero, providing support for the model's predictive validity (Hair et al., 2014).
Although the relationship tests are fundamental, it is necessary to look at the effect sizes (f²) of the paths (Cohen, 1988). Regarding the group with low involvement, the perceived functional value is impacted by the hedonic benefits (f² = 0.012), symbolic benefits (f² = 0.108) and utilitarian benefits (f² = 0.0361), while satisfaction was impacted by the perceived functional value (f² = 0.847), and impacts loyalty (f² = 1.615). In the group with high involvement, the functional value perceived on impact by hedonic benefits (f² = 0.005), symbolic benefits (f² = 0.217) and utilitarian benefits (f² = 0.0300), while satisfaction was impacted by the perceived functional value (f² = 2.277), and impacts loyalty (f² = 3.182).
In the comparison criterion, it is noted that in the group with high involvement, the effects of the perceived functional value on satisfaction and satisfaction in loyalty are higher than those of the group with low involvement. However, among the benefits, it is clear that for the group with high involvement, symbolic benefits are impacting more than in the group with low involvement. The utilitarian benefits impact more than the symbolic benefits in the group with low involvement. This result suggests that the exchange value is higher than the status value for this group.
5. Discussion
Table 5 shows the hypothesis tests. The result was indicated for the total sample and the two sub-samples (high and low involvement). In the total sample, all hypotheses were supported. In the subsample, both showed no relationship between hedonic benefits and perceived functional value. The hedonic benefits can be relevant as they explore two dimensions: exploration and entertainment. Minouni- Chaabane and Volle (2010) argue that consumers act as players and experience a sense of entertainment in this case. For the authors, this benefit is exploited by loyalty programs (LPs) as they can cause pleasure associated with redeeming points. Suh and Yi (2012) show that hedonic and utilitarian benefits act as moderators of LPs. Although scholars in different fields have widely applied these arguments, they have not been explored in the context of different groups within a sample. Model generalizations may omit specific facts; this research results did not confirm the relationship between the hedonic benefits and the perceived value.
We found that the symbolic and utilitarian benefits positively and significantly influence the perceived functional value for both the entire sample and subsamples. When the consumer receives symbolic and utilitarian benefits, the perceived functional value increases. Gupta, Gupta & Shainesh (2018) claim that although there is evidence that economic/utilitarian benefits are an essential factor for LPs, non-economic benefits, such as symbolic ones, can influence loyalty to the program. The symbolic benefits refer to the need for personal expression, self-esteem, and social approval (Keller, 1993). They result in intangible attributes that offer a way to differentiate and discriminate consumers who can interpret this as a sign of respect or distinction (Minouni-Chaabane and Volle, 2010).
Our multi-group analysis (MGA) results showed that there are significant differences between consumers with high and low involvement in the relationship between hedonic benefits and perceived functional value. As mentioned earlier, the results of this analysis confirm the role of involvement in our model. The results also showed a difference between groups in terms of satisfaction and loyalty. These two dimensions are more present in the group with high involvement. Satisfaction with the LP should result in greater consumer loyalty to the company. Having an LP will not necessarily generate high loyalty (Stathopoulou & Balabanis, 2016). Our research supports this claim as members of the same LPs responded differently. However, the higher the consumer's involvement with the company, the more satisfied the consumer becomes and more loyal, agreeing with Demoulin & Zidda (2008) and Stathopoulou & Balabanis (2016).
6. Conclusion
Our study advances research on engagement in several important ways. It contributes to advancing the involvement literature by providing a new conceptual approach beyond generalized measurement models since we present the general model, model with low involvement, and high involvement. In addition to being multidimensional, the involvement includes subgroups, thus requiring extra attention by communication departments, since not all tools used to promote consumer involvement with the company through loyalty programs may be adequate.
In the survey by Bruneau, Swaen & Zidda (2018), divergence in studies on involvement was pointed out. The authors cite that a large part of the studies on loyalty programs make a comparison between members and non-members, thus making an association to evaluate the effectiveness of loyalty programs, leaving aside research on members involved or not involved with the company. Our research advances theoretically and empirically for this gap, going further, and identifying the need for a greater understanding of user-profiles in an loyalty program. In addition to this binary finding, the measurement instrument allowed us to confirm the fact that the involvement is multidimensional. We warn that not all dimensions can be the same for different member groups.
Also, we tested the nested scale of Bruneau, Swaen & Zidda (2018), and Stathopoulou and Balabanis (2016) in three different analyzes to measure involvement in airline loyalty programs. The previous literature provided several generalized scales of involvement that involve multidimensions. However, it could not capture all the complexity of involvement in airline loyalty programs within different member groups. Therefore, when employing multi-group analysis (MGA), our study contributes to the authors. Finally, this study offers researchers and managers insights into the advancement of literature and marketing management strategies.
The study also has some practical implications. First, although previous studies have shown that hedonic benefits, which involve the pleasure of discovering new products and the fun of redeeming points, can be a potential tool for achieving loyalty (Suh & Yi, 2012), the results of our study imply that loyalty programs must focus their attention on symbolic and utilitarian benefits. This means that airline companies must provide rewards in their loyalty programs' benefits related to financial aspects that enable customers to purchase products and services at lower costa. In addition, the member expects that being part of an airline's loyalty program will enable aspects related to the concern, respect, differentiation, values, and welcoming of members. Members' satisfaction with these benefits will increase the perception of value in the quality of the service and the fair value paid. This will directly affect the member's loyalty, both those with high and low engagement, making the member have preferences for the loyalty program and recommending it to others.
Our study also points to the importance of establishing ways to involve consumers in their loyalty programs. The different behaviors within the sample imply a significant factor since this involvement can reduce costs and be more assertive with promotions (Vivek et al., 2014; Zhang, Zhang & Lu, 2020). Among the ways to get consumers involved may involve launching campaigns focused on the difference between consumers who are members of the program and changing the platform to apply gamification attributes to attract more attention and involvement.
6.1 Limitations and Future Research
This study has some applicable limitations. The main limitation is the test model was only in the Brazilian context. Therefore, we suggest replicating the study in other countries or using regional and global samples. Airline cultural and program differences can influence the proposed relationships. Besides, our study relied on quantitative data. We seek to test an already consolidated model. Therefore, a qualitative approach could provide a greater understanding of this behavior and provide new research insights. Our study showed that the relationship between hedonic benefits and the perceived functional value was not supported. Therefore, we suggest that new studies explore the social benefits of community sense and personalized brand communication. We also suggest experimental research involving loyalty programs and the application of gamification processes as a predecessor of these types of benefits.

