


 English (pdf)
 Article in xml format
 Article references
 Send this article by e-mail
 Cited by SciELO
  Similars in
SciELO
Similars in
SciELO 
 Permalink
1. Introduction
Tourism is a vital industry in the global economy, and it has been growing worldwide. Travelling is becoming essential not only to economic development and business growth but also socially. Tourism enables us to meet other cultures, share ours, and bond with people as family and friends (Raju, 2018). In 2017, the world registered a total of 1,323 million international tourist arrivals from other countries. In 2018, there were a total of 184,299 registered hotels globally - a growth of 8.38% in 10 years (Statista, 2018).
Hospitality and Tourism were hardly affected by the COVID-19 pandemic (Tom & Thanh, 2020). When we compare hospitality to other economic industries in terms of technology, hotels tend to stay a couple of years away from the average. We may interpret this distance with hotels' general financial success during the past years, thus, not feeling the need for higher technology adoption to grow revenues. Such a situation will change this year with the pandemic. Hoteliers see themselves forced to evaluate all their operating costs again, raise their efficiency with fewer resources (Fabbro, 2020).
There are two main types of hotels, independent ones and branded/chain ones. Contrarily to branded hotels, independent
hotels usually have a small ownership structure and are not connected to any brand. This situation causes a deficit in resources and often induces poor performance, as is proposed by the "resource constraint theory" (O'Neill & Carlbäck, 2011; Yang & Mao, 2017).
Usually, branded hotels have better performance and have more willingness to innovate, which will lead to them taking less advantage than what independent hotels take from the hotel chains (Orfila-Sintes et al., 2005; Yang & Mao, 2017). Whereas independent hotels have less propensity to adopt the technology, they have more latitude in strategy (Barros et al., 2011). On the other side, they can profit more from Information Technology (IT) because of their immaturity.
Technology adoption is also different in independent units than lower-class properties with high-class properties, better equipment, and more qualified staff to use these technologies (Yang & Mao, 2017). Independent hotels can be examples of innovation and technology, and chains can have difficulty in technology performance (Piccoli et al., 2011). Hence, we have identified both independents' and branded hotels' advantages and disadvantages to implementing technology (Yang & Mao, 2017).
However, tourism is facing productivity and efficiency problems (Barros, 2006; Phillips, 1999). A company operating with less efficiency will fail to keep enough market share. Tourism companies are not different (Barros et al., 2011).
Due to the tourism context, hotels operate in a genuinely competitive market, and technology drives efficiency in processes and innovation (Cobos et al., 2016). To increase efficiency, productivity, and support decision-making, organisations, in general, have been gradually increasing their investments in IT (Sun & Lu, 2014). Like in other sectors, hospitality, technology adoption is seen as complex and relies on many factors (Ahmet & Murat, 2014; Kim et al., 2008) and has its drivers and limitations (Davern & Kauffman, 2000).
We surveyed independent Portuguese hotels to study how the hotel sector evaluated the adoption of information systems and the decision-makers' perception of those systems' importance and usage in operational efficiency.
Like global tourism, Portugal tourism also shows exciting numbers. Tourism registered revenues of EUR 3.7 billion in 2017 (INE, 2018). Unlike other European countries, national hotel groups dominate the Portuguese tourism panorama. There were only five hotel companies among the 500 Top Portuguese enterprises in 2004 (Barros et al., 2011).
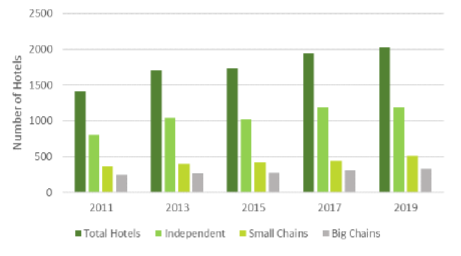
Since 2011, the number of hotels in Portugal has increased by 43.6%, and the number of independent hotels increased by 32.5%. The weight of independent hotels in the Portuguese hospitality context increased until 2017, achieving 61.4% in that year. Since then, larger chains started to build more hotels and acquire independent units, and in 2019, 58.8% of Portuguese hotels were considered independent (Deloitte, 2011, 2012, 2013, 2014, 2015, 2016, 2017, 2018, 2019). Given their
immaturity and independent status, many of these hotels are still relatively immature in technology. Therefore, it is not surprising that there is much space to improve technological efficiency and productivity (Barros, 2006). Reaching a new IT stage of maturity means the hotel achieved a performance improvement ((Piccoli et al., 2011).
This paper has the following structure. After this introduction, a literature review will contextualise the tourism and hospitality scenario globally and in Portugal. It will present the role of information systems in business and, more specifically, information systems in hospitality. Data and methods employed are described in the methodology section, followed by the presentation and discussion results. Lastly, the conclusion will summarise results, contributions, implications, limitations, and recommendations to future studies on the subject.
2. Literature review
2.1 Information systems in business
Information technology and information systems are taking a relevant role in businesses. IT can change traditional
businesses, such as tourism, but these capabilities are often not materialised (Andal-Ancion et al., 2003).
IT can create a competitive advantage in product differentiation, improve customer service, reduce operating costs, or create the ability to approach specific market segments (Kasavana, 2016). IT is an important instrument to enhance performance and strategic competitiveness long-term (Kim et al., 2008). Every business wants to have a competitive advantage, and sometimes this idea is associated with IT and new technologies.
Thus, many decision-makers opt for investing in IT for fear of being behind the competition, which is a vision leading to not leveraging the potential of IT value inside that organisation among employees (Chen & Liu, 2019; Weill, 1992).
Adopting these kinds of information systems resulted in reduced costs, the increment of revenues, and improved customer service and operations (Tarcan & Varol, 2009). The increase in profitability is more difficult to measure but consists of an application that outweighs the cost (Kasavana, 2016).
Some authors consider technology a driver for efficiency in processes and innovation (Cobos et al., 2016). Despite many people interrogating themselves about IT's benefits in organisations, IT has started to be recognised for improving operational efficiency and strategic positioning. While some studies concluded a relationship between IT investment and organisational changes, others did not, so we cannot generalise since many other factors influence the impact of IT on the organisation, making it a complicated relationship (Chen & Liu, 2019; Mitra, 2005; Powell & Dent-Micallef, 1997).
User satisfaction is of utmost importance. It will affect directly and indirectly the company's performance while using the solution. If there is system acceptance, the employee will be more performative and effective operationally (Chen & Liu, 2019). Once a new system is implemented, training is required for the employees using that technology, allowing them to perform faster and more comfortably in a unique solution that is more familiar to them (Moyeenudin et al., 2018).
Information Systems in Hospitality
Wereareas IT uses technology, mainly computers, to do information-oriented tasks, such as creating, processing, storing, retrieving, and distributing information. Information systems are the formal and organisational systems designed to support those tasks (Kasavana, 2016). Information systems are present in all departments of a hotel. IT is taking a relevant role in the hospitality sector. Hospitality companies take opportunities from the technologies, but these opportunities can be improved with a focused strategy (Piccoli et al., 2011). IT is seen as a strategic asset for the hospitality industry (Lam et al., 2007).
While data usage has increased in the hotel sector, it is essential to highlight that some hotels used spreadsheets to track historical data, do forecasts, or set their pricing, changing that information with other hoteliers about their performance (Alrawadieh et al., 2020). Data management improves quality and performance once it can help recognise employees' knowledge (Moyeenudin et al., 2018). These systems transform data into facts and valuable information, which is an asset for a hotel, once it increases knowledge about their guests, services, performance, finance, and operations (Kasavana, 2016).
Existing technologies surpass the number that a hotel could implement. However, no system alone can help manage all areas of a hotel, so there are systems net to interface with other systems to solve this limitation (Andal-Ancion et al., 2003; Kasavana, 2016). In hospitality, like in different sectors, the interface between systems is essential to create automation (Piccoli et al., 2011). Interfaces with Property Management Systems (PMS) and other systems are critical because they allow access to data and information collected by the PMS in various systems and create automated processes.
IT adoption is more driven by cost reduction and optimisation of the operation than by customer service improvement (Doran et al., 2002). While the hospitality industry is not technology- driven, technology adoption seems complicated (Law et al., 2013). Implementing technologies is related to factors like the hotel's size or affiliation to a hotel chain, which tends to have more technology available. Moreover, it is also associated with the decision maker's profile: "age, education level, and job tenure." When the decision-makers are younger, with a higher education level or a shorter job tenure, the decision tends to favour technology adoption (Ahmet & Murat, 2014). Other factors that influence hotels technology adoption are staff personal innovativeness, organisation innovativeness, and the users' acceptance of the information system. Both personal innovativeness and organisational innovativeness influence each other (Kim et al., 2008).
Hotel information systems acceptance increases with the systems' higher user-friendliness (Huh et al., 2009). Technology is becoming more user-friendly and data-driven, making it more sophisticated (Alrawadieh et al., 2020; Karadjov & Farahmand, 2007).
The quality aspects are understood differently by distinct system users (Sim et al., 2006). A key to the success of HIS might be user-oriented support. Essentially, during the early stage of technology implementation, it is crucial to receive training from the vendors to perform better and increase users' motivation to use IT (Lam et al., 2007).
2.3 Information systems maturity (ISM) in hospitality
Tapia has defined maturity as the sophistication level within a particular field (Alfirevic & Stemberger, 2015; Tapia et al., 2014). Popovic, A. presented information systems maturity as the " growth and development of IT infrastructure and functioning " (Alfirevic & Stemberger, 2015; Popovič et al., 2009).
Maturity is not just about the technology adopted by a hotel. This concept often implies a level of sophistication level significantly achieved. The " Capability Maturity Model " aims to improve the results of technology processes (Alfirevic & Stemberger, 2015). This maturity frequently involves transformations of essential business operations and affects products, processes, structures, or management practices (Matt et al., 2015).
Misunderstanding technology leads to underperformance due to a lack of knowledge about IT and three crucial functions: demand generation, multi-channel distribution, and revenue optimisation. These areas should be something in which hotels shall invest to reduce the underperformance. If this is made in a synergy between the three different areas, it will bring more results. They also recognise that they do not invest more due to a lack of resources (Piccoli et al., 2011).
Piccoli et al. (2011) have developed the Network Exploitation Capability (NEC) model based on three components: generality, detail, and usability. This model is composed of five stages and so four transition phases. If the firm comes to a new stage, there will be a performance improvement, originating more processes and systems. One stage is the basis for the next one (see Table 1).
The NEC Model's authors concluded that in 2011 most of the hospitality firms found themselves at the first or second stage. Most of them have only one employee with NIT skills. A few companies were in Stage 3, with more operational behaviour, especially hotel chains. There are no firms in Stage 4 with a more disciplined mindset for analytics to effective operations. Hence, there were no hotels in the 5th stage (Piccoli et al., 2011).
Performance must be evaluated regarding processes levels and outcomes. That outcome needs to consider many external factors which impact the organisation and its performance. Having staff inside the organisation with skills and capabilities for network exploitation is not enough to exemplify NEC maturity. Instead, the example is measured by if the organisation (hotel) can respond to new technologies regarding emerging distribution and marketing capabilities (Piccoli et al., 2011).
Immature organisations are characterised by having few systems and processes. If not registered, documented, and centralised, those processes and technologies' skills will get lost. For immature organisations, the goal is to increase the technology level, more investment, more consistent performance (Piccoli et al., 2011). According to the NEC Model, companies in the fourth and fifth stages must have systems fully integrated. Besides, analytical capabilities to improve their processes and learnings enhance their performance and optimisation (António & Serra, 2015; Piccoli et al., 2011).
Table 1 NEC's five stages model of ISM, their attributes, description, and macro-behaviors
| Stage | Defining Attribute | Description | Macro-Behaviors |
| 1. Basic | Durability | Taking advantage of utilisation individually | Only a few or none organised practices. The decisions are left to the idea of one individual. |
| 2. Systematic | Organisation | Organised operational practices | There are frequently organised performed practices. |
| 3. Integrated | Synchronisation | Synchronise operational practices | The principal business operation sectors (demand generation, electronic distribution, and revenue optimisation) synchronise their activities. |
| 4. Analytical | Logic | Structured logical practices | The Analytical work exceeds independent report practices from daily operations. |
| 5. Optimising | Continuation | Continual development | The capacity to compound, rearrange systems and assets while the organisation and markets change from the technological perspective. |
2.4 Research objectives
Considering state of the art in IT maturity in Portuguese hotels, with this study, we aim to map the independent Portuguese hotels in terms of technology maturity, according to the five stages of the Network Exploitation Capability (NEC) model (Piccoli et al., 2011). This map is constructed based on the hotel's technology acceptance, its usage, the analysis carried on with technology, the improvements achieved from its use, and the investment in the employees' qualifications. This study's second goal is to understand if hoteliers have the correct perception of their organisation's maturity level.
It is essential to understand independent Portuguese hotels' position in technology maturity to overcome their underperformance (Barros et al., 2011). Hence, we aim to achieve several objectives:
According to the NEC Model, find out if it is possible to classify hotels in terms of information systems maturity (ISM).
Map where independent Portuguese hotels are regarding the level/stage of IS maturity.
Identify patterns among hotels that classify themselves with the same maturity levels.
Understand if hoteliers have a correct perception of their organisations' maturity level.
To reach these objectives, we formulate the following research questions and the respective hypothesis:
Where are independent Portuguese hotels located in terms of maturity stages?
H1: Independent Portuguese hotels are, on average, located in the third stage of maturity.
Is there any direct relation between the hotel's category, the company's dimension, the profile of the decision-maker, and the maturity level?
H2: There is a direct relationship between these factors.
What are the systems used by independent Portuguese hotels, and what is the level of integration among those systems?
H3: All hotels have a property management system, but only a few have more recent innovative systems and integration between them.
What are the drivers and limitations for hotels to invest in technology?
H4: The main drivers for hotels to adopt technology are standardising processes and centralising information. The main limitation is the cost of the information systems and the budget allocated for them.
3. Methodology
As previously mentioned, the study aimed to map the hotel companies in terms of information systems' maturity according to the NEC Model (Piccoli et al., 2011). Furthermore, to relate that classification with their self-classification, finding incongruities over or under the hotel company's actual position. Besides, another goal was to link the level of maturity with several patterns: company's dimension, hotel's category, the region where the company has a hotel(s), presence on international brand/chains on their competitive set, the decision-maker profile for technology, the systems implemented in the hotel and technology investments, and the investment on staff qualification.
The scope of this research will be independent hotels as these units and small local chains up to six hotels, with no affiliation to international brands. In 2019, as shown in Figure 1, independent and small hotel chains represented not 58.8% (1,196 hotels) but 80% (1,1709 hotels) of the hotel industry in Portugal (Galhardas et al., 2019; INE, 2020).
This research aims to find the position of independent hotels and small chains with technology, representing most of the hotel context in Portugal, regarding the adoption and use of the technology and the staff qualification and skills to use these technological tools.
We used primary quantitative and qualitative data to achieve the research's goals. The obtained electronic surveys covered 152 hotels. Surveys were directed to independent and small hotel chains in Portugal (up to 6 hotels), representing 80% of the national hospitality sector (Galhardas et al., 2019). We complemented the surveys with in-depth online interviews with six hotel companies. The interviews allowed a better understanding of how hotels use technology daily, its impact on performance, limitations, and technology maturity.
3.1 Quantitative research
The research employed the sample size technique to estimate the population (Gaciu & Keller, 2019). Considering the population of 1,606 hotels contemplated independent and small chains for the research by the end of 2019, a confidence level of 95%, and a margin error of 10%, at least 90 hotels were required to be represented on surveys. There was the possibility of a valid answer with a company managing between one hotel and seven hotels.
Surveys started with a brief context of the study. We divided the surveys into three parts: the first with demographic characteristics and discovering questions, the second part with questions focused on identifying patterns and characteristics among various hotels. The last part of the survey focused on answering directly to classifying information systems' maturity levels (Mairinger & Pinho, 2019; Margarido, 2015; Nasoz, 2011). After running a pilot of five surveys, we approved the survey clearness of the questions and adjusted to the reality of Portuguese hospitality. These surveys were distributed mainly for profiles that influence decision-making, such as the hotel directors or sales directors. Hotels were from different country regions and with different dimensions and categories (INE, 2020).
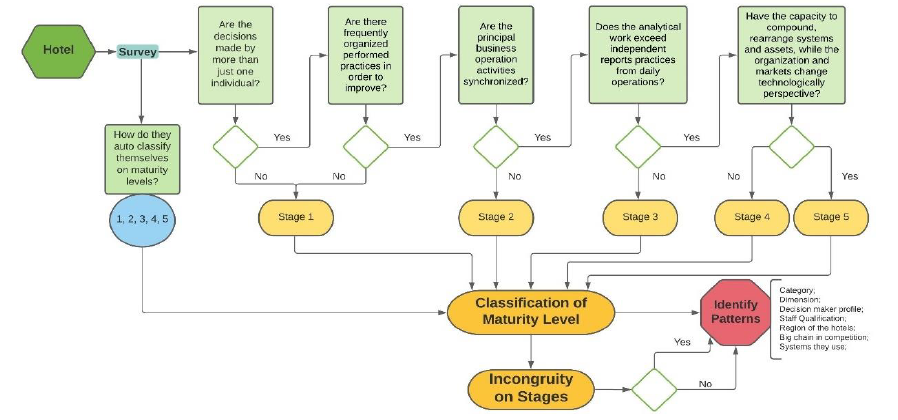
Figure 2 describes how we analysed the survey. One of the initial questions is the self-classification of the NEC maturity stages. Then, the respondent needs to go through a five-question process to find their maturity stage, understanding if they fill each stage's requirement. If the respondent selects "Yes," then they can be evaluated on serving the following condition. Once the respondent says "No" to some question, they stay on the previous stage. To accomplish the fifth stage, they need to say "Yes" to every requirement. After completing this process, the analysis of the incongruity and patterns takes place.
3.2 Qualitative research
After the surveys and its macro analysis, the research has dug deeper into the results under online interviews to understand better the drivers and the limitations for the hotels to be more technologically mature and if they acknowledge the importance of this concept, and what is the use they make of technology. We conducted the interviews using a few close-ended questions and open-ended questions, following the subsequent interview guideline:
Introductory paragraph.
Do you authorise the recording of the interview?
Name, Region, Hotel, #rooms, #hotels
What tasks/responsibilities are inherent to you in your organisation?
Which information systems does your hotel have?
Out of these, which ones do you use regularly and for what (minimum once a month)?
Which system do you use the most (minimum once a week)?
How do these systems help you to perform tasks?
Do you have systems integrated? If so, which ones?
If you answered the previous question in the affirmative, which integration features do you use?
Out of the systems you use, which ones were chosen by you?
In your opinion, would you need more information systems in your activity? What about your company? Please state why.
Out of the systems you use, have you been trained to use them correctly?
Usually, systems, especially software, changes over time. How does your company keep track of these updates? Are there regular developments on the solutions?
Has your company provided free training during the last year, at the technological level, in addition to that provided by the suppliers of information systems? If so, give examples.
Before being in touch with this investigation, have you ever heard of the concept of information systems' maturity? What did you know about this?
If you answered the survey, indicate which rating you gave to your company's information systems' maturity level and why you chose that classification.
In your opinion, why urge limitations to arise to be at the next level of maturity? Do you think your organisation can easily overcome these limitations?
In your organisation, what are the various organised practices often implemented to improve performance?
How are the demand generation, electronic distribution, and revenue optimisation sectors synchronised in your organisation?
What types of integrated analysis are made complementary to individual reports?
How is your organisation responding to technological changes in the market?
4. Results and discussion
4.1 Quantitative Research
The survey was available to collect answers for one month. We used the first week to run the five pilots to obtain feedback about the questionnaires. This feedback resulted in minor adaptations in the structure. We then removed those five answers from the dataset used for analysis. At the end of the survey period, we had 86 responses representing 195 hotels. The first step was to clean the answers from chains with more than seven hotels and responses from the same hotel company and the first five pilots' responses. It led us to close the survey with a total of 77 valid answers, equivalent to 152 hotels instead of the 90 initially planned. So, the margin of error became inferior to 8%, keeping the population size and the confidence level constant.
Table 2 shows that the respondents are independent units, while only one respondent represented a company owning six hotels. It is impossible to identify a direct continuous
relationship between the number of hotels per company and its rooms.
Table 2 Dimension of the companies represented in the questionnaires
| Hotels per company | Average number of rooms per hotel company | Sum of hotels |
| 1 | 81 | 60 |
| 2 | 167 | 54 |
| 3 | 331 | 24 |
| 4 | 254 | 8 |
| 6 | 600 | 6 |
| Total | 134 | 152 |
The most vital variable to analyse within the survey was the maturity level and then related to the other variables that can influence or influence the maturity level. As explained in the previous section, five questions (Part III of the survey) are intended to directly map the hotel's ISM. If the hotel had answered negatively to question 24, it was immediately classified as the first maturity stage. If they had responded positively, they could proceed with the following question, corresponding to the next stage. In the end, if the hotel had answered positively to all the questions, it could get the classification as the fifth stage, and if not, it was between the first and the fourth stage.
Many hotel companies find themselves in the first or third maturity stage, as seen in Figure 3. The fifth stage also has a vast preponderance, but not as in previous stages. It leads to conclude, on average, hotels in Portugal are located between the second and third stage of maturity, with a classification of approximately 2.73 from one to five, meaning between the systematic and the integrated phase. The five levels are presented here, with the minimum being the first stage, the maximum being the fifth stage, and a median is located on the third stage. We asked the respondents to self-classify them in terms of what they think their ISM level would be. Hence, it is possible to observe a significant part of hotels (86%) position themselves as on the third or fourth stage of maturity. If this would represent the reality, then the average level of ISM of Portuguese hotels would be 3.51, between the integrated and the analytical phase.
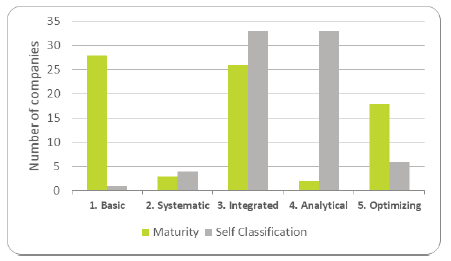
While 28 out of the 77 hotel companies self-classified as the first maturity stage, only one company has self-classified them as the first stage. This incongruity might mean that hotels are unaware of what ISM means or consider they take more advantage of ISM than they do. A summary of the incongruities in the classification is presented in Table 3.
Table 3 Classification according to NEC and incongruities on the classification
| Classification according to NEC | Count of hotels |
| Appropriateness | 27 |
| Appropriateness with Self-Classif. | 3 |
| No Incongruity | 3 |
| Incongruity with Self-Classif. | 24 |
| Over Classification | 9 |
| Under Classification | 15 |
| Incongruity | 50 |
| Appropriateness with Self-Classif. | 13 |
| No Incongruity | 13 |
| Incongruity with Self-Classif. | 37 |
| Over Classification | 36 |
| Under Classification | 1 |
| Total | 77 |
Besides, hotels are incongruent with their classification according to the NEC Model employed in this study. Accordingly, we see almost two-thirds of the respondents with incongruity among the answers which meet the classification levels. Thus, we can ask if this model is well employed in this study or the question metric to evaluate the maturity stage is well made. Furthermore, according to the survey results, only 16 out of the 77 hotel companies have classified themselves in the same stage as they are, while 45 have classified them above their stage. More than 58% of the respondents think they are in (at least) one stage above (over-classification). Less than 21% were more pessimistic, positioning themselves below what they are - under-classification.
When relating the ISM with other variables, this study went first to the hotels' characteristics. The regions of Portugal presented in Portuguese and are represented in table 4 by NUTS II (Nomenclatura das Unidades Territoriais para Fins Estatísticos): Norte, Centro, Lisboa, Alentejo, Algarve, Região Autónoma da Madeira and Região Autónoma dos Açores. Geographical regions do not equally distribute the hotels represented in the study. However, observing the numbers compared to the region's weight in the national context, there is a better distribution (see Table 4). Thus, it is not sufficient to make conclusions.
Table 4 Level of Maturity by Geographic Region
| Level of maturity | Alentejo | Algarve | Centro | Lisboa | Norte | RA Açores | RA Madeira | Total |
| 1. Basic | 3 | 2 | 10 | 7 | 16 | 1 | 9 | 48 |
| 2. Systematic | 2 | 2 | 1 | 5 | ||||
| 3. Integrated | 6 | 6 | 4 | 20 | 10 | 5 | 51 | |
| 4. Analytical | 6 | 2 | 8 | |||||
| 5. Optimizing | 1 | 8 | 5 | 7 | 15 | 3 | 1 | 40 |
| Total | 10 | 18 | 19 | 34 | 49 | 4 | 18 | 152 |
Table 5 relates the maturity level with the companies' average size (number of hotels) and the hotel's average size (number of rooms). No relation between maturity and the companies' size was found. There is a growing tendency in hotels' size on the
highest maturity levels regarding the number of rooms. Even so, it is not conclusive enough to establish a relationship between these two variables.
Table 5 Level of Maturity by company's dimension
| Level of Maturity | Sum of Hotels | Sum of Rooms | Average of Hotels per company | Average number of Rooms |
| 1. Basic | 48 | 3490 | 1.5 | 77 |
| 2. Systematic | 5 | 350 | 1.3 | 70 |
| 3. Integrated | 51 | 4459 | 1.4 | 87 |
| 4. Analytical | 8 | 998 | 4.0 | 125 |
| 5. Optimizing | 40 | 3818 | 1.7 | 95 |
| Total | 152 | 13115 | 2.0 | 86 |
Compared to the hotel companies' dimension, there is no visible relationship between the level of maturity and hotels' category. Hotels with different maturity levels are equally distributed by various categories, especially the traditional
ones, from 3 to 5 stars. Thus, we cannot conclude, by figure 4, that there is no relation between the level of maturity and the hotel category.
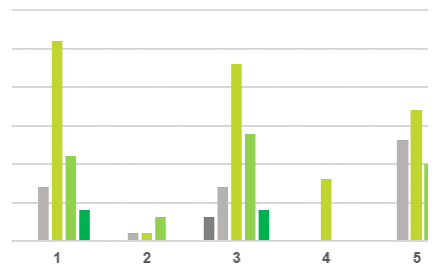
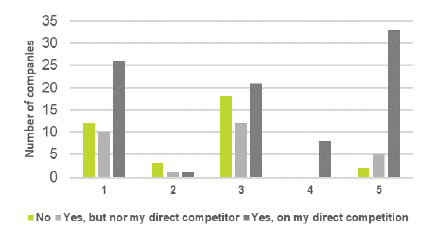
Unlike the two previously studied variables, in figure 5, it is possible to identify a relationship between the maturity level and a big hotel brand's presence in the competition. Almost all hotels (94%) do not have big brands as competitors are located in the first three stages of maturity. A similar situation happens with hotels with this kind of competition, although they are not direct competitors, speaking of 82% of hotels. On the other hand, within hotels with a big brand as their direct competitors (59%), 37% are in the fifth stage. When making the previous (but reverse) analysis, 70% of hotels that count with big brands on their direct competition are in the last three stages.
Additionally, while 54% of hotels in the first level face big brands on direct competition, this weight is 83% for the fifth stage. Therefore, we can conclude that there is a relationship between the level of maturity and big brands' presence in the competition. These competitors tend to be big international
chains that are more mature and digitalised, as seen in the literature, without familiar management. Hence, the independent units and small hotel chains that compete with these international chains also tend to follow the competition and adopt more technology to improve their management to be more competitive.
Another matter mentioned in the literature as relevant to influence the ISM of a hotel is the decision maker's profile for technology. Table 6 shows the potential relationship between the maturity level and hotels' distribution regarding their decision-maker background. In general, the decision-makers have a background in hospitality (45%) or business (31%). However, it appears only between the first and third stages of maturity some decision-makers have a background apart from hospitality or do not have any academic background. Hence, there might be a relation between these two variables, but it is not very evident to take a conclusion.
Table 6 Level of Maturity and the decision-makers background
| Level of Maturity | Business | Hospitality | IT/Systems | None | Other | Total |
| 1. Basic | 9 | 8 | 2 | 6 | 3 | 28 |
| 2. Systematic | 3 | 3 | ||||
| 3. Integrated | 9 | 13 | 1 | 2 | 1 | 26 |
| 4. Analytical | 1 | 1 | 2 | |||
| 5. Optimising | 5 | 11 | 2 | 18 | ||
| Total | 24 | 35 | 6 | 8 | 4 | 77 |
As detailed in Table 7, out of the 77 answers, 50 mentioned the decision-maker has between 31 and 50 years old. The extremes, between 18 and 30 years old as younger decision-makers and more than 61 years old, the number of answers is very similar. What is not that similar is that out of the five answers corresponding to the older (more than 61 years old) decision- makers, only one turned to be a company in the fifth level of maturity, while three companies in the first maturity level. When looking at the two younger ranges of ages, between 18 and 30 years and between 31 and 40 years old, seven companies in total are seen, either in the first stage of maturity and the fifth stage of maturity. Lastly, no clear pattern exists between the two middle ranges, between 41 and 50 years and
51 and 60. Consequently, looking into figure 7, it is feasible to say that there is a sightly relation between the maturity level and the decision-makers' age when speaking to younger or older people. However, it was not possible to establish a relationship with the middle ranges.
It is unfeasible to design a relation between the company's decision-makers position/role and the maturity level attributed to that company, as seen with the other variables about the decision-maker profile. We always see CEOs, General Managers, or Company Owners with a significant proportional weight on the number of classifications on each level.
Table 7 Level of Maturity and the Decision-maker's age
| Level of Maturity | 18-30 | 31-40 | 41-50 | 51-60 | 61-70 | >71 | Total |
| 1. Basic | 2 | 5 | 14 | 4 | 2 | 1 | 28 |
| 2. Systematic | 1 | 2 | 3 | ||||
| 3. Integrated | 1 | 12 | 5 | 7 | 1 | 26 | |
| 4. Analytical | 1 | 1 | 2 | ||||
| 5. Optimizing | 3 | 4 | 6 | 4 | 1 | 18 | |
| Total | 6 | 22 | 28 | 16 | 2 | 3 | 77 |
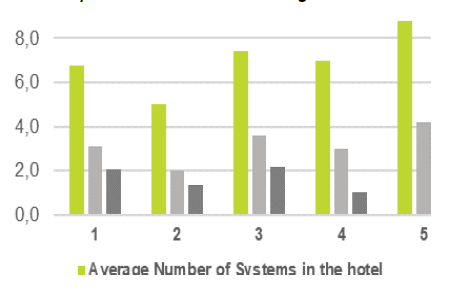
In figure 6, we look at the average number of hotel systems and the integrations with the PMS and the CM, known as collection and distribution points of information for other systems, as seen in the literature. According to the survey results, there is a moderate tendency for hotels in higher maturity stages to possess more information systems and more integration between those systems, making sense from synchronising information, which is a measure of maturity.
On average, a fifth-stage hotel has 30% more systems than a first- stage hotel and 19% more than a third-stage hotel. Making the same analysis on the PMS integrations, the numbers become 35% and 17%, respectively, and 35% and 23% on the CM integrations. Of course, there is still the need to understand the breaking tendency with stages two and four of maturity, which might be explained by the small number of hotels that assumed those classifications. There is not enough data to make a precise analysis assuming these second-stage (systematic) hotels and fourth-stage (analytical) hotels are outliers. Hence, the relation between the number of systems available for a hotel is attainable and its integration and maturity level.
Out of the 28 hotel companies in the first level of maturity, 17 have equals or less than seven systems (61%), while out of the 18 companies on the fifth level, 12 have equals or more than eight systems (67%).
More than analysing the number of systems, it is crucial to understand the position of the hoteliers regarding the latest technology considered for this study: Chatbots for hotel's websites, Customer Relationship Management (CRM), and Online Reputation Management (ORM), against the PMS, the central and one of the oldest kind of information systems for hotels. As evident in figure 7 below, every hotel company that answered the study has a PMS. It is the central system, and every hotel shows the need to have one, regardless of the maturity level, hotel category, or dimension.
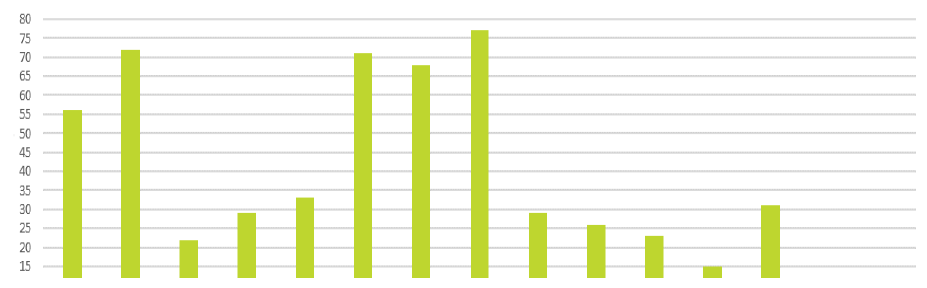
On the other hand, on average, only one-third possess the latest technology. Among these three, CRM is the most favourite, with 38% using it. However, less than 30% have a Chatbot or a system for ORM. There is a clear growing tendency: as the level of maturity grows, the latest technology's presence also grows. The ratio of the newest technology presented in the first-stage hotels is approximately 0.68 out of 3 technologies per hotel company with this classification, 1.0 for third-stage companies, and 1.5 for fifth-stage companies. Chatbots are the key differential, as in the CRM or ORM systems, hotels are equally distributed among the maturity levels.
More than evaluating what hotels have today, the study went into their intentions to adopt more information systems next year. However, as presented in Table 8, more than 54% intend to decrease their current investment in technology. This analysis is more exciting and relevant for the study when comparing these results to the maturity level. Out of the 36 new technologies expected to be adopted, only 28% correspond to
the hotels with the two highest maturity stages, while 44% to hotels with the two lowest maturity levels. These results can be explained because more mature hotels already have these technologies and do not need to invest as much as less mature hotels. However, it can also mean there is no direct relationship between the maturity level and the intention to acquire information systems.
Table 8 Level of maturity and intentions to invest in information systems
| Plan to invest Number of systems to invest in | 1. Basic | 2. Systematic | 3. Integrated | 5. Analytical | 6. Optimising | Total of hotels |
| Up to 10% more | 6 | 10 | 1 | 1 | 18 | |
| 1 | 2 | 3 | 5 | |||
| 2 | 1 | 4 | 1 | 1 | 7 | |
| 3 | 3 | 1 | 4 | |||
| none | 2 | 2 | ||||
| Up to 25% more | 5 | 1 | 3 | 1 | 5 | 15 |
| 1 | 1 | 1 | 2 | |||
| 2 | 1 | 1 | 2 | 4 | ||
| 3 | 3 | 1 | 4 | |||
| 4 | 1 | 1 | 1 | 3 | ||
| 5 | 1 | 1 | ||||
| none | 1 | 1 | ||||
| Up to 50% more | 1 | 1 | ||||
| 2 | 1 | 1 | ||||
| More than 100% | 1 | 1 | ||||
| 5 | 1 | 1 | ||||
| Intend to invest less | 17 | 2 | 12 | 11 | 42 | |
| 4 | 1 | 1 | ||||
| none | 16 | 2 | 12 | 11 | 41 | |
| Total | 28 | 3 | 26 | 2 | 18 | 77 |
In table 9, it is evident that these latest technologies will be a priority for investment. This year, we have 71% of hotel companies without a Chatbot, 62% without a Customer Relationship Management (CRM), and 70% without an Online Reputation Management (ORM). Next year, according to the hoteliers' investment plans, these numbers will be 8% and 56% next year. These values indicate that 20% more hotel companies will invest in at least one of these three mentioned technologies.
Table 9 Investment in the latest technology
| Has already the technology | Plan to invest | Total next year | |
| Chatbot | |||
| No | 55 | 12 | 43 |
| Yes | 22 | 34 | |
| CRM | |||
| No | 48 | 12 | 36 |
| Yes | 29 | 1 | 41 |
| ORM | |||
| No | 54 | 11 | 43 |
| Yes | 23 | 34 | |
Like with any other investment, also technology has its drivers to be made and its limitations. It is evident the main driver for
hotels to invest in technology is " increase revenue/profits " in every maturity level, with a total of 40% choosing this as their main driver out of the eight given options. As the second option, with less than half of the choices, there is a " reduction of time on daily tasks " inherent to almost every information system. On the other hand, the less chosen drivers were centralised, processes, and areas of activities and had a competitive advantage. It is interesting to verify that the choices are not related to the maturity levels as the main choices are coherent among every stage. The only significant difference registered is that hotels with the highest maturity give more importance to providing a better experience to their guests, yet not powerful enough to establish a relationship with the maturity level and the drivers for technology investment.
As the main limitation for technology investment, the respondents' most chosen reason was " do not have the budget for more systems " in every level of maturity. Almost 68% pointed to this as their main limitation to acquiring technology, showing that hoteliers do not see much return on investment (ROI) on information systems. Unlike the drivers, a small pattern can be identified between different maturity levels for investment limitations.
Lastly, we see the variables connected with the staff's qualification and training in the use of technologies. On the left of table 10, we see how frequently hotels invested last year on the staff qualification or if what staff have received was only provided by the technology vendors. Interestingly, less than half of the companies (39%) plan to change their strategy from the last to next year.
Table 10 Investment in staff qualification
| Staff Qualification | 1 | 2 | 3 | 4 | 5 | Total of hotels |
| Provided by technology vendors | 15 | 2 | 16 | 1 | 8 | 42 |
| Provided by technology vendors | 9 | 1 | 9 | 7 | 26 | |
| No | 3 | 3 | ||||
| Yes, between one and three times | 6 | 1 | 3 | 1 | 1 | 12 |
| Yes, more than three times | 1 | 1 | ||||
| No | 4 | 1 | 2 | 1 | 8 | |
| Provided by technology vendors | 1 | 1 | ||||
| No | 4 | 2 | 1 | 7 | ||
| Yes, between one and three times | 5 | 5 | 9 | 19 | ||
| Provided by technology vendors | 2 | 1 | 4 | 7 | ||
| Yes, between one and three times | 2 | 4 | 5 | 11 | ||
| Yes, more than three times | 1 | 1 | ||||
| Yes, more than three times | 4 | 3 | 1 | 8 | ||
| Provided by technology vendors | 1 | 1 | 2 | |||
| No | 1 | 1 | ||||
| Yes, between one and three times | 1 | 1 | 2 | |||
| Yes, more than three times | 2 | 1 | 3 | |||
| Total | 28 | 3 | 26 | 2 | 18 | 77 |
Diving deeper into this analysis by maturity levels, we can verify that half of the companies who have not provided training to their staff last year belong to level one, while none to level five. Besides, more than 55% of the fifth-stage companies invested in their staff qualification at least once last year, while only 32% on the first stage of maturity have done it. On the other hand, results show that more mature companies are proposing a reduction in the staff qualification, 33% of the fifth stage companies plan to invest in the staff qualification. This number is 38% for the third stage companies and 43% for the first stage. Thus, there is no clear relationship between investment variables on staff qualification and maturity level since the past pattern becomes the opposite for future intentions.
Finally, it is crucial to look at the role of technology providers in this variable. About 54% of the companies have seen their staff
receiving only the technology vendors' training. Of those, 62% intend to keep with the same strategy, contributing to 47% of companies that expect to have their staff only receiving training by the technology vendors. These results show that more than half of people who resort to technology tools have been educated by technology providers, who play a more strategic role in hotel companies, as seen.
4.2 Qualitative Research
We conducted six interviews with sales or revenue managers from six different hotel companies. Two are classified at the first maturity level, two are at the third maturity level, and two are at the fifth maturity level. This distribution allows the top, intermediary, and bottom levels of maturity to be represented within these interviews. Table 11 allows us to see which hotels and hoteliers' profiles have been interviewed.
Table 11 Interviews made, organised by the maturity level and hotel characteristics
| Maturity Level | ||||||
| 1. Basic | 3. Integrated | 5. Optimising | ||||
| Region | RA. Madeira | Lisboa Norte (Porto) | RA. Madeira | Lisboa | RA. Azores | Norte (Porto) |
| Hotel Type | Leisure Business | Leisure Business | Leisure | Leisure | Leisure Business | Leisure Business |
| No. Hotels | 2 | 2 | 3 | 4 | 3 | 3 |
| Profile | Sales Manager | Sales Director | Revenue Manager | Revenue Manager | Revenue Manager | Director of Sales & Revenue |
| No. Systems | 7 | 10 | 13 | 8 | 11 | 10 |
From the several hours of interviews, we can summarise the main findings in the following points:
There are apparent differences in the number of the information systems, having from seven to thirteen systems in various companies.
Opinions are shared in terms of the advantage of the time saved by information systems, more broad and faster access to information, centralisation of information and processes, increasing decision-making agility at the right time.
The respondent's influence on the information systems decision varies between 25% and 100% in the answers' total, depending not on the company's characteristics but the respondent's profile.
Hotels with fewer tools need more systems. Hotel companies that already have these systems do not consider more systems necessary-instead, greater centralisation and adjustments of the systems to be more efficient in their use.
Technology vendors assume an essential role in training. All the companies have provided training to their employees in various areas depending on their tasks.
None of the level 1 interviewees knew the concept of information system maturity. At level 3, they have superficially heard about it, and at level 5, they have previously had contact with this concept.
Companies that have ranked themselves above the NEC Model classification are linked with the fact that they have been on a positive evolution path in recent years. They are also linked to a comparison at a regional or national level and thus position themselves above that average. Companies that have ranked themselves below the NEC Model classification do benchmark internationally.
The limitations of adopting more technology, especially at levels 1 and 3, are essentially related to budget issues, i.e., systems' cost.
All companies point out regular meetings with their boards to present results and strategy definitions based on customer and employee feedback and hotel performance as practices implemented to improve performance. From levels 3 and 5, there is a benchmarking strategy and employees' training.
Levels 1 and 3 could not indicate the demand generation's synchronisation strategies, electronic distribution, and revenue optimisation. At level 5, the answers were more concrete, with the strategies to be thought from top to the operation with several actions thought to see how the guest goes through a flow, directly related to the direct booking by the website.
Level 1 and level 3 companies do not elaborate on integrated analysis. The analyses are all done individually by various people or departments.
Based on these findings, there is still work to do on changing the mindsets in shift, seeing technology as a cost to an
investment, which begins slowly to be made at the lowest maturity companies. For the more mature companies, they are very active in the search for new solutions. They have most of the software available in sizeable national hotel chains in different departments. However, they point out a limitation in the improvement of these solutions and the transition costs.
5. Conclusions
5.1 Research Implications
As seen by the survey's collected answers, many variables present a cause-effect relationship with the maturity stage. As previous authors mentioned in the literature, these variables might be the decision-makers' profile (Ahmet & Murat, 2014) - having a big brand on their competitive set or information systems portfolio. In opposite, we have companies' dimensions (in the number of hotel units or rooms) or investment in staff qualification. Self-classification is discrepant from reality due to several factors but shows evidence of a connection with the kind of hotels respondents use for benchmarking.
For some hoteliers (interviews indicate 50%), this research was the first contact with the ISM concept. We can see some advanced strategies in the higher levels and the integrated analysis of the differentiation between maturity levels. Lastly, this conducts to conclude that not all companies can respond to technology changes in the market.
The present study was necessary for the industry since there is now an overview of where hotels in Portugal are placed in information systems maturity, serving as a case study for other geographical regions. Generally speaking, there is still a long work to do to change the mindset of hoteliers, especially decision-makers, to see technology rather as an investment instead of a cost. Hence, this research corroborates NEC's recommendations (Piccoli et al., 2011). If hotels want to follow them, they will invest in information systems, integrate the different systems available, ensure qualification for their staff to use these tools, and optimise their performance and operations. Therefore, a take less reactive attitude and instead, a more proactive attitude towards management.
Lastly, it is important to reinforce that these results are accurate when we see this market (Portuguese). Then it is worth making a fundamental analysis of other countries to understand if the results are similar.
5.2 Tested hypothesis
Based on quantitative research through surveys, the research hypotheses can be confirmed or rejected.
H1: There is a confirmation when addressing the first research question and its hypothesis. On average, independent Portuguese hotels are located on the third maturity stage of the NEC Model, with a classification of 2.73 between 1 to 5.
H2: It was not possible to conclude the relationship between the maturity level and the hotel companies' size, measured in the number of hotels, despite identifying a potential relationship in the number of rooms per hotel. A close situation comes up in the hotel category once more, not being attainable to locate a relationship with the maturity level. Lastly, no pattern can be designed with the decision-maker's position in the company with the decision maker's profile. However, the decision-makers background is not relevant. Consequently, we reject the hypothesis, acknowledging that the decision maker's profile impacts the information systems' maturity as mentioned in the literature.
H3: With the third hypothesis, there is a need to divide it into two parts. The first is confirmed, knowing every hotel has a PMS, being the hotel's central system. Also, there is a cause- effect relationship with the maturity level and the number of systems available and their integrations. As the second part of this hypothesis, only 16 companies (21%) possess one of the three latest technologies considered for this study. The number of integrations between different systems is not significantly different since hotels with more information systems will have more integrations. Since the difference is proportional, the H3 is confirmed, except for the integrations between different systems.
H4: Similarly to the H3, H4 needs to be divided into two parts. This hypothesis could not be further from the main driver's results for investment in technology, which intends to "increase revenue/profits". Simultaneously, the centralisation of information, processes, and areas of activities was the least chosen reason, along with having a competitive advantage. On the other hand, we confirmed the hypothesis by establishing that the primary limitation was the same as previous studies have identified - not having more budget allocated for more information systems (Cobanoglu et al., 2006).
This study made it possible to validate the positive impact of technology in promoting business maturity and, consequently, in hotels' performance and competitiveness based on the NEC model.
5.3 Limitations and Future Work
Like other studies, this one also faces its limitations. First, as the centre of the research is information systems for hotels, it was hard to find literature on individual systems. Either because they are very unusual or very recent. This lack of literature leads to a second limitation: as a study about technology becomes obsolete quickly, this research might not be applicable in long- term research (Bilgihan et al., 2007). There is the need to remind the study to focus on technology, which is a constant change, leading to the NEC Model (Piccoli et al., 2011), perhaps to need revision or even misfit the current Portuguese context. Furthermore, it is challenging to investigate many questions to evaluate each stage's detail due to the respondents' limited availability. Lastly, it is essential to refer to the challenge of gathering the initial number of interviews planned.
As per future research, the suggestion is to segment the research more, focusing on newer information systems instead of the existing systems' entire pool. On the other hand, scrutinise incongruities registered to clarify any discrepancies between the classification and self-classification. Moreover, the accuracy of classification can be studied regarding the decision- makers profile or even the respondent. It would be possible to see which profiles are more aware of the information systems' maturity concept.
Overall, it would be especially interesting to use machine learning to predict the hotel's maturity level, given the hotel's characteristics, decision-maker profile, and the portfolio of information systems in the hotel from a more significant data set of hotels. This machine learning would allow the setting deeper the patterns of information systems in various types of hotels.
Furthermore, as we have stated, the research's relevance will increase once similar studies are made in different countries, allowing us to make comparisons and market positionings. It will also be interesting for hoteliers in different countries to use these papers for benchmarking. Once this research is applied in other countries or regions, there is the need to adapt to the hotel context, namely the weight of independent hotels and hotel types.

