SciELO - Scientific Electronic Library Online

 
vol.34 número2Uma Abordagem Sistematizada para o Diagnóstico de Lesões do Pescoço PediátricasCaso Clínico ARP nº 25: Ganglioneuroma Bilateral da Suprarrenal - Uma Causa Rara de Massa Retroperitoneal índice de autoresíndice de assuntosPesquisa de artigos
Home Pagelista alfabética de periódicos  

Serviços Personalizados

Journal

Artigo

Indicadores

Links relacionados

  • Não possue artigos similaresSimilares em SciELO

Compartilhar


Acta Radiológica Portuguesa

versão impressa ISSN 2183-1351

Acta Radiol Port vol.34 no.2 Lisboa ago. 2022  Epub 31-Ago-2022

https://doi.org/10.25748/arp.27825 

Casos ARP

ARP Case Report nº25: What is your diagnosis?

Caso Clínico ARP nº25: Qual o seu diagnóstico?

João Santos Silva1 
http://orcid.org/0000-0002-8760-7571

João Alegrio1 
http://orcid.org/0000-0001-6424-3042

Verena Pires1 
http://orcid.org/0000-0002-3538-7757

Henrique Donato1 

Luís Curvo Semedo1 
http://orcid.org/0000-0002-6441-227X

Cristina Marques1 

Paulo Donato1 
http://orcid.org/0000-0003-1153-3112

1Serviço de Imagem Médica, Centro Hospitalar e Universitário de Coimbra, Coimbra, Portugal


Case Presentation

A 68-year-old woman with a history of arterial hypertension and Gilbert´s syndrome was referred to a Gastroenterology consultation due to adenomyomatosis of the gallbladder.

Additionally, laboratory results reveal changes on liver tests and an abdominal computed tomography (CT) was initially performed. An incidentaloma on the second part of the duodenum was described (arrow). Then, the upper digestive endoscopy did not reveal any significant alteration and an abdominal magnetic resonance imaging (MRI) was performed for further investigation of this lesion. (Figs. 1, 2, 3) What is your diagnosis?

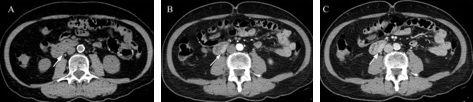
Figure 1: A- Axial soft tissue window, 2.5 mm slice thickness, non-enhanced CT; B- contrast-enhanced CT in arterial phase; C- portal venous phase. 

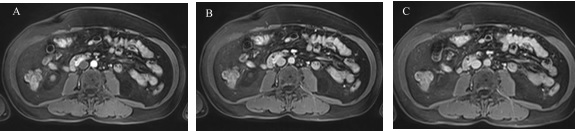
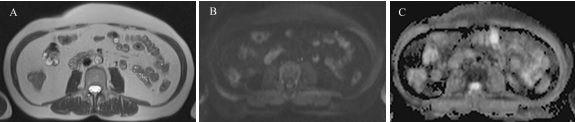
Figure 2: A- Axial contrast-enhanced T1-weighted fat suppressed MRI in arterial; B- portal; C- equilibrium phases. 

Figure 3: A- Axial T2 haste image; B- Diffusion weighted sequence on b700 image (DWI); C- Apparent diffusion coefficient map (ADC). 

Creative Commons License This is an open-access article distributed under the terms of the Creative Commons Attribution License