


 English (pdf)
 Article in xml format
 Article references
 Send this article by e-mail
 Cited by SciELO
  Similars in
SciELO
Similars in
SciELO 
 Permalink
1. Introduction
In this paper, we present research conducted between researchers in information design and literary scholars working in the area of genetic criticism (GC). GC is an approach to the study of literature that inquires about the genesis of literary works. It can be defined as “any act of interpretation or commentary, any critical question or answer that is based directly on preparatory material or variant states of all or part of a given text” (Falconer, 1993, p. 3). Scholars working in GC mainly focus on manuscripts (such as drafts, lists, clean copies, and annotated documents) but also analyze printed or digital versions of texts. A particularly relevant concept in the field of genetic criticism is the genetic dossier: a group of plans, sketches, drafts, and clear copies that testify to the project of a literary work (Grésillon, 2014, p. 242); genetic dossiers represent scholars’ interpretive statements about the creative work of an author.
Our work revolves around the project «Gustave Roud. Œuvres completes», based at the University of Lausanne and funded by the Swiss National Science Foundation, which aims at publishing a printed and a digital edition of the work of Gustave Roud (1897-1976), a Swiss poet, photographer, and translator, also active in arts and literary criticism.
The goal of design researchers is twofold: (G1) to inquire about the space between visualization and GC (which currently appears as an under-explored area, see 2.2) and provide insights and advice on how to pursue collaborations with scholars involved in the field; (G2) to design a new visual model for the analysis and presentation of data of genetic criticism, usable by a public of domain experts that goes beyond the ones involved in this research (Fig. 1).
2. Preliminary works and reviewing the landscape
Before starting the collaboration with designers, scholars reviewed the literature and analyzed Roud’s materials, mostly stored at the Centre des littératures en Suisse romande of the University of Lausanne. This preliminary exploration (Christen & Spadini, 2019) 3 unveiled how the genesis of Roud’s works is grounded in his diary, where he used to jot down initial elements that later traveled across several supports like notepads, agendas, or individual sheets. Drafts can be copied, selected, and remixed before ending up in periodical articles or poetry compositions. Another hallmark of Roud’s production is the post-editorial reuse, which consists of the incorporation of a previously published text into a poetry collection or in pieces of literary criticism. In these cases, a fragment can become a newly independent text or a portion of a new composition. The process demonstrates Roud’s instinct to work as an assembler, trying to stabilize what is scattered and dispersed in fragments or fleeting impressions.
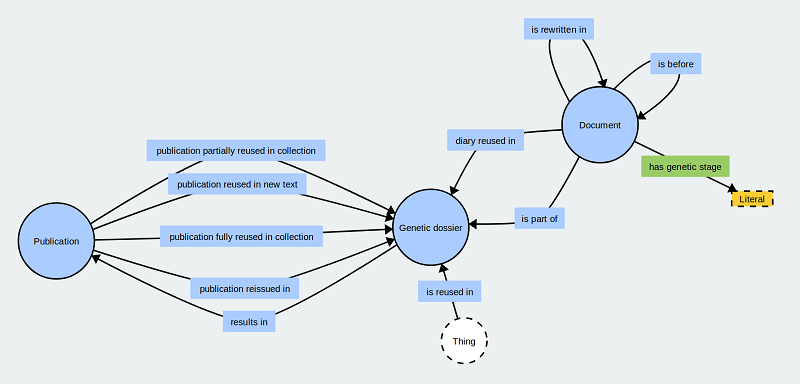
In the process of data collection, manually conducted on Roud’s archive, scholars created a data model formalized as an OWL ontology (Fig.2). Nodes represent documents of different kinds: publications (like books or articles), parts of publications, manuscripts (preparatory materials and diary entries), parts of manuscripts, genetic dossiers, and periodicals. Links represent the relationships among documents and indicate if materials are reused in genetic dossiers, published in periodicals, rewritten in a different form, or are part of a bigger textual unit.
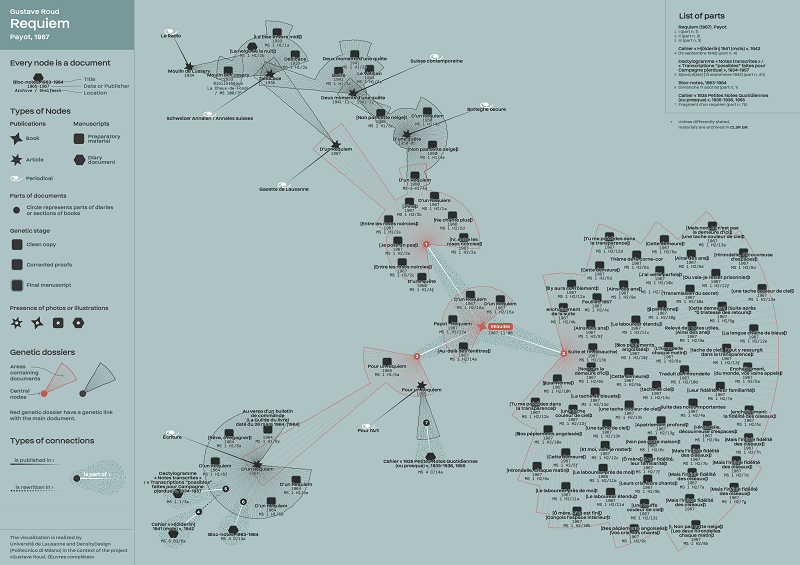
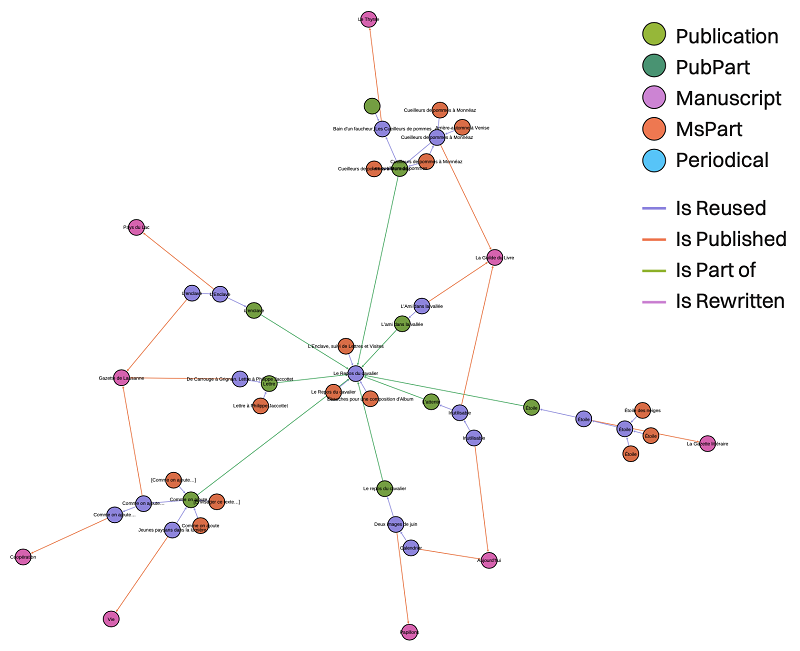
Contextually, scholars created preliminary network visualizations (Fig. 3). Nodes are shaped according to their type of document and are positioned taking into account dates and links with other elements. Links are represented as directional arrows and colored according to the kind of relationship they represent. Genetic dossiers are displayed as individual nodes that collect groups of documents highlighted with colored backgrounds. In dissemination activities, scholars employed these visualizations to represent the most predominant stylistic features of Roud’s work.
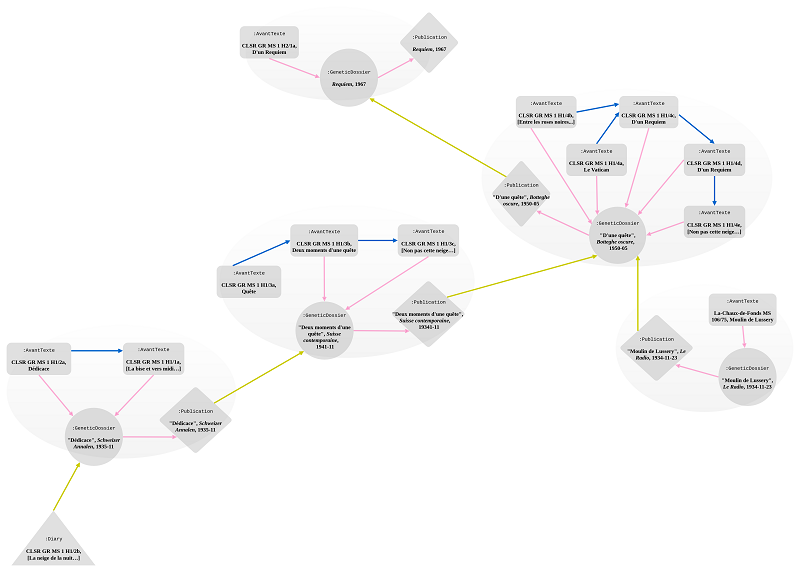
Fig. 3 Preliminary visualization created by scholars. It displays the genetic network of a portion of Requiem Source:Christen & Spadini, 2019, p. 97 3
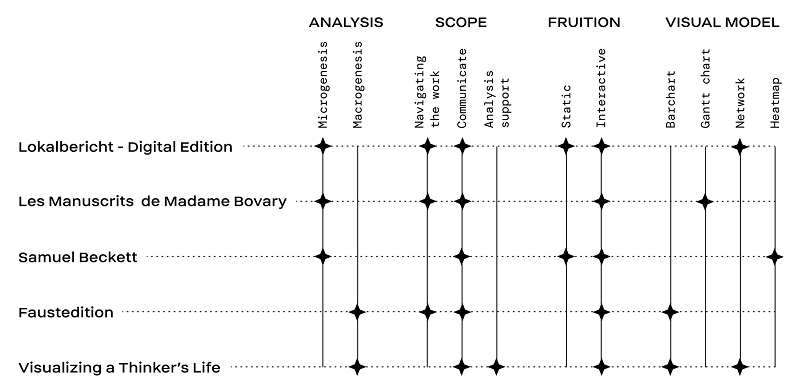
The previous work done by scholars was integrated by the design team with a review of existing analytical visualizations of genetic materials (Pallacci, 2022, pp. 59-77). From an information design standpoint, genetic criticism is still a niche field. We retrieved a limited amount of case studies which revealed some limitations nonetheless (Fig. 4). First, they are not easily accessible, or they are not completed. Second, they usually encompass the analysis of a single work, while our study required showing the genesis of multiple works of a single author.
3. Methodology
Designers organized the process in a series of activities that entail scholars’ involvement (Fig.5).
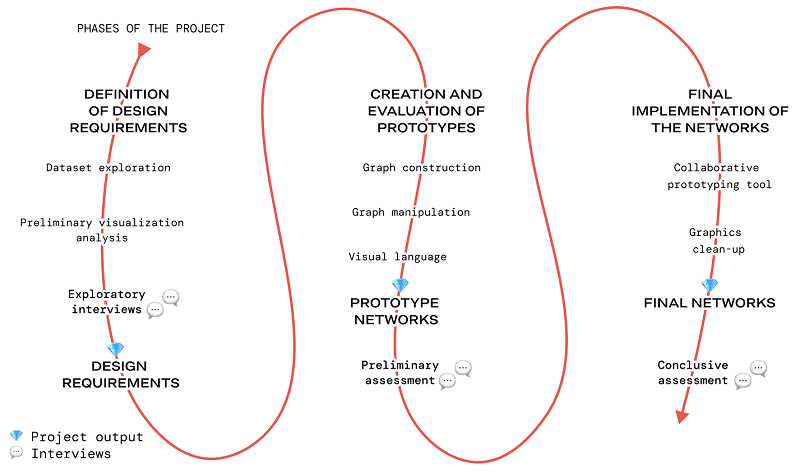
Fig. 5 The research process is structured in a total of three moments, where each section is validated through interviews with domain experts. Source: The authors
3.1 Interviews and visual explorations
As a first step, designers used structured interviews (Seidman, 2006) 5 to learn about genetic criticism and scholars’ goals. The activity is conducted with three scholars who performed the data collection and shed light on the figure of Gustave Roud, on data collection decisions (see 2.1), and on scholars’ visualization exigencies. In particular, it clarified the nature of genetic dossiers: in data and preliminary visualizations, they are represented as individual nodes, even if they differ from publications and manuscripts in that they indicate hypotheses on the genesis of a work, which could change with the evolution of scholars’ knowledge and the availability of materials.
As a result of the preliminary visualization’s analysis, some useful points also emerged: (1) there is the need to visually represent the genetic dossiers by distinguishing them from archive materials; (2) nodes are positioned in space both based on their relationships and, where possible, on the chronological order of publication; (3) genetic networks take very different shapes and sizes. In parallel, we familiarized ourselves with the data available through visual explorations (Fig. 6), which revealed the existence of complex genetic structures, made up of several nodes.
3.2 Definition of design requirements and evaluated criteria
The previous activities resulted in the formulation of four design requirements that addressed and guided the rest of the design process. Visualizations ought to: be designed for an audience of domain experts; explicitly communicate that genetic dossiers are interpretive layers; differentiate between a wide range of document typologies, clusters (i.e., genetic dossiers, and works separated into parts), and relationships; mediate between the complexity of the data model created by scholars and the legibility of network visualizations.
The definition of requirements allowed the definition of three criteria for evaluation (see 4.2): to effectively enable the encoding and decoding of information related to genetic studies (E1), to be used for representing multiple works of a single author (E2), and to evoke interesting aspects of the author’s creative practice (E3).
3.3 Creation and evaluation of prototypes
As a first step, by building on the outcomes of the interviews and data explorations, designers suggested treating genetic dossiers not as independent nodes but as groups of preparatory materials that converge to a resulting publication (Fig. 7).
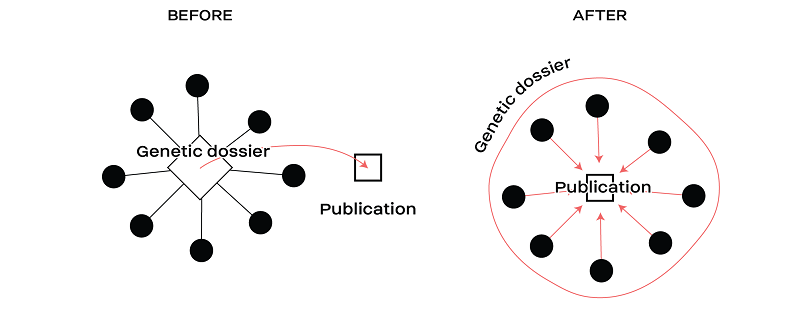
Fig. 7 While the initial visual model uses an additional node to represent genetic dossiers, designers’ to represent the genetic dossier as a group of materials encircled by a graphical sign. Source: The authors
Second, following a consolidated strategy aimed at improving comprehension and memorability of visualizations through embellishment (Bateman et al., 2010) 6, designers identified a metaphor to synthesize a language for the visual encoding of data. They analyzed three options (Fig. 8) and identified opportunities and limitations for data translation (Fig. 9).
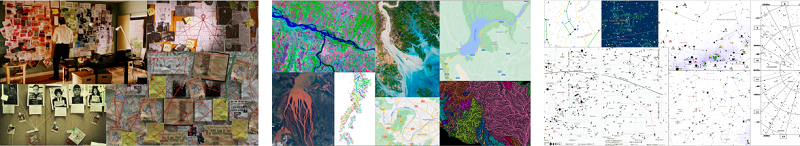
Fig. 8 Images used to evoke the three metaphorical spaces in the discussion between scholars and designers. From left to right: detective board, fluvial network, and celestial map. Source: The authors
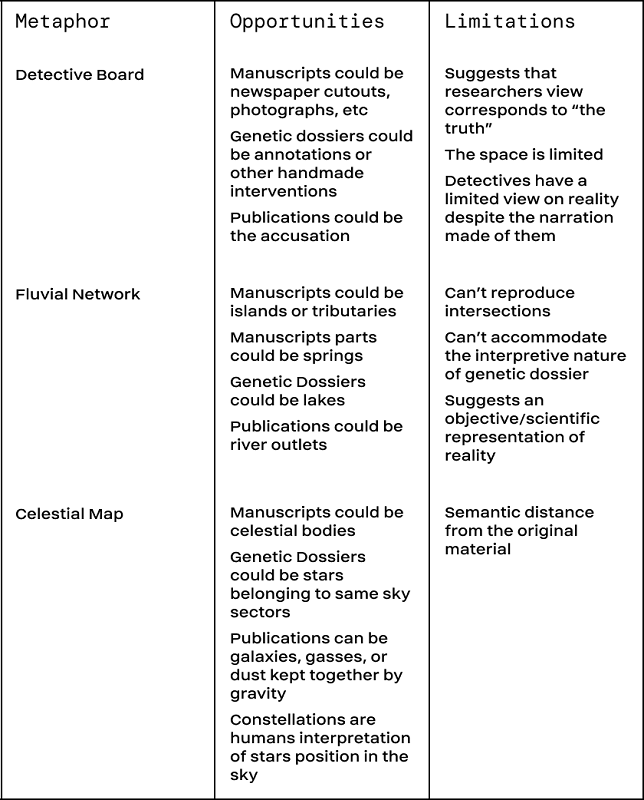
Fig. 9 The opportunities and limitations of possible visual metaphors identified at the moment of discussion. Researchers selected celestial maps and further worked to create the metaphorical visual encoding of data. Source: The authors
Designers adopted the idea of celestial maps, considering also Roud’s own interest in stars. The most promising aspect of this type of map is the one related to the nature of constellations, namely conventions created for memory and orientation and affected by the perspective from which we look at the sky. The same applies to the archive of Gustave Roud, whose study is influenced by the choices made by researchers who, for instance, could have used a different ontology. Additionally, the metaphor of celestial maps resonates with the idea of models of knowledge (i.e., theories, traditions, approaches, interests) that are embedded into the hermeneutical work of humanities (Drucker, 2014, pp. 190-191). After creating the visual language (Fig. 10), we crafted three draft visualizations on which to perform an evaluation with a domain expert not involved in the visualization design. The interview highlighted the successes and failures of the visualization outcomes (Pallacci et al., 2022): the expert was able to read the networks and formulate hypotheses, but the hierarchies of nodes and the composition of the networks needed improvements.
4. Results
4.1 Design outcomes
The design process created two outputs: a prototyping tool that produces semi-finished visualizations (Mauri & Ciuccarelli, 2016) by automatizing parts of the visualization process and the ten final genetic networks (one for each publication).
4.1.1 Prototyping tool
The tool is a code notebook written in Javascript (Elli et al., 2022) that loads scholars’ data from a GitHub repository and produces semi-finished visualizations in the format of editable vectorial images.
The semi-finished visualizations employ force-based spatialization algorithms (Jacomy et al., 2014) to position the nodes of the network and employ a consistent part of the visual encoding. Since they visually exposed for the first time the data and the structure of the ontology, they allowed scholars to identify and fix inaccuracies in data, like the lack of metadata for certain nodes. The task was simplified by the implementation of dedicated visual markers (Fig. 11).
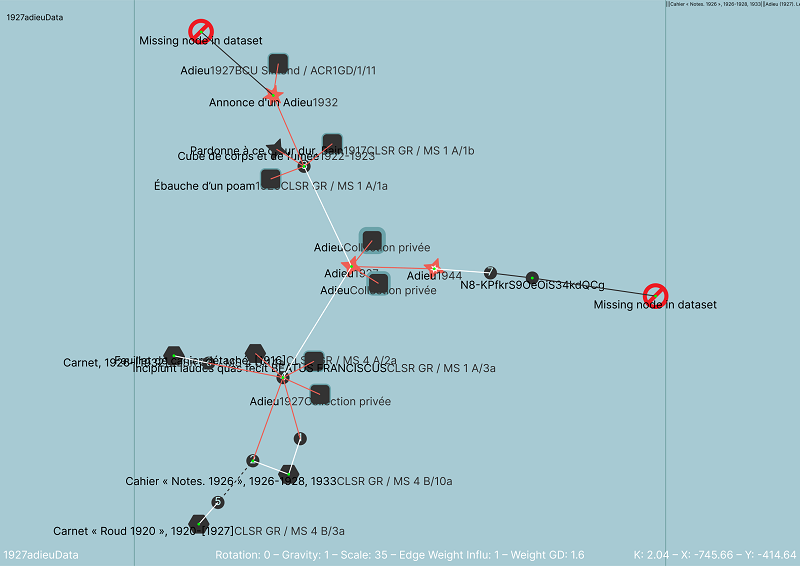
Fig. 11 A semi-finished visualization of Adieu (1927). The code notebook transforms JSON-LD files of the ontology into a table of nodes and edges (2.2 Visualization process) that are rendered as a network using Graphology (Plique, 2022) and D3.js (Bostock et al., 2011). In the bottom part, the semi-finished products report technical parameters to simplify the visualization process. Title and legend are manually applied in latter stage. Source: The authors
A total of ten semi-finished visualizations were created and finalized with the use of vector editing software (i.e., Adobe Illustrator). The outcomes are then evaluated by experts in the field of genetic criticism (see 4.2).
4.1.2 Final genetic networks
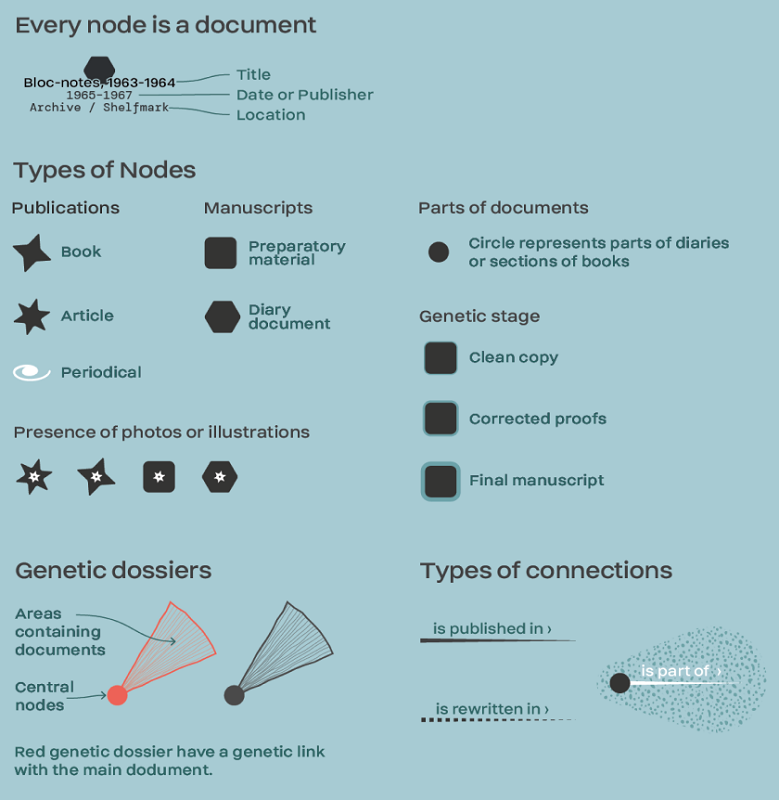
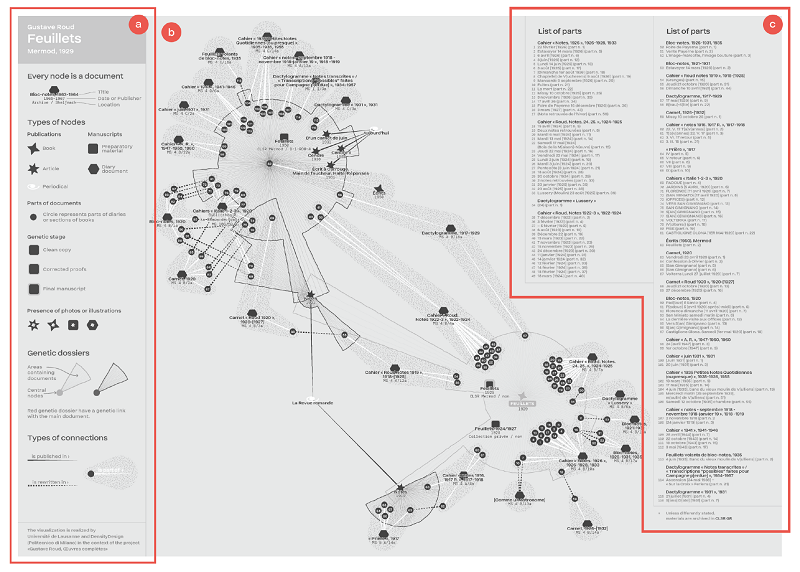
The visual layout of the visualizations divides the space into three areas: (a) the left part contains title and legend, (b) the center contains the network, and (c) the right part lists part-of titles, removed from the network to reduce clutter (Fig. 12).
The ten visualizations vary from one another on different aspects: Adieu (1927) and Haut-Jorat (1949), for example, are the two smallest networks, highlighting how the author used little material already written. On the other end of the spectrum, Campagne perdue (1972) is the most complex network in the body of works, with the highest number of genetic dossiers (Fig. 13).
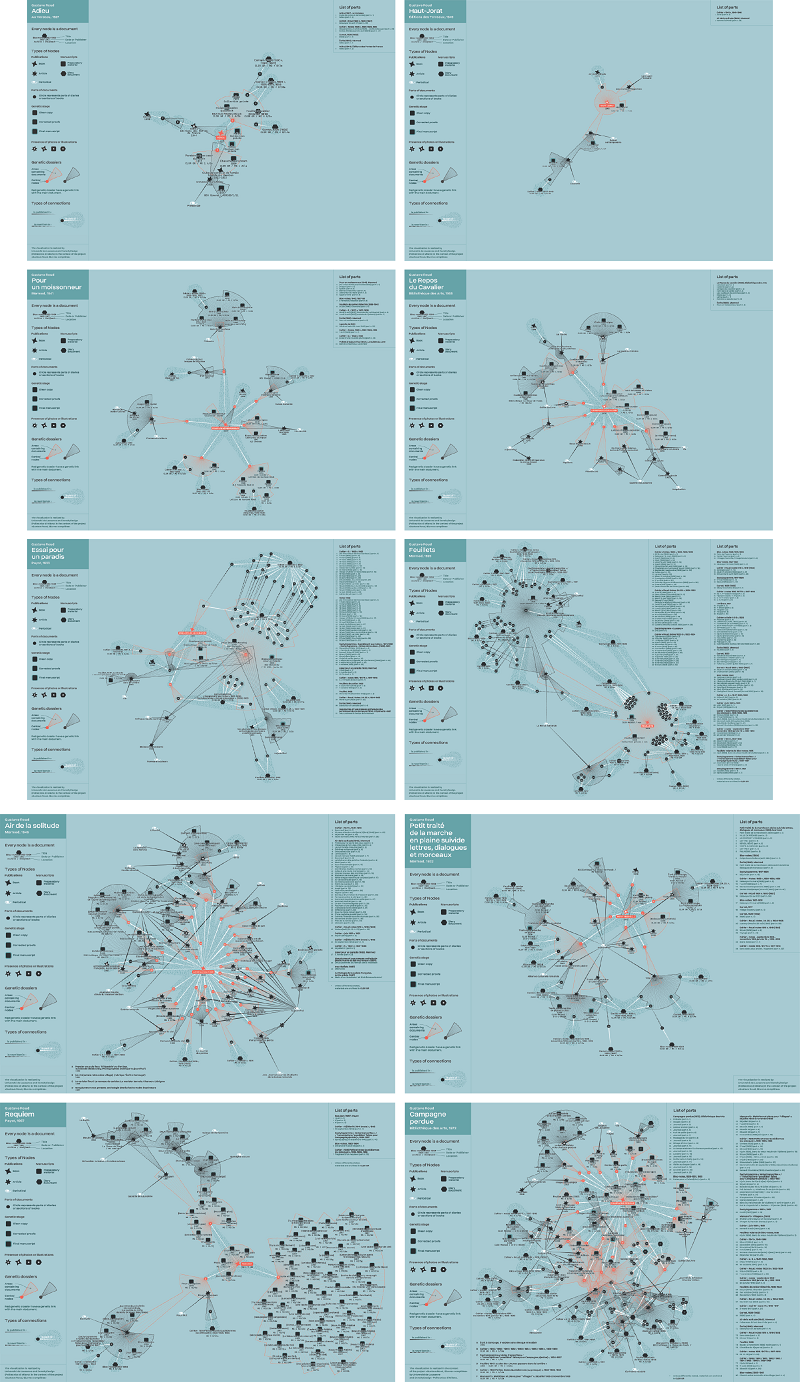
Fig. 13 (a) e (b) - Each network represents the genetic process of one of the ten publications included in the edition. They are available on the web page dedicated to each publication. Source: The authors
The poetic characteristics outlined in Section 2 can be visually identified in the networks. Post-editorial reuse, that is, the reuse of a published article within the genetic dossier of a poetry collection, occurs in all networks and is visible thanks to the distinctive graphical elements used for periodicals and genetic dossiers. Diary reuse is also widespread and seeable by the accumulation of small circles or dots (see, for example, Feuillets). It is interesting to see how sometimes diary notes from the same notebook are reused in different articles and then reunited when these articles are repurposed in the genesis of a single book (Feuillets and Campagne perdue). The rewriting of diary notes from one support to another is represented in the “marionette” structure (see, for example, Essai pour un paradis). Lastly, a unique case in which the archive preserves a large number of preparatory materials such as drafts and lists is “Part III” of Requiem, the largest structure of this type that visually emerges.
4.2 Conclusive evaluation
The conclusive evaluation of the ten network visualizations is based on three criteria previously described (see 1). For E1 and E3, designers conducted a usage test with three experts from an Italian Digital Humanities mailing list. They familiarized themselves in advance with the visualization of Petit traité de la mache en plaine and were then asked, in an online interview, to read aloud the entire visualization, sharing doubts, ideas, and comments. In a second step, they were required to read a specific part of the visualization and to describe, also by speculation, what they understood of Roud’s process. After initial accommodation, experts’ reading became much quicker; they expected the networks to be intricate because they were aware of the complexity of the represented information. From an overall perspective, they considered as appropriate the structure and the visual encodings of the visualizations (E1). Nonetheless, the evaluation highlighted elements in need of further improvements: the main publication must be more recognizable since experts still had a hard time identifying it and started the reading from the geometric center of the network; the genetic stage of manuscripts, displayed using the stroke width, is not readable and must be made more evident; the encoding of links directions is difficult to remember, suggesting the need for more self-evident solutions such as the use of arrows.
While reading the visualizations, two experts formulated interesting hypotheses regarding Roud’s creative practice: about his habits of reusing parts of published works and about the centrality of its diary in his genetic process, promoting the idea that networks can be used to support GC studies (E3).
For E2, designers informally collected feedback from the involved researchers once the ten networks were done. Although the work is generally satisfactory, two edge cases emerged: Campagne perdue and Air de la Solitude. They constitute such complex datasets that it is impossible to represent all the labels and all genetic dossiers with clarity. The cases suggest the need for a simplified version of the visualization (e.g., showing less information) and/or a different format (e.g., interactive chart). The researchers positively evaluated the eight remaining visualizations (E2).
5. Conclusions
The article illustrates the joint research effort of design researchers and literary scholars around the creation of a visual model for supporting studies of genetic criticism. The presented results are included in the digital edition of Gustave Roud. Œuvres completes (Jaquier & Maggetti, 2022), where each poetic book is accompanied by a genetic network visualization that presents the creative process of the author.
The design process required a suitable representation of the interpretive layer developed by literary scholars (see 3.2). Therefore, visualizations differ from the ontology model in the representations of genetic dossiers, rendered as visual enclosures rather than network nodes. Finally, the networks use a visual metaphor - celestial maps - to create a visual encoding for the networks and support memorability.
We can extract useful recommendations from the research documented in this paper to address the design of visualizations in the area of genetic criticism; we believe such advice could be beneficial also in other settings characterized by pronounced disciplinary gaps. (1) It is important to dedicate time to the understanding of experts’ and stakeholders’ goals; such preliminary activities are fundamental in informing the design process but also in balancing stakeholders’ expectations and in defining the design requirements in a shared way. (2) The early evaluation of ecologically valid prototypes (i.e., functional in the context for which they are designed) allows rapid detection of issues and the identification of solutions before the complete implementation of the project. In the presented work, the analysis of draft visualizations (see 3.3) enabled the confirmation of design choices and the identification of improvements, thanks to the fact that they already possessed all the features of the final products (real data, legend, visual language, format, etc.). (3) Adopting tools for the reduction of the manual work entailed in the implementation of graphically sophisticated visualizations not only speeds up the making of final products but, most importantly, opens to further iterations dedicated to the enhancement of data, which may benefit from adjustments also because manually collected from the archive materials. These recommendations may be useful in shaping future collaborations between information design and humanities scholars.

