


 Inglês (pdf)
 Artigo em XML
 Referências do artigo
 Enviar este artigo por email
 Citado por SciELO
  Similares em
SciELO
Similares em
SciELO 
 Permalink
1.Introduction
Building a community of learning among teachers has been suggested as an important factor for improving teachers’ teaching quality and, consequently, students’ learning. The volume of qualitative studies of teachers’ learning communities is impressively vast (e.g., Buysse et al., 2003; Vangrieken et al., 2015, 2017; Vescio et al., 2008). A commonly discussed methodological problem in this field is that the study of communities of learning tends to generate large amounts of qualitative data, such as conversation data. The analysis of such data sets is both time-consuming and cognitively demanding, which further encumbers the possibility of applying established interpretive qualitative approaches, such as Critical Discourse Analysis or Hermeneutic Analysis.
Recently, the use of approaches from data science has been suggested as a solution to this problem. According to these suggestions, data science can provide instruments capable of overcoming the limitations of established qualitative methods by automatizing the analysis of qualitative data (Hvitfeldt & Silge, 2021; Janasik et al., 2008; Rose & Lennerholt, 2017; Wiedemann, 2016; Yu et al., 2011).
The most discussed application of data science to qualitative research seems to be the automatized identification of topics in text data (Hvitfeldt & Silge, 2021; Janasik et al., 2008; Rose & Lennerholt, 2017; Wiedemann, 2016; Yu et al., 2011). When automatized methods are used in this way, algorithms are substitutes for human interpreters (Rietz & Maedche, 2021). Therefore, the solution to the time and cognitive demands problem above is solved by letting algorithms do the researchers’ job. If the algorithms are accurate and efficient, the coding and categorization of data will be quick and reliable. However, the kind of theoretical approach to the interpretation of qualitative data that is typical for interpretive qualitative research, characterized by complex theoretical constructs and context-dependent interpretations, is difficult to automatize.
The literature that discusses the application of data science to qualitative research shows here an interesting gap. As we mentioned, the main function of the algorithms is to mimic human interpretation and ideally substitute the human interpreter. To our knowledge, only one example of discussion exists about how to use algorithms as an integrated part of the humanistic interpretation process (Chen et al., 2018). Chen et al. provide an example in which algorithms can be used to support collaboration between researchers using qualitative methods. However, their discussion does not concern the interpretation process per se. When interpreting qualitative data, researchers use several resources such as theoretical or symbolic, so the question left unanswered is if data science can be used to generate further useful resources rather than to substitute the researcher. Hence, the question motivating our discussion in this paper is:
• Can data science algorithms be used as an integrated part of the interpretive qualitative analytical process, rather than as a substitute for it?
In this paper, we suggest that a positive answer to this question can be provided by using algorithms as basis for data visualization rather than for analysis. By data visualization we mean graphical representation of data. Therefore, a set of procedures for producing visualizations of conversation data is presented. These procedures are based on topic modeling and supervised classification algorithms applied to conversation data transcriptions and are used to construct diagrammatic data models of how the participants chronologically move from topic to topic during a group discussion.
The crucial aspect of this approach is that - although the procedure for the construction of these visualizations is based on probabilistic methods - these visual artifacts are intended to support qualitative interpretive analysis. What these visualizations do is represent conversational exchanges as geometrical patterns which can be interpretively analyzed using, for instance, critical discourse analysis or grounded theory. Therefore, instead of doing the researchers’ job - that is interpreting the data - the algorithms are used to transform the data into symbolic resources that the interpreter can more easily manipulate.
An example of analysis of teachers’ conversation data generated from a research project on teachers’ professional development is used to illustrate the limitations and advantages of this approach. In particular, we discuss how to integrate these visualizations in the interpretive qualitative analysis of teachers’ collegial interactions - which in turn relates to the broader question of teachers’ professional learning. As we demonstrate, the way in which these visualizations can support the interpretive process is by reducing data, identifying patterns of interaction, and visualizing group-level learning phenomena. In sum, we contribute to the field of qualitative research methodologies by providing an approach to computer-assisted qualitative research that is more coherent with the interpretative spirit of qualitative methods.
2. The Case
In order to exemplify our approach, we consider an example of application of qualitative interpretive methods to teachers’ collective learning in which collegial discussion data is employed. By collegial discussions, we intend all planned events in which teachers meet to discuss issues related to their profession. Such discussions have been argued to constitute a context for developing and strengthening teachers’ learning communities (Vangrieken et al., 2015, 2017; Vescio et al., 2008). In a previous study (Kaufmann & Ryve, 2019) we analyzed teachers’ collegial discussions with the aim of theorizing about how the teachers’ role was constructed collegially. These collegial discussions were part of a large professional development program for mathematics teachers (Boost for Mathematics, BfM, Insulander et al., 2019, Steenbrugge et al., 2018), and the analysis of the collegial discussions resulted in the identification of three main discourses within which teachers tended to navigate and position themselves. Three discourses emerged from the analysis of collegial discussion data: a traditional discourse, a reform-oriented discourse (see, e.g., Kilpatrick et al., 2001; Munter et al., 2015; Valoyes-Chávez, 2019), and a democratic teacher role discourse. The three discourses can be summarized as follows:
Traditional teacher role: Teachers within such a role emphasize explaining ideas clearly, demonstrating procedures so students can follow them, and encouraging plenty of practice to enable students to execute the procedures quickly and accurately (Hiebert et al., 1997). Further, they emphasize the use of sequences of computational tasks, repetition, facts, procedures and definition prerequisites for other competences. They, however, tend to avoid cognitive load tasks. Students are presented with tasks that allow them to use and build on what they have just seen the teacher demonstrate, i.e. they practice by doing similar problems.
Reform-oriented role: Within this discourse, teachers emphasize the anticipation of student interactions and building on students’ mathematical thinking. They initiate and orchestrate discussions that elicit, engage and challenge students to think and interact. Teachers are in charge of framing these discussions so that students share multiple problem-solving strategies, analyze relations among strategies and explore contradictions in their ideas to gain greater insights into their mathematical thinking (Franke et al., 2007). They administer tasks that introduce students to new ideas and deepen their understanding of concepts. In this kind of classroom setting, students learn mathematics through problem-solving (Munter et al., 2015), and their interactions aim at forming a discourse community that shares values and assumptions (Munter, 2014).
Democratic Swedish role: This discourse is known as the facilitator of democratic citizenship, and it highlights social objectives. Its key components are equal opportunities and equal rights. In addition, it aims at fostering democratic citizenship and the development of a democratic mind and skills (Forsberg et al., 2016). This includes, for example, how to show respect, take responsibility and develop a critical and reflective attitude. The teacher role that is consistent with this discourse is motivating students to connect different subjects. Further, the teacher is expected to be a coach and make learning fun, while students are required to take responsibility for their learning, work with their peers and enjoy learning. If the students work individually, they should work at their own pace with minimal intervention from the teacher. Teachers are more preoccupied with the social aspects in the classroom than mathematical knowledge. This role can be considered to be part of discovery-learning (Alfieri et al., 2011) which emphasizes students’ motivation and asserts that students should discover facts and relationships by themselves, with a teacher only providing guidance upon students’ request (Ryve & Hemmi, 2019).
The analysis in our previous studies is based on a very small part of the collegial discussion data we collected, which amounts to 160 recorded discussions. Using the same fine-grained analytical approach to the data for the whole dataset would have been impossible. On the other hand, refining our analysis in light of a larger set of recordings could result in a more specified model of teachers’ positionings. In the following sections, we illustrate how data science approaches can be used as a workaround for this problem. As we show, we chose to focus on visualization in order to retain the interpretive character of our approach.
3. Algorithms for Automatized Categorization of Text Data
The first step in our approach consists in automatically categorizing the transcription of a new collegial discussion data set. This is not done in order to let an algorithm analyze the data for us, but rather as a first step in the transformation of the transcriptions into something we could use more easily.
We used two automatized categorization approaches. The first is topic modeling (Blei, 2012), and, in particular, Latent Dirichlet Allocation (LDA), which is a set of Bayesian algorithms used to fit a body of unstructured data to a model consisting of several topics. LDA is an unsupervised method, that is, a method that tries to guess what topics are present in a corpus of documents. However, we need the algorithm to check if the transcript coheres with our previous analysis (see section 2), and not to simply guess what the transcripts are about. Therefore, we use a semi-supervised version of LDA, i.e., the Seeded LDA (SDLA) (Watanabe & Zhou, 2022), in which a vocabulary of terms for each topic is used to constrain the LDA algorithm. Without going into the technical details of the statistical procedure, the output of SLDA is a probabilistic distribution of topics for each exchange in a discussion. Each exchange - every event in which a participant says something - will have an estimated probability (theta) for each topic, and the different thetas will sum up to one. The data set used in this paper is a collegial discussion among five teachers participating in the BfM program. They discuss the topic of proportionality, and the teachers are instructed to discuss their experience of teaching the concept of proportionality and of using different representations of proportionality. The data set includes 698 exchanges among the participants. As we mentioned, we want the algorithm to find exchanges in the data that are related to the topics. These topics are the three teacher roles discussed above. Furthermore, we want to know when the teachers discuss issues more related to mathematical content or to classroom activities, and when it is more related to more abstract concepts such as representation or mathematical reasoning. To identify exchanges related to these topics, the SLDA algorithm requires a dictionary of topic-specific terms. We constructed this dictionary using the coded data in our previous studies, literature, and social media data.
The construction of the topic dictionary involved the following steps. First, we created a text document containing a set of sentences for each topic. To build this document we started using the coded collegial discussion data from our previous studies. The methodology used to code the data is discussed in the studies (Kaufmann & Ryve, 2019). The codes are the same as the three discourses explained in section 2. Then, we searched publication databases SWEPUB and Google Scholar for articles in Swedish that explicitly discussed the different teacher roles. We searched for such terms as “traditionell lärarroll*” (traditional teacher role), “traditionell undervisning” (traditional teaching style), “katederundervisning*” (teacher-oriented instruction), “demokratisk lärarroll*” (democratic teacher role) and selected the publication that provided explicit descriptions of the different roles - all of which were student theses (Asoyan, 2013; Sjödin Fannoun & Perlman, 2019; Svedberg & Fjällström, 2010; Walfridsson & Sanfridson, 2016; Wester, 2015; Wittzell & Nilsson, 2012). All sentences in the publications that explicitly described a specific teacher role among those included in our coding manual were pasted in the text document. Next, we used the same search terms on Twitter to find tweets in Swedish discussing the different teacher roles. All tweets that explicitly discussed a specific teacher role included in our coding manual were pasted in the document. To simplify the process, we merged the democratic and reform-oriented discourses. The final document consisted of 11 pages and 61113 words, organized into three codes (Traditional, Democratic/Reformed, and Irrelevant). In the final step, we searched the text document for all terms that could discriminate between the different teacher roles, and the collegial discussion data for terms specific to mathematical content and for students’ reasoning. The list of these terms constituted the topic-specific dictionary. The final dictionary included five topics: mathematical content (MATH), concepts (CONC), traditional teacher role (TRAD), reformed or democratic teacher role (REF_DEM), and a residual topic (resid) that the algorithm uses whenever an exchange does not seem to fit any of the other topics. As soon as the dictionary was prepared, we used the R environment and the packages quanteda (Benoit et al., 2021) and seededlda (Watanabe, 2019/2022), to fit the SLDA model.
The second approach we used to automatically categorize the transcript is using a machine learning algorithm for classification, that is, a method that uses a statistical learning algorithm to automatically build a model of a given data set (Hvitfeldt & Silge, 2021). Classification algorithms are not quite as popular as a tool for qualitative data analysis, but their potential application scope in the social sciences is intuitively wide (Hvitfeldt & Silge, 2021). Essentially, provided a set of manually coded documents, a classifier is used to train a complex statistical model that can be used to classify automatically further documents. A classifier will model the textual features of each coded document and predict what code should be attributed to an arbitrary document.1 The manually coded text data we used are the same that we used to construct the topic-specific dictionary. The coding manual consisted of three codes, based on our previous analysis described in section 2: the traditional teacher role discourse (TRAD), the democratic/reformed teacher role discourse (DEM_REF), and a further code for all text that does not fit in either of the two theoretical codes (IRR).
The technical workaround we employed is simple and easily used by researchers with little or no background in machine learning. For this aim, we use the R package RTextTools (Jurka et al., 2020) which provides a simple approach and allows testing of several different classifiers (Jurka et al., 2013). The difference between the two approaches we used is that while the SLDA approach outputs a probability estimate for each code and for each exchange, the classifier only outputs a code for each exchange.
The output of the classifier approach was evaluated by selecting a random set of 30 automatically categorized exchanges and by assessing whether the categorization was correct. The classifier performed moderately well whenever it categorized exchanges using TRAD or DEM_REF (3 of 6 correct guesses), and very well whenever it categorized with IRR (23 of 24).2 The SLDA was evaluated by selecting the 8 exchanges that received the highest estimation for the four theoretical topics - that is, excluding the residual topic - and assessing whether the exchange fit with the estimated topic. The algorithm estimated correctly 11 of 32 times (35,4%), which is a moderately poor performance. However, it is important to keep in mind that the aim of this paper is not to propose or recommend a specific approach to the automatized categorization of qualitative data. Our aim is to illustrate how visualizations based on automatized categorizations can be used in the interpretation process. In other words, we propose how to use categorization algorithms to generate visualization assuming that a valid categorization approach is available. In the remainder of this paper, we will assume that the modeled topic estimates and classification are valid.
4.Visualizations of Collegial Discussions Data
Once the categorization step is clear, we use different R packages to generate the visualizations. The main package used is ggplot2 (Wickham et al., 2021), although certain cases require additional packages.3 In this section, we showcase different forms of visualization and discuss their potential use. All the visualizations in this section and in section 4.1 are based on the SLDA categorization, whereas the ones in section 4.2 are based on the classifier categorization.
The first visualization we discuss (Fig. 1) is the streamgraph, for which we use the ggstream package (Sjoberg, 2020/2022). This visualization enables researchers to see how the distribution of different topics changes over time (operationalized as exchange sequence number) of the collegial discussion.

The main information that is conveyed with the streamgraph is if the discussion converges into one or several thematically homogeneous periods. The streamgraph aggregates participants and only looks at the group level. This perspective is helpful if the research focus is on consensus or convergence building in collegial discussions (Steenbrugge et al., 2018). The streamgraph above shows a phase in the collegial discussion in which different topics are varied, with a low level of group convergence. If the SLDA model is fairly valid, convergence should be observed as a wider area of fewer colors dominating an exchange interval. A further dimension about which the streamgraph can provide insights is the chronological succession of thematic predominance. By looking at how the colors change along the horizontal axis, it is possible to identify in what succession the topics are discussed, which can be an element supporting the in-depth qualitative interpretive analysis of the transcription. For instance, around exchange 300, in Fig. 1, it is possible to see a concentration of exchanges about the topic of mathematics (colored in yellow).
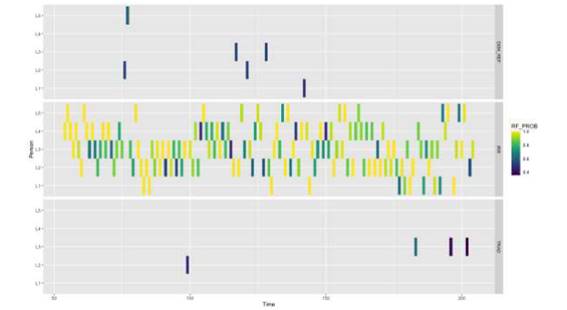
Heatmaps (Fig. 2) can be modified to fulfill the same function as streamgraphs, by putting time (seq) on the horizontal axis and letting color represent the various thetas.

Heatmaps have the advantage - compared to streamgraphs - of making deviating exchanges more visible. In Figure 2, it is easy to see the spike around sequence 30, indicating that the exchanges converge quickly to a discussion about concepts and about the traditional teacher role. The disadvantage of this visualization method is that patterns become difficult to identify whenever more than 50 exchanges are visualized. If this method is chosen for more than 50 exchanges, we recommend splitting into separate diagrams stacked vertically.
5.Introducing Agents
Interaction among participants in collegial discussion is typically a theoretically central aspect of the analysis of collegial learning. Here we introduce two main ways of including participants in the visualization of the distribution of topics over time. The first way is to use bubble graphs (Fig. 3), in which agents are organized as panels (L1-L5), topics are represented as lines inside a panel, exchanges’ topics are represented as colored circles, and topic probabilities are represented by the radius of the circle.
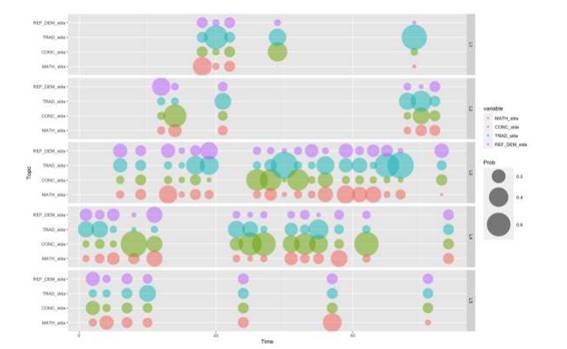
As Figure 3 shows, bubble graphs visualize in a clear way the thematic chronological change for single agents. Larger bubbles indicate the most probable topic for a specific exchange, making it possible to follow how the focus of single agents changes over time. By organizing agents in separate panels, it is also possible to study the dynamics of the conversation. For instance, Figure 3 shows a phase - between exchange 20 and 40, in which agents L3, and L4 interact, both with a focus on concepts and traditional teacher role. The final approach to visualization of our SDLA modeled conversation data uses line diagrams (Fig. 4). These can be used whenever the focus is on identifying a trend in a specific time interval.

Figure 4 above conveys basically the same information as Figure 3 but can be a better visualization choice whenever the focus of research is on group convergence. When the lines converge on the uppermost part of the panel, then the probability is high that all participants are converging on a topic.
6.Visualizations with Classifiers
Classifiers have categorical outcomes, in contrast to topic models. The visualization of the classified conversation data does not represent the probabilities of all topics for each exchange, but the probability of a single categorical attribution for each exchange. The bubble and mosaic diagrams above can be simply modified to represent the classified data.
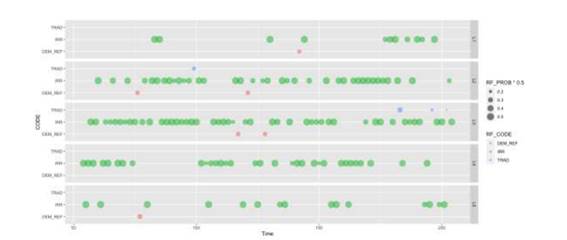
Figure 5 shows that by only attributing one code to each exchange, the RT classifier produces a sparser visualization that can be helpful to identify critical incidents in the data. The final visualization of this paper (Fig. 6) organizes codes into panels for an easier identification of group convergence over a specific code.
7.Visualizations as Tools for Qualitative Analysis
In our previous study, we analyzed the interactions among teachers during a set of collegial discussions, with the aim of identifying how teachers positioned themselves within the different discourses. Methodologically speaking, we attempted to interpret the transcriptions as signs of their positioning and to draw a theoretical conclusion from these signs. This conclusion is summarized by the taxonomy of discourses we summarized in Section 2. In this section, we ask how the visualizations above can help us in this process. We are not interested in providing statistical support to our theorization, but rather in how we could use the visualizations to refine our theory, find further interesting dimensions, and expand theoretical insights about teachers’ collegial interactions in the data.
Our theoretical perspective conceives visualizations and diagrams as tools for inference, that is, artifacts that sanction competent researchers drawing a conclusion about a target (Suárez, 2003; Matta, 2014). Therefore, from this methodological perspective, we discuss what kinds of conclusions can be sanctioned by the visualization above. Diagrams become, from this perspective, further qualitative artifacts that are used together with the transcriptions to form a theory about our target phenomenon.
8.Visualizations can Support Identification of Critical Incidents
Qualitative data analysis is not primarily concerned with frequencies. Frequent use of specific linguistic construction can be a sign of the intention to convey some relevant meaning, or of the presence of a communicative norm. However, not all relevant meanings and disciplinary norms are signaled by frequency. As McPherson and Thorne (2006) have argued, in many cases, exceptions can signal meaning or enactment of a norm. Therefore, qualitative data analysis is often concerned with the identification of critical incidents (Flyvbjerg, 2006). Several visualizations in the previous sections can be helpful tools for the identification of such incidents. Isolated spikes in themes or codes represented with swift color or form changes in Figures 2, 4, 5, and 6 can be used in this way. In this case, color and shape are not used to study the frequency of codes or topics, but rather to look for changes in the conversation interaction that can reveal events that have relevance to the research aim. The fact that an actor suddenly changes the focus from the traditional role discourse to the reformed-based role discourse might be a sign that the actor intends to put these two discourses in contrast, maybe contrasting what other agents have said. Therefore, the dynamic and chronological dimension of the discussed visualization is of primary importance: collegial discussions are processes. Such a contrastive activity would provide indications that not only the reformed-based role has a specific discursive content, but that it also has a contrastive character. To position oneself in this discourse is to position oneself away from something else.
In more concrete methodological terms, these visualizations can be used as data reduction tools. When the volume of the data is too large for manual scanning, researchers can transform the data into color and shape patterns to be able to scan larger chunks of data in a less cognitively demanding way.
9.Visualizations can Represent Patterns of Interactions between Discourses
According to several theoretical perspectives, discourses can be dialectically related to one another (Fairclough, 1992). Negotiations of meaning can entail changes in the role of discourse in a discoursive field (Fairclough, 1992; Winther Jørgensen & Phillips, 2002). A way of refining and deepening our theoretical taxonomy of discourses is to identify and explicate conceptual relationships among the different discourses. Can further data analysis cast light on how these discourses are related with one another? Is it possible to study the interdiscursive activities in the collegial discussions? How do elements of different discourses travel from one discourse to another, and what function do these translations have?
In order to be able to draw conclusions that are relevant to these questions, it is necessary to identify patterns of movements from one discourse to another. More specifically, the process that precedes and leads to a convergence might provide indication of this. These patterns can be visualized as clustering of or a convergence to similar topics or codes, such as in Figures 1, 3, and 4. These diagrams show phases in the discussion where interactions lead from different foci to the establishment of a special common focus (signaled by convergence). This might represent interdiscursive dialectical relations in which the content of one specific discourse is used as a bridge to another.
In this case, the role of visualization is not only that of data reduction, but also that of data transformation that can lead to the formulation of speculative ideas about which discourses are related to one another. These speculative ideas can thereby be investigated by looking at the content of the identified interactions among the discourses.
10.Visualization can Represent Group Learning
From a theoretical perspective (Insulander et al., 2019), collegial learning can be conceptualized as changes in agency. Teachers’ professional development is not only - at this level - a matter of developing forms of propositional knowledge, but also the development of a collegial practice that is concretized in the participating teachers’ agency. Therefore, a refinement of our theoretical taxonomy can consist of looking at these discourses from the point of view of agency: how is agency mediated by the different discursive practices? Do the different discourses about teacher roles seem to facilitate collegial agency? In order to study these questions from a qualitative point of view, it is necessary to connect patterns of thematic changes with patterns of interactions among agents. Visualizations in Figures 3, 4, and 6 might provide representations that afford this kind of conclusion. By organizing themes into panels and agents into lines within the panels, it is possible to study patterns of agential convergence toward a topic or code. Some codes or topics might show patterns in which only some agents are in the focus, whereas some other topics or codes might show a higher group participation and involvement. This might signal the kind of establishment of a common vocabulary that can be interpreted as a sign of higher collegial agency.
In this case, too, the role of visualization is both that of data reduction in helping researchers to find critical incidents in the vastness of the data and that of identifying patterns that generate speculative ideas (is this involvement a sign of high collegial agency, and does it depend on this specific discourse?).
11.Conclusions
In this paper, we have presented a set of visualization methods for collegial discussion data. These visualizations are based on statistical analyses but are not conceived as a way of making qualitative analysis quantitative. Instead, our main contribution is - coherently with the aim we stated in the introduction - to show how to transform quantitative probabilistic estimates into visual artifacts and to consider these artifacts as further qualitative data that may support interpretive qualitative analysis, but not substitute it. Our intention is that these instruments will be useful for researchers using qualitative methods and, at the same time, that they might stimulate methodological discussions about how to advance the development of qualitative methods without changing the spirit that motivated them.

