


 Inglés (pdf)
 Articulo en XML
 Referencias del artículo
 Enviar articulo por email
 Citado por SciELO
  Similares en
SciELO
Similares en
SciELO 
 Permalink
Introduction
The transition from childhood into adolescence is characterized as a period of growing independence, regarding day-to-day life’s decisions, including eating choices [1,2]. The relationship between normal dietary intakes and health can be assessed by several methods. The food frequency questionnaires (FFQ) are typically used in large-scale investigations [3,4]. From a fixed list that represents the most commonly consumed food items by the target population studied, during a particular period of time (days, weeks, months or years), the participants select the most consumed food items and the usual portion sizes consumed over that period of time [5,6]. The portion sizes are used for nutritional and energy quantification [6].
In nutrition research the need to estimate reliable and accurate dietary data is of crucial importance [7,8], and despite the extensive use of FFQ, it is recognized that many published surveys may neither reflect true intakes [9] nor be valid and reliable for the target population [10]. In this context, it is recognized that FFQ should be valid and the collected dietary data carefully analysed and interpreted [11]. Despite recognizing inherent sources of measurement error, the FFQ is still considered the method of choice for assessing dietary data in large-scale nutritional epidemiological studies [12], as it is convenient, cost-effective and has a low respondent burden [5,6,13].
Because there is no consensus in the literature concerning the best statistical approach to assess the validity of an FFQ, it has been suggested to use more than one statistical method to reinforce results. Accordingly, more than one statistical approach was employed in order to minimize the weaknesses and improve the quality of the data. Because a true validity (FFQ) assessment is unfeasible, a relative validity was chosen by comparing the FFQ to another dietary assessment method (e.g. 24-h dietary recall) in spite of the fact that any dietary assessment tool has its own errors in assessing true dietary data [14].
A review on validation and reproducibility of FFQ identified seven studies, developed to measure adolescent food intake in Europe [15]. However, and to the best of our knowledge, few studies have been conducted on Portuguese adolescents, and as far as we are concerned, no valid FFQ is available for Portuguese adolescents. As a result, and due to the lack of valid methodological tools to assess food intake of Portuguese adolescents, the associations between diet and health issues have been rarely done [16, 17, 18]. Therefore, the aim of this study is to assess the relative validity of a semi-quantitative FFQ, entitled SQ-PortFood-FQ to estimate adolescents’ food intake, concerning energy intake, macro- and some micronutrient intake.
Materials and Methods
Study Sample
Participants of both sexes aged between 10 and 17 years were selected from state secondary schools in the Lisbon area, during the months of May and June of 2012. Directors and class teachers approved the study, and the entire school community was aware of the study and gave their consent. Overall, 669 participants gave their permission, and their respective guardians signed the informed written consent; however, for the relative validation process only a subset of 100 participants were selected. Of those, 89 filled in the SQ-PortFood-FQ and 3-day multiple-pass 24-h recalls. Participants were excluded from the study if the total energy intake was extremely low (boys: <600 kcal/day; girls <500 kcal/day) [19] or extremely high ( >5,000 kcal) as proposed by Rockett et al. and Paalanen et al. [20, 21, 22]. Thereafter, 9 participants were excluded from the study because both dietary assessment tools were unsuitable considering the inclusion criteria, resulting in a total of 80 participants (42 boys and 38 girls). The sample was mainly from a middle-upper socio-economic level [23].
All procedures were conducted according to the Declaration of Helsinki for human studies [24], and ethical approval was granted by the Ethics Committee of the Faculty of Human Kinetics, University of Lisbon (CEFMH No. 53/2015).
Anthropometry, body composition and bone age
All participants were measured with light clothes and without shoes. Weight was measured on a scale (Seca model 761 7019009) calibrated to the nearest 0.5 kg, and height was assessed with an anthropometer (GPM Anthropological Instruments) calibrated to the nearest 0.1 cm. Skinfold thickness (triceps and calf) were obtained using a skinfold calliper (Rosscraft, Slim Guide 2001; tips at a pressure of 10 mg/cm2). All measures were done by anthropometrists accredited by the International Society for the Advancement of Kinanthropometry and according to standardized techniques adopted by this Society [25]. Body fat percentage was estimated according to Slaughter et al. [26] considering sex and age of the participants. Bone age was assessed by X-ray, performed on the left hand and wrist using a portable X-ray device (Ascot model 110, SMAM, Italy) and Kodak MIN-R2 frameworks to place the X-ray films (Kodak medical X-ray film, 18 × 24 cm).
Development and administration of the SQ-PortFood-FQ
The SQ-PortFood-FQ was developed from a previous FFQ designed for Portuguese adolescents with a list of 33 compiled Portuguese food items representing the food groups of the Portuguese food composition booklet [27, 28]. The first draft was tested in a pilot study by comparing the FFQ against 2-day food record (1 weekday and 1 weekend day) in a sample of adolescents with similar sociodemographic and morphological characteristics selected for the relative validity of the SQ-PortFood-FQ. The pilot study allowed to test the construct validity of the preliminary version of the SQ-PortFood-FQ and to understand the difficulties concerning the item/section generation, response difficulties, question redundancies and format aesthetics.
The SQ-PortFood-FQ development followed the five general steps proposed by McNutt et al. [5] as follows: (1) define the FFQ purpose; (2) identify source(s) of information; (3) construct the FFQ food list; (4) assess the need for portion sizes and methods of assessing them; (5) assign values to food components of interest. Because the SQ-PortFood-FQ was intended to collect both food and nutrients, it was designed based on the semi-quantitative Harvard Adult Questionnaire [29], the most recognized semi-quantitative questionnaire. To the existing FFQ a list of 42 food items commonly consumed by Portuguese adolescents, and gathered from the most consumed foods in the 2-day food record (1 weekday and 1 weekend day) applied during the pilot phase, were added. The final list was composed by 75 food items organized into 12 food groups: (1) fruits, (2) vegetables, (3) beans, (4) dairy, (5) cereals and grains, (6) cakes, cookies and candies, (7) salty snacks, (8) rice, potatoes and pasta, (9) meat, fish and eggs, (10) beverages, (11) oils and solid fats, and (12) gravies.
Each food item line displayed a list of food portion options, ordered by increasing size, in which the participants selected the corresponding food average portion consumed. To assist the participants’ choices, some items were presented through images compiled by the National Health Institute food model booklet [30]. When images were not available, a “natural” serving size of consumption (standard and recognized measure; e.g. 1 apple or 1 slice of bread) was included expressed either in weights or volumes (grams or millilitres) or in household measures (e.g., spoons, glasses, plates) or commercial portion sizes. In this case, the participants had a range of 3-answer portion size options. These 3-answer portion sizes represent equal, less or larger than the standard portion, where less and larger correspond, respectively, to 0.5 and 1.5 times the standard presented portion size.
All food items provided a 10-grade scale of food consumption frequency, based on food habits of the last month, ranging from “never” or “rarely” consumed, “once per week,” “2-3 times per week,” “4-5 times per week,” “6-7 times per week,” “once per day,” “2-3 times per day,” “4-5 times per day” to “6 or more times per day.”
Dietary data were collected once during class time, self-reported and followed by the assistance of a skilled and trained nutritionist who read the SQ-PortFood-FQ out loud, item by item, and showed the correspondent images for portion selection. All the process lasted about 40 min.
Data entry was optically scanned using the data capture software TeleForm (version 10.4.1, 2009, Autonomy), and a random subsample consisting of 10% of the questionnaires was checked by different researchers for outliers and incorrect entries [31, 32]. If a participant had 4 or more misfiled answers in the SQ-PortFood-FQ, he/she was excluded from the analyses [19].
Administration of the multiple-pass 24-h recall
We used the 3-day multiple-pass 24-h recall [33] that was administered during face-to-face interviews. Participants enumerated the foods and beverages consumed on the preceding day. This procedure was done 3 times during the same month of the SQ-PortFood-FQ application and covered 2 complete weekdays and 1 weekend day.
The interviewers were trained according to the 5-step multiple-pass 24-h recall methodology [34], and all of them were skilled in diet and nutrition concepts. The same interviewer conducted all the recalls for the same participant and none of the participants were previously informed about the day of the interview. However, the weekend day was always defined as Sunday with interviews scheduled on Mondays, considering that all interviews occurred at school time.
During the interview, for more detailed information about food consumption, the participants were helped by a set of photographs displaying Portuguese typical dishes and beverages, “natural” sizes and household measures from the food model booklet [30]. If the consumed food information was not available in the booklet, food name brands, specific nutrition products (e.g., sports or ethnic food) or general measures (e.g., bottle, can, carton, juice box) were allowed for detailed completeness of the multiple-pass 24-h recall.
Energy intake and nutrient analyses
The energy intake, macro- and specific micronutrients were obtained from the SQ-PortFood-FQ after the transformation of the reported food frequency into a daily food item score (e.g., “once per week” = 0.14 times per day, and “2-3 times per day” = 2.5 times per day). Each daily food item score was multiplied by the reported portion size to obtain the amount of each food item per day. Furthermore, from the multiple-pass 24-h recall the amount of each enumerated food item was calculated from the mean of the 3-days.
Energy and nutrient intakes were calculated from the amount of food (grams or volumes) using the Food Processor (version 10.12, 2013, ESHA Research), updated for Portuguese foods and recipes from the Portuguese food composition booklet [28]. If the food’s energy and nutrient values were neither available on Food Processor nor on the Portuguese food composition database, nutritional information available in food labels and commercial sources of food packages was introduced.
For the SQ-PortFood-SQ relative validation study, energy intake, protein, fat, carbohydrates, fibre, calcium, sodium, iron, vitamin C, saturated fatty acids, monounsaturated fatty acids, polyunsaturated fatty acids (PUFA) and cholesterol intakes were used.
Methodological quality assessment
To evaluate the methodological quality of the validation, the scoring system proposed by Serra-Majem et al. [35] was carried out. A final score would classify the methodological quality from a minimum of 0 (poorest quality) to a maximum of 7 (highest quality) according to the following criteria: (1) type and size of the sample; (2) statistical analyses used for the validation; (3) administration mode for data collection; and if considered in the FFQ design: (4) seasonality and (5) dietary supplements. The final score classified the validation study as having poor (<2.5), good (2.5-5) or very good (=5) methodological quality.
Statistical analysis
Statistical analysis was performed using SPSS (version 22.0, 2013, IBM Corp.), and the significance level was set at a = 0.05. Descriptive data were presented as means and standard deviation (SD) for continuous variables (morphological, energy intake, macro- and selected micronutrient intakes), and for categorical variables (sociodemographic characteristics) through frequencies and percentages. To compare variables’ means between sexes and to compare energy and nutrient intakes’ means estimated from the SQ-PortFood-FQ and from the 3-day multiple-pass 24-h recall, independent-samples and paired-samples t tests were used, respectively.
For the relative validation of the SQ-PortFood-FQ, the following statistical methods were performed: (1) Spearman’s rank-order correlation coefficients (r) were calculated to quantify the degree of rank correlation between tools for energy intake, raw nutrients, energy-adjusted nutrients, and de-attenuated energy-adjusted nutrients. The energy-adjusted nutrients were calculated according to the regression analysis proposed by Willett et al. [11]. The de-attenuated energy-adjusted nutrients were calculated using the within- and between-person 3-day variability obtained through the multiple-pass 24-h recall as described by McKeown et al. [36]; (2) cross-classification to examine the proportion of participants classified by the SQ-PortFood-FQ that was classified into the same third (agreement) and opposite third (disagreement) by the multiple-pass 24-h recall; and (3) the weighted ?-coefficient (?w) to express the agreement between the two methods in the classification of participants into contingency tables of tertiles to remove the proportion of agreement that may have occurred by chance. The criteria of Masson et al. [14] were used to verify the validity of the SQ-PortFood-FQ, as follows: Spearman’s rcoefficientabove 0.50, more than 50% of the participants correctly classified into the same third and less than 10% of the participants grossly misclassified into opposite thirds, or ?w values of at least 0.40.
To assess the degree of absolute agreement, the Bland-Altman method [37] was also used. The difference and the mean between SQ-PortFood-FQ and multiple-pass 24-h recall were calculated after log-transformation to overcome the skewness of the distributions. The 95% limits of agreement (LOA) were established as the mean of the difference between both methods ±1.96 SD of the difference [4, 13]. Because the data were log-transformed, the mean agreement ratio was obtained after back-transformation. For example, a ratio of 1 indicates 100% of agreement between methods, and a 95% LOA of 0.5-2.00 would indicate that approximately 95% of all participants’ SQ-PortFood FQ estimations would be between one half and 2 times their multiple-pass 24-h recall estimations. The 95% LOA of 0.5-2.00 could be considered as an acceptable agreement between methods [38]. To explore whether the agreement between the two methods changes according to the magnitude of the intakes, linear regression models were performed with regard to energy, macro- and micronutrient intakes, considering the differences between methods as the dependent variable and the mean of SQ-PortFood-FQ and 3-day multiple-pass 24-h recall means as the independent variable. A regression slope significantly different from zero should indicate a relationship between the differences obtained by the two methods and the magnitude of intake [39].
Results
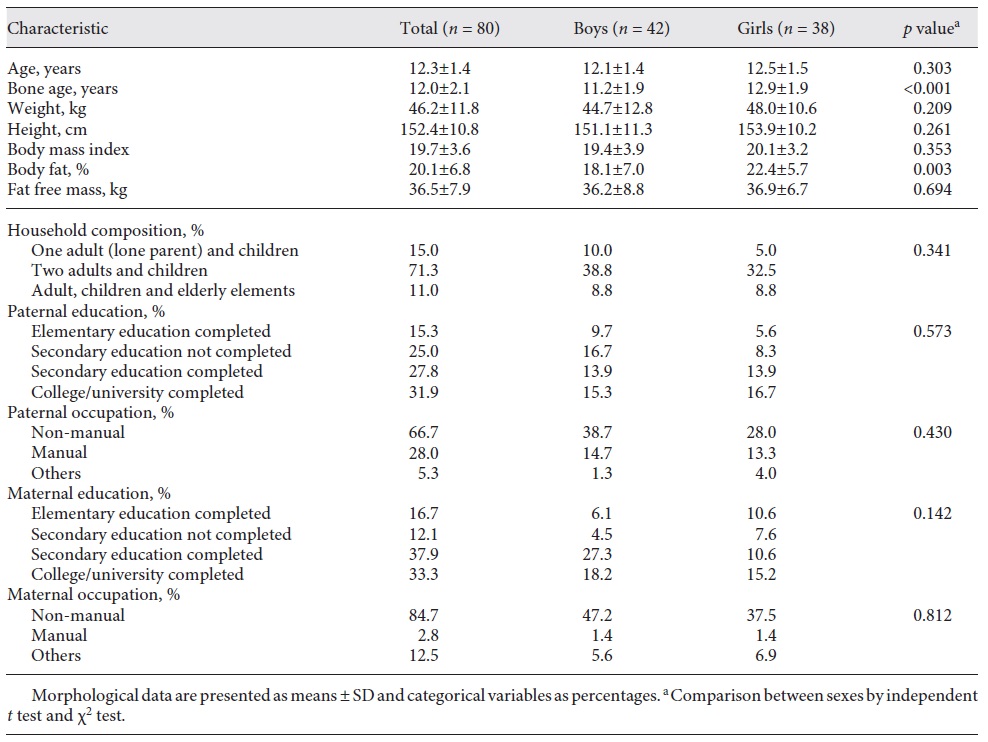
Morphological and sociodemographic characteristics of the 80 participants (42 boys and 38 girls) are described in Table 1. Almost 55% of the sample were boys. Overall there were no significant differences between boys and girls, except for bone age and body fat (%), for which girls attained higher values than boys.
Table 1 Sociodemographic and morphological characteristics of participants in the SQ-PortFood-SQ validation
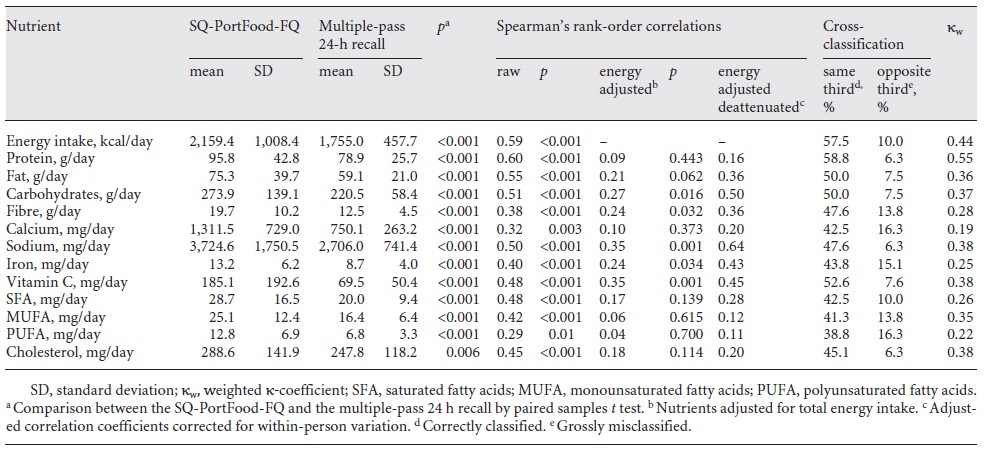
The SQ-PortFood-FQ estimated significantly higher amounts of energy and nutrient intakes in comparison to the multiple-pass 24-h recall (Table 2). Spearman’s r coefficients for energy intake, macro- and micronutrients between the two methods are presented in Table 2. Energy, protein, fat, carbohydrates and sodium intakes showed acceptable correlations with an r >0.5 [40]. Energy adjustment and de-attenuated data reduced all correlations between the two methods (Table 2), except for carbohydrates and sodium intake (r =0.64 and r =0.50, respectively). For energy, protein, fat and vitamin C intakes, the cross-classification into the same third was above 50% and into the opposite third below 10% (Table 2). The ?w values were moderate for energy and protein intake (>0.40) and ranged from 0.20 to 0.40 for the other nutrient intakes, with the exception of calcium intake (Table 2).
Table 2 Mean and standard deviation of daily energy, macro- and micronutrient intakes estimated by the SQ-PortFood-FQ, and of the average of three multiple-pass 24-h recall correlations and agreement between the two methods
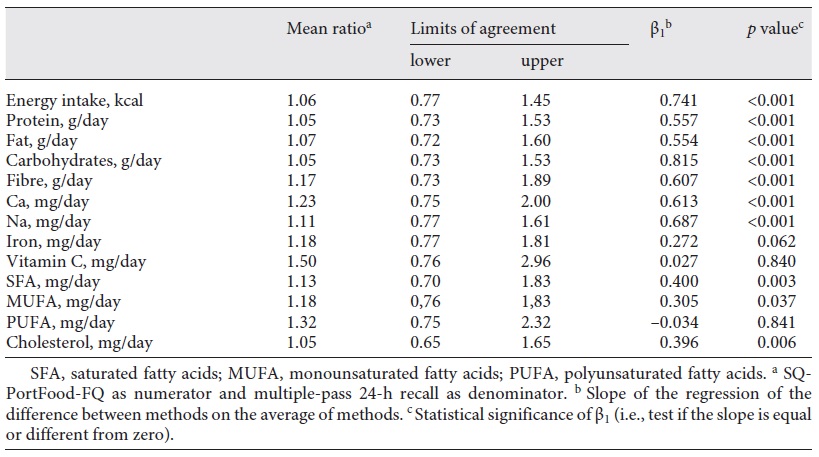
The absolute agreement according to the Bland-Altman method showed that SQ-PortFood-FQ, when compared to the multiple-pass 24-h recall, overestimates energy intake (6%) and all other nutrients (from 5 to 50%). Those overestimations ranged from 5% for protein and cholesterol intakes (mean ratio = 1.05 for both) to 50% for vitamin C (mean ratio = 1.50). The 95% LOA were within the interval of 50-200% for both the energy and nutrient intakes, with the exception of vitamin C and PUFA for which the upper 95% LOA exceeded 200% (296 and 232%, respectively) (Table 3). The differences between the two methods varied with the magnitude of intake for energy and most other nutrients, except for iron, vitamin C and PUFA (p < 0.05).
Table 3 Mean ratio of absolute agreement between energy, macroand micronutrient intakes estimated from the SQ-PortFood-FQ and the mean of 3-day multiple-pass 24-h recall (n = 80)
The sum of scores calculated from the variables selected by Serra-Majem et al. [35] to evaluate the methodological quality of the present validation study scored as well with a final score of 4.0. This result was reached taking into account the validity of the following criteria: (1) non-homogeneous sample; (2) comparisons of means, de-attenuated correlations and classifications within the same tertiles of consumption; and (3) data collection gathered by face-to-face interviews.
Discussion/conclusion
The aim of this study was to design and to assess the relative validity of an FFQ for Portuguese adolescents. In Portugal, no validated FFQ is available, to assess dietary consumption in large samples or to assess energy and nutrient intakes in a comprehensive manner, which is crucial to develop adolescents’ epidemiological studies [5, 6].
To improve the validation process, we followed a multiple-step approach as in McNutt et al. [5]. We used a recognized FFQ [5] and adapted the SQ-PortFood-FQ with an up-to-date, age-specific list of foods and beverages. These lists, containing the most common food items consumed by the target population [41], which had been previously identified and selected through a pretest analysis based on a 2-day food record.
In the current validation study, we applied the 24-h recall used as the reference method against which the SQ-PortFood-FQ was validated. The 24-h recall was chosen as the reference method, assuming that the individual reported intake is unbiased and that the within-person random error is independent of the true intake [12]. Several adolescents’ FFQ validation studies were carried out using the 24-h recall as the reference method, described as being less participant demanding, less participant burdening [42, 43, 44] and able to assess actual diets [6, 13, 41].
The FFQ and the multiple-pass 24-h recall used in this validation study have their limitations concerning several types of measurement errors like: under- [45, 46] or over-reporting [4, 47], the social desirability of answers [48], self-respondent errors, resulting from the ability to record foods consumed over a past period [49] and from the motivational circumstance [50]. However, it should be mentioned that no single dietary method can assess nutrient intake without errors [4] and that no method can be considered as gold standard [6, 14]. For this reason and to minimize method-related intrinsic errors, the current study was entitled “relative validity” instead of “validation” itself and made use of a particular set of statistical methods to validate the SQ-PortFood-FQ.
Our results were shown to be valid for absolute agreement, with a tendency for greater differences in energy and nutrient intake between SQ PortFood FQ and multiple-pass 24-h recall as the mean daily intakes in both methods increased.
Overall, the SQ-PortFood-FQ estimated higher values of intake, for both energy and nutrients, than the multiple-pass 24-h recall, which had been previously underlined in similar studies, conducted among adolescents [4, 51, 52, 53]. Children and adolescents seem to have less ability to recall both the frequency and the amounts of food consumed, because of inherent problems in conceptualizing, recording or estimating portion sizes [6]. To minimize these problems, we designed the SQ-PortFood-FQ, based on the last month food frequency, rather than on the more common last year [54, 55].
It should be acknowledged that energy intake and protein both tend to be underestimated by the 24-h recall, when using biomarkers as reference method [45, 56]. Albeit the additional use of biomarkers could potentially validate the SQ-PortFood-FQ with a higher degree of accuracy [57, 58], they seem useless in capturing the overall picture of food and nutrient intake, since they can solely assess specific intake information [59]. Doubly labelled water is considered an accurate biomarker for energy intake [60]; however, it fails to give a full picture of dietary assessment. Moreover, doubly labelled water estimates energy intake based on energy expenditure and assuming that participants are in a stable energy balance, which might not be true [61]. Thus, despite the recognized value of biomarkers as optimal methods to collect unbiased nutrients or energy intakes, they also have other limitations like its high costs and burden when applied in the contexts of dietary surveillance and nutritional epidemiology [59]. However, a recent study showed that the 24-h recall in combination with an FFQ provides robust correlations for energy, protein, potassium and sodium when compared to biomarker measures [61, 62], and consistent with our results.
The estimated correlations between methods, for energy and raw nutrient intake, ranged from 0.30 (PUFA) to 0.58 (energy and protein intakes), with acceptable results for energy, protein, fat, carbohydrates and sodium. Even though energy adjustments improve in general correlations between methods, we registered a decrement in the correlation coefficients, for all nutrients. These results suggest that protein, fat, carbohydrates or sodium intakes are related to the amounts of energy consumed; either by contributing directly through energy intake, like macronutrient intake (protein, fat and carbohydrate intakes), or indirectly by showing that adolescents who consume more energy, also eat, on average, more specific nutrients, such as sodium. The correction for day-to-day variability produced higher correlation coefficients; however, these correlations did not exceed 0.50 for most studied nutrients, except for carbohydrate and sodium intakes. Possibly the correlations between methods may reflect the limitations that both methods have in detecting unbiased data. However, low adjusted and de-attenuated correlation coefficients (<0.30) were already described [15].
Agreement in cross-classification was acceptable for energy, protein, fat and vitamin C intakes with a mean of classification into the same third (correctly classified) and into the opposite third (grossly classified) above the desirable cut-off of 50% and under 10%, respectively. The agreement in the ?w classification of consumption showed to be moderate for energy and protein intakes (?w > 0.40). These results highlight the ability of the SQ-PortFood-FQ in classifying correctly individuals into ranks of energy and protein consumption, from low to high consumption [14], which is one of the main purposes of the epidemiological studies [60].
The mean agreement at an individual level showed that the SQ-PortFood-FQ overestimated energy intake and all nutrients when compared to the multiple-pass 24-h recall estimations, although those estimations were slightly above the exact mean agreement for energy, macronutrient and cholesterol intake, with an overestimation up to 7%. In some cases, such as vitamin C and PUFA, overestimation was considerably high (50 and 32%, respectively). Most LOA values were acceptable except for vitamin C and PUFA, in which upper LOA reached unacceptable values (>200%). These wide upper LOAs indicate larger variations at the individual level, probably due to the wide variation (SD) of intakes between both methods. It must be acknowledged that even when the mean ratio is close to 100%, a very wide LOA suggests that individual differences between methods may be unacceptably large. Also, the magnitude of intake varies between the two methods for energy and most nutrient intake, except for iron, vitamin C and PUFA intakes. These magnitudes of intake vary mainly for higher consumptions, suggesting that accuracy is particularly problematic for participants with the highest intakes or rather that misreport is greater among big eaters. Also, the presence of a positive systematic error between the SQ-PortFood-FQ and the multiple-pass 24-h recall indicates difficulties in compiling accurate intakes at an individual level with a tendency for greater differences in energy and nutrient intake between both methods as the mean daily intake of both methods increased (except for iron, vitamin C and PUFA). However, a recent meta-analysis showed that the FFQ is an accurate instrument for assessing the intake of energy and of most nutrients in adolescents [63], highlighting the point of view of Willett and Hu [64], when considering that an FFQ is highly informative in epidemiological approaches, at least until another alternative is known.
Being aware of the limitations concerning the design, applicability and validation of FFQs, some suggestions may be considered in the use of SQ-PortFood-FQ: (1) the SQ-PortFood-FQ was intentionally designed to the 1-month past period and so seasonality was not taken into account. Although it is not yet proven that nutrient intakes vary dramatically within seasons [65], the application of the SQ-PortFood-FQ can be considered over different periods of the year, to study seasonality; (2) supplementation was not assessed by the SQ-PortFood-FQ since supplement intakes are not yet common in the Portuguese population; however, because supplementation is now a growing trend especially among active youth, it may be important to include this item in future research; (3) we suggest to carefully extrapolate the SQ-PortFood-FQ results to the general population, since data were obtained from a restricted geographical area, which may not be representative of Portuguese adolescents; (4) limited financial resources did not allow us to perform the validation against reference biomarkers, for intakes of protein and energy, which are independent of self-reported intake error; (5) we also believe that accuracy might be improved if more time could be given to participants, not only to make their choices, but also to answer each question; and finally, (6) participants could also benefit from using a computer-based SQ-PortFood-FQ or a smartphone app. The use of technology amongst adolescents is appealing [61] and can reduce the response burden [66, 67].
Finally, the quality of the methodological system was evaluated [35]. This process classified the current study as good, ranking it with 4 of 7 similar European adolescent studies [43, 44, 68, 69]. This final score did not consider seasonality and dietary supplements since the SQ-PortFood-FQ was not designed with this purpose in mind.
To our knowledge, this is one of the first studies to offer a relative validity of an FFQ (compared with a multiple-pass 24-h recall) applied to a Portuguese adolescent sample. The study is also unique due to its methodological quality confirmation.
As a conclusion, the SQ PortFood FQ showed a moderate relative validity. The SQ PortFood FQ is useful to rank energy and protein intake into low, medium and high consumption and, at an individual level, is also valid for energy and most nutrient intakes, except for vitamin C and PUFA. Although our results were shown to be valid for absolute agreement, the estimations were dependent on the magnitude of intake, with a tendency for greater differences in energy and nutrient intakes between methods, SQ PortFood FQ and multiple-pass 24-h recall, as the mean daily intakes of both methods increased.
Acknowledgement
The authors would like to thank Lara Costa e Silva and João Albuquerque, from the Faculty of Human Kinetics, University of Lisbon, for their great support in data collection, and Barry Bogin, from Loughborough University for their intellectual contribution. We would also like to thank all those who have participated in this study, the trainees, Carlos Ramos from Eurofir, the schoolchildren, their guardians, professors and others, such as school assistants, for their invaluable contributions.
Funding sources
The study was enrolled in the funded project PTDC/DES/113156/2009, entitled “The impact of regular competitive sport, extracurricular school-based sport and out-of-school-time physical activities on lifestyle and quality of life of children and adolescents (11-16 years) considering their bone age,” and by the researcher grant SFRH/BD/91029/2012, financed by the Portuguese foundation of science and technology.

