


 Inglés (pdf)
 Articulo en XML
 Referencias del artículo
 Enviar articulo por email
 Citado por SciELO
  Similares en
SciELO
Similares en
SciELO 
 Permalink
Introduction
COVID-19 was first reported in China at the end of 2019. On January 30, the World Health Organization declared COVID-19 a Public Health Emergency of International Concern, and on March 11 it was declared a pandemic (1). The first case in Portugal was reported on March 2n and by the end of January 2021 Portugal had almost 700,000 confirmed cases and 12,000 deaths (2).
The burden of COVID-19 varies between and within countries (3, 4) due to differences in contextual and individual factors, transmission rates, and clinical and public health interventions (5). The rapid evolution and variation of COVID-19 are influenced by its transmission dynamics, which can be described as its diffusibility (6). The transmission from infectious to susceptible hosts depends on contact rates among individuals and the probability that contacts result in transmission (6, 7). This is an important concept in disease control as it tries to describe the disease’s pattern and how the implementation of public health measures can contain its spread (8), reducing the number of contacts and thus reducing the transmission rate (9).
It is therefore importance to describe the geographic distribution of COVID-19 incidence to control outbreaks and to develop public health policies. During an emerging infectious disease like COVID-19, it is critical to implement space-time surveillance to prioritize targeted interventions, rapid testing, and resource allocation. Relative risk (RR) analysis has been widely used to describe and monitor COVID-19 time and space variation within countries, not only prospectively but also retrospectively, in order to describe spatial patterns (3, 4, 10). Hence, the aim of this study is to identify high-risk areas, between April and October, on a weekly basis and at the municipality level, and to assess its temporal evolution, considering municipalities classified by incidence levels.
Methods
This ecologic study follows a 3-step approach, i.e., (1) calculation of the RR based on the number of new COVID-19 cases notified per municipality on a weekly basis, (2) classification of the municipalities according to the European Centre for Disease Control (ECDC) incidence categorization on November 19, and (3) characterization of RR temporal evolution by incidence groups (defined in step 2).
Data on COVID-19 cases per municipality, and classified according to the ECDC incidence categorization, were downloaded from the Portugal Directorate General of Health (DGS) website, dedicated to COVID-19 (11). The population by municipality was downloaded from Statistics Portugal (INE) (12).
For the first step of the analysis, we calculated the weekly number of new confirmed COVID-19 cases between April 4 and October 26, 2020, for each municipality. The dependent variable corresponded to the weekly number of new confirmed COVID-19 cases divided by the population in each municipality. This methodology was proposed by Kulldorff and Nagarwalla (13) and tests the existence of significant spatial disease clusters. Each analysis results in an RR for each municipality, which can be higher than 1, 1, or lower than 1. For example, an RR equal to 1.2 for a given area translates into a 20% increased risk of a higher incidence of cases in that specific area compared with the rest of the country. To map RR the following rationale were used: (1) an initial class centered around 1 (RR reference value), adding 0.2 to the inferior and superior limit, creating a class 0.81-1.2, and (2) the 0.4 interval was applied to define 8 other intervals, with the first interval being between 0.0 and 0.4 and the last interval above 3.2. The geographical units were Portuguese municipalities (n = 308). SaTScanTM software was used, and circular window shapes and isotonic spatial scan statistics were applied (14).
For the second step of this study, we used the 14-day cumulative incidence by municipality on November 19, corresponding to the cumulative incidence between November 6 and 19, 2020. Before this date, the numbers of COVID-19 cases per municipality were available on a weekly basis, but on November 19 the DGS started to release only the 14-day cumulative incidence (based on the ECDC criteria). The incidence was categorized according to the ECDC incidence classification (per 100 thousand inhabitants) as follows: low, < 120; moderate, between 120 and 239.9; high, between 240 and 479.9; very high, between 480 and 959.9; and extremely high, > 960.
In the third step, we grouped the municipalities according to the 14-day cumulative incidence on November 19 (low, moderate, high, very high, and extremely high) and described the RR by month per municipality using measures of central tendency, i.e., mean and median, and measures of dispersion, i.e., SD. The descriptive analysis was performed using R 4.0.2 (15).
Results
RR were calculated weekly for each municipality. Figure 1a shows the RR of new COVID-19 cases confirmed between April 4 and 10 for each municipality, while Figure 1b shows the RR between October 19 and 26 (the first and last weeks under study). At the beginning of April, the Northern Portuguese coast had more municipalities with higher RR than the rest of the country. By the end of October, the highest RR could be seen in Northeastern Portugal. During both instances, different municipalities were identified in the South of Portugal.
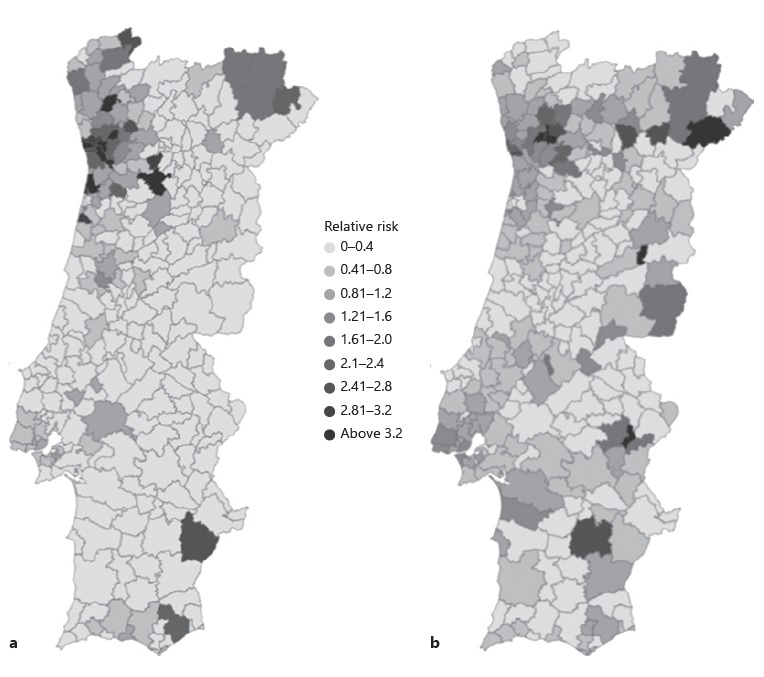
Fig.1 RR of new COVID-19 cases notified for each municipality. Islands are not shown. a RR of new COVID-19 cases confirmed between April 4 and 10. b RR of new COVID-19 cases notified between October 19 and 26
The global mean RR was 0.53, with an SD of 1.44, varying between 0 (minimum) and 46.4 (maximum). The highest class created included RR above 3.2, corresponding to areas where the risk of having more cases was at least 3.2 higher than the rest of the country. These high critical areas were analyzed over time, and several municipalities were identified between April and October. The north and the Lisbon and Tagus Valley (LVT) area were the regions with a higher number of these high RR. In April and the beginning of May, most of the high critical municipalities were in the north region, while between May and August most of them were in the LVT area. In fact, Amadora, Sintra, Loures, and Odivelas, municipalities from the LVT area, were consistently identified with an RR above 3.2 between May 15 and July 31. In the middle of August, the highest RR was once again spotted in the north region. Over time, several municipalities with extremely high RR were associated with outbreaks, such as Reguengos de Monsaraz in June (RR = 43.9), Azambuja in May (RR = 5.8), Bombarral in June (RR = 4.6), Lagos in June (RR = 6.4), and Vimioso in September (RR = 22.9); most of them were in relatively small municipalities (in terms of population).
We then classified the municipalities according to the 14-day cumulative incidence on November 19 as low, moderate, high, very high, or extremely high. Figure 2 shows the incidence category for each municipality. The mean RR was calculated for each month, globally, and each incidence category (Table 1).
Table 1 Mean monthly RR considering the municipality classification based on the 14-day cumulative incidence on November 19
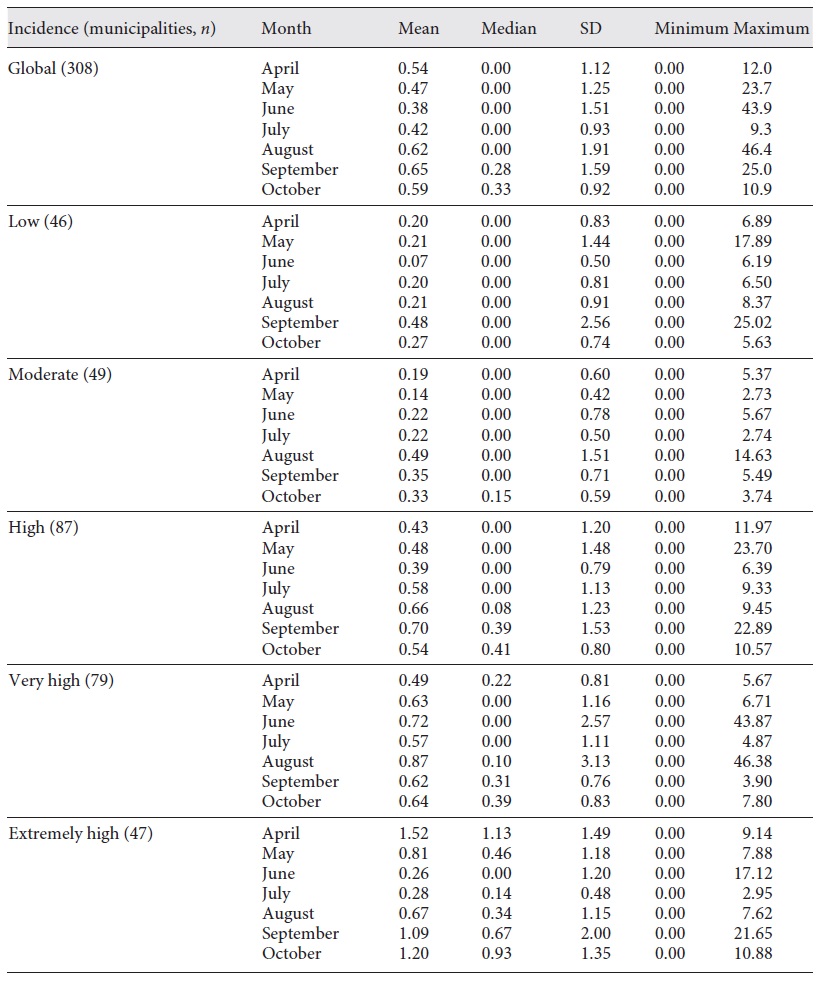
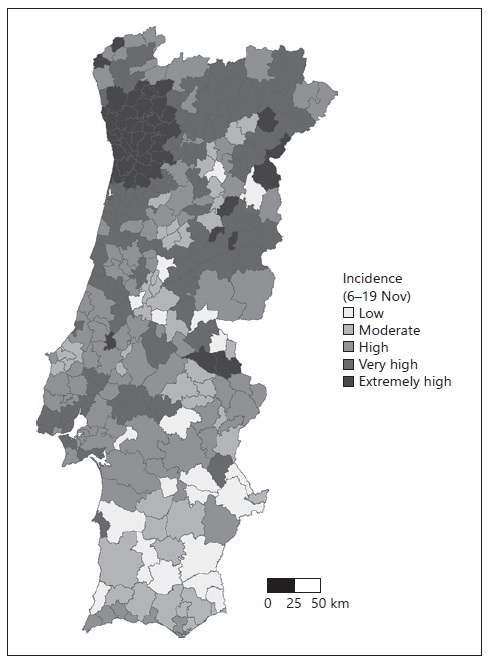
Fig. 2 Fourteen-day cumulative incidence of COVID-19 cases, according to the ECDC classification. Islands are not shown. Low, <120; moderate, between 120 and 239.9; high, between 240 and 479.9; very high, 480 and 959.9; and extremely high, >960.
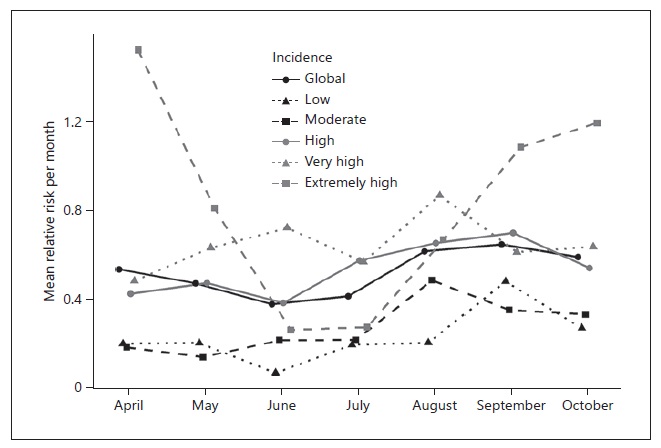
Overall, the mean RR presented by month was low (between 0.38 and 0.65), while the maximum ranged from 9.3 to 46.4, corresponding to Miranda do Douro and Mora, respectively. For the low incidence category, the median RR was 0 for each month, while for the extremely high incidence category the median RR ranged from 0 in June to 1.13 in April. June was consistently the month with the lowest RR across the different categories, except for the very high and moderate incidence categories. August was the month with the lowest RR for the very high category, while for the moderate incidence category May was the month with the lowest RR. Contrarily, the highest RR was found in September for the low and high incidence categories, while for the moderate and very high incidence categories the highest RR was found in August. The extremely high incidence category had the highest RR in April. The categories extremely high, very high, and high showed the largest variation throughout the months, as shown in Figure 3.
Discussion/Conclusion
The main goal of this study was to identify high-risk areas at the municipality level and assess the temporal evolution of COVID-19, demonstrating the high variability of this disease through space and time. Our results showed considerable variation in RR over time, with no consistent “better” or “worst” municipalities. The comparison of the incidence in November and the retrospective analysis of the RR showed a substantial variation, with municipalities with an RR of 0 classified as extremely high incidence areas and municipalities with an RR equal to 25 classified as low incidence. No clear patterns were differencing the distinct incidence categorization classes, highlighting the importance of these analyses continuously in space and time.
RR was analyzed weekly, allowing identification of the “worst” (RR > 1) municipalities in each week. This analysis shows the RR compared with the remaining municipalities and is highly susceptible to outbreaks. However, one should be aware that RR are not similar to incidence. RR are comparative measures, comparing the risk inside one municipality with the risk of the rest of the country.
Several factors influence the transmission dynamics of infectious disease, and COVID-19 is no exception. As some authors explain, the dynamics of infectious diseases are influenced by person-to-person interactions, geographical distributions, contextual factors, lengths of latency, and humans’ heterogeneous nature (16, 17). COVID-19 emerged as a new disease in 2020, making case identification more complicated either because of the unknown duration of the infectious period or the unknown period to develop more severe symptoms. Due to unknown COVID-19 infectious mechanisms, and to a decrease in the reproduction ratio, massive public health interventions, such as lockdowns, hygiene measures, closing schools, and extensive travel restrictions were put in place internationally (18). In some diseases, the geographical variation can be explained by common contextual factors, such as socioeconomic differences and individual factors. However, for COVID-19, the differences cannot be explained solely by those factors.
Throughout the pandemic, several outbreaks were identified in specific settings, such as nursing homes (19, 20), factories (21, 22), or even after illegal parties (23), which may explain why some areas peaked in a given period. However, when an outbreak spreads beyond its initial setting or its origin is unclear, control might be more difficult and take longer to achieve. If not controlled in due time, the outbreak can spread to other locations. Therefore, detailed identification of critical areas, in time and space, allows the implementation of timely interventions to control the spread of the pandemic.
The spatial variation might also be explained by public health interventions implemented over time, as these included specific tailored interventions for each municipality, according to the municipality incidence. Public health interventions aim to reduce transmission rates, influencing several factors involved in transmission dynamics, such as population mobility. Overall, the mean monthly RR during June, July, and August were below 1 for most municipalities, which might be explained by behavioral changes during the holidays. In summer, there was a loosening of the measures implemented in previous months. This decrease might be due to the impact of previous lockdowns, which were still noticeable and might have been perceived as positive progress, leading to a false sense of security. On the other hand, individuals were more often outside, in open spaces, schools were closed, and individuals may have chosen to travel to isolated locations for holidays. The first lockdown, in Portugal, had a substantial impact on reduction of the number of cases, hospital admissions, and deaths during the first wave (9). However, lockdowns should be the last resort, as these have a strong economic and social impact, and thus they should not be used constantly and/or for a long period of time. Gradually, these measures were loosened over time and adapted according to the municipality incidence. One should be aware that for every public health intervention implemented the natural transmission pattern is altered, which is often the aim. However, governments and populations should understand that returning to a normal life will take some time and be prepared for the implementation of future lockdowns if needed.
This is an ecological study and has some limitations associated. The data used depend directly on notification rates, considering only already diagnosed cases. In the present study, it is also assumed that, despite the identified biases, the risk variation phenomenon is consistent across the country, varying in space and time.
Acknowledgement
The authors would like to thank the DGS and INE for their publicly available data and for allowing it to be used for research purposes.

