Luciano Amaral*
* Faculdade de Economia, Universidade Nova de Lisboa, Campus de Campolide 1099-032 Lisboa, Portugal. e-mail: lamaral@fe.unl.pt
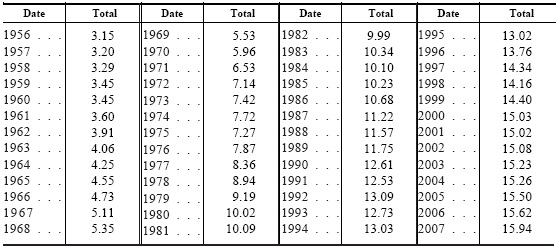
The two most important international databases with Portuguese GDP per capita and productivity from the 1950s onwards (GGDC and Ameco) offer two contrasting pictures of its evolution, especially during the slowdown of 1973 to the mid-1980s. The main problem is the low quality of the underlying data for population and employment. This paper offers new estimates for population and employment and recalculates GDP per capita and productivity between 1950 and 2007. Although confirming the main idea advanced in GGDC (a similar slowdown of GDP per capita and productivity), the series are different, and should be viewed as the new benchmark for the Portuguese economy.
Keywords: Portugal; GDP per capita; labor productivity; new series.
Novas séries para a população e o emprego em Portugal, 1950-2007: implicações para o PIB per capita e a produtividade
As duas mais importantes bases internacionais com dados para o PIB per capita e produtividade da economia portuguesa dos anos 50 em diante (GGDC e Ameco) oferecem dois retratos opostos da sua evolução, em especial durante o abrandamento entre 1973 e os anos 80. O principal problema é a qualidade dos dados de base sobre população e emprego. Oferecem-se aqui novas estimativas e apresentam-se novos cálculos do PIB per capita e da produtividade do trabalho entre 1950 e 2007. Confirma-se a ideia transmitida em GGDC (abrandamento semelhante do PIB per capita e produtividade), mas as séries são diferentes, devendo as séries aqui apresentadas ficar como as novas referências para a economia portuguesa.
]]> Palavras-chave: Portugal; PIB per capita; produtividade do trabalho; novas séries.
Introduction
International databases providing a vast array of information on the various national economies of the world have become increasingly comprehensive and reliable. We can now turn to various databases tracking the very long-run economic performance of the world, sometimes back to the year 0 (as in Maddison, 2006, which had as predecessors, Maddison, 1989 and 1995). It is not just in chronological and geographical extension that the databases have been improved, but also in the quality of the underlying data. Such databases as that of the Groningen Growth and Development Centre (GGDC, see GGDC) and Eurostat’s Ameco (see Eurostat) tend to use the latest national updates on historical statistics and even official data. The usefulness of such exercises is obvious. We are now able to compare the performance of a large number of economies for substantially long periods of time.
There is, however, a slight drawback in these exercises, which is to give the impression that they are the source of absolutely rigorous statistical material. In reality, fundamental data to build historical statistics are sometimes absent, and are often replaced by arbitrary assumptions and decisions. Historical series are sometimes nothing more than hypotheses on the evolution of certain economies, rather than precise descriptions. Consequently, caution should be the rule in the use of such databases.
One might believe that the closer one is to the present and to the more developed economies of the world, the more reliable the data provided by national statistics offices would be. However, in this paper I reveal basic data problems regarding Portugal in the 1960s and 1970s. These are important problems because they impinge on the picture we draw of the Portuguese economy during both its golden age of the 1960s and its slowdown of the mid-1970s. Additionally, they raise serious doubts as to the reliability for that period of the two most important international datasets currently available, Ameco and GGDC.
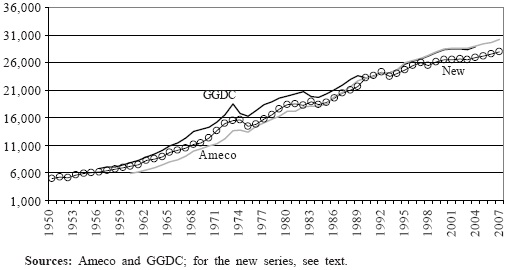
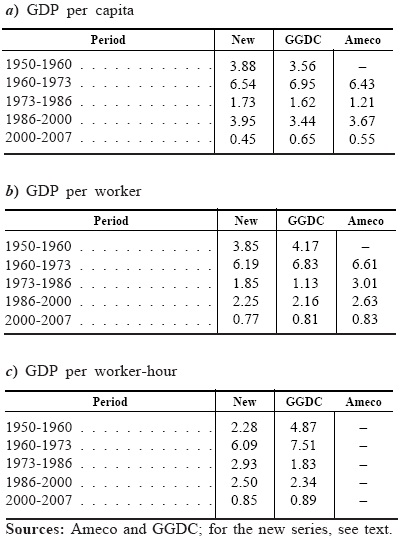
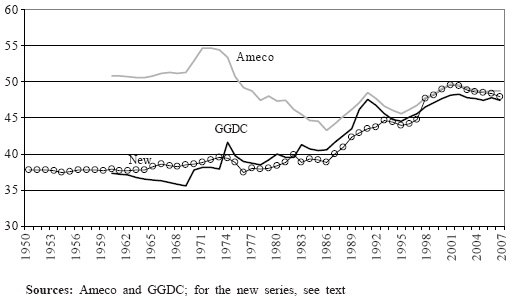
Ameco and GGDC present two contrasting pictures of the performance of the Portuguese economy in that period. Although they indicate virtually no difference in terms of GDP per capita (figure 1), the same is not true of GDP per worker: Ameco shows a level that is consistently below GGDC from 1960 to 1990 (figure 2) and, consequently, also shows higher rates in the same period, mostly between 1973 and 1986 (3.01% versus 1.1%) (table I). These differences lead to two entirely different stories regarding the performance of the Portuguese economy during the mid-1970s slowdown. Whereas GGDC data indicate a paltry Portuguese performance in terms of productivity from the mid-1970s to the mid-1980s, Ameco’s indicate the opposite.
GDP per capita, Portugal, 1950-2007 (PPP 1990 Geary-Khamis dollars)
[figure 1]
]]>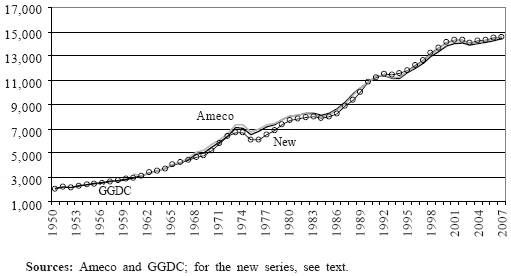
GDP per worker, Portugal, 1950-2007 (PPP 1990 Geary-Khamis dollars)
[figure 2]
Growth rates of GDP per capita, GDP per worker, and GDP per worker-hour, Portugal, 1950-2007 (PPP 1990 Geary-Khamis dollars)
(percentage)
[table I]
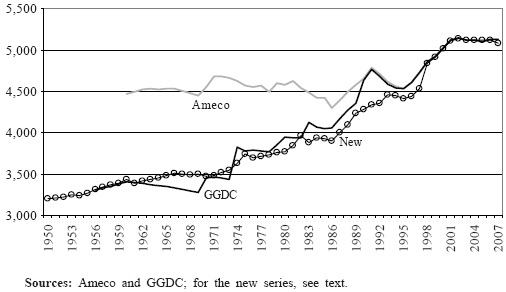
Since there are no major differences in the record of GDP between the two databases, the root of the divergence must be in employment data. Figure 3 shows the notable differences between the employment series of the two databases. In 1960, Ameco’s starting year, it indicates an employment level of about 4.5 million persons; GGDC’s is of about 3.5 million, a difference of 1 million, or more than 10% of the total Portuguese population in that year. It is not easy to know how the two employment series were built, but it is easy to imagine the main reason for the divergence. An old vexata quaestio of the Portuguese economy for the period between the 1960s and the 1980s is the low quality of the Portuguese official demographic statistics, particularly the 1970 census. Due to logistical problems and difficulty in grasping some of the new demographic realities, the statistics office (Instituto Naciona de Estatística – INE) was only able to publish official figures with a very large margin of error (at least 20%, acknowledged by INE itself — see INE, 1970).This was noted by various authors (such as Cónim, 1977, and Nazareth, 1984) and even recognized by INE, which in 1980 published a new (corrected) total population series for the period between 1940 and 1980 (INE, 1980). The quality of the original statistical data prevents the construction of a good basic series. It also poses serious challenges to anyone trying to build any sort of estimate. The “creativity” shown by Ameco and GGDC demonstrates it.
Employment, Portugal, 1950-2007 (1000 of persons)
[figure 3]
In order to tackle this problem I decided to search for information that could improve the available series. In the process, I realized that “creativity” has not been exclusive to the builders of international data sets, but has also been used by the builders of national ones, and that much room for improvement exists. With this in mind, I offer what I consider to be more reliable series for total population, active population, employment, hours of work, and, as a result, of GDP per capita, per worker and per worker-hour in Portugal from 1950 to 2007. This paper provides a description of the methods followed to build the new series.
The remainder of the paper is arranged as follows. In the first section, I discuss the drawbacks to the existing population, active population, employment, and hours of work series, both at GGDC and Ameco, as well as in various national sources. I then suggest a new manner of determining those series and present the results. All new series are reproduced in an appendix.
In section 2, I use the new series to calculate a new set of series for GDP per capita, GDP per worker and GDP per worker-hour. The findings are different from those of both GGDC and Ameco, although essentially confirming the picture depicted in the former with regard to the slowdown years: a stronger slowdown in GDP per worker and per worker-hour than in GDP per capita.
]]> In section 3, I discuss the practical implications of the differences between the various series, by comparing them with the Spanish economy. Whereas the Ameco data imply a story that is similar for Portugal and Spain, with both countries slowing-down at the same pace both in GDP per capita and in GDP per worker, the GGDC and the new data suggest that in Spain there was a much stronger slowdown in GDP per capita than in GDP per worker, whereas in Portugal they were similar.
New series for total population, active population, employment, and hours of work
As we have seen, AMECO and GGDC give contradictory indications for the performance of the Portuguese economy from 1950 to 2007, in particular during the crucial slowdown years of the mid-1970s. The differences emerge from the employment data, where “creativity” in their construction has been abundant. It is not possible to know where Ameco’s employment data come from, since no explanatory notes are available at Eurostat’s site. As for GGDC’s, the explanatory notes tell us that they come from various issues of OECD’s Labour Force Statistics (OECD, various years).
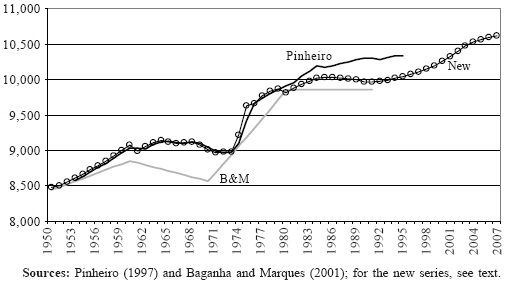
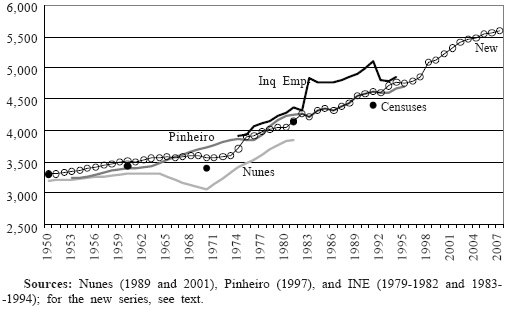
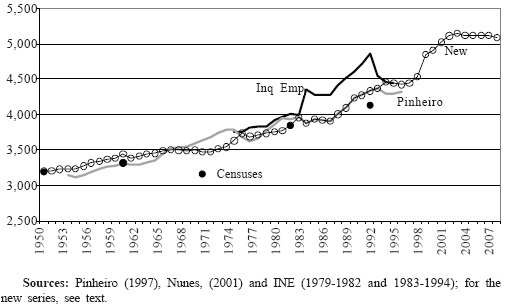
But “creativity” has not been limited to the builders of international data sets. The same has occurred in Portugal. Figure 4 shows the two most recent efforts to reconstruct total population numbers in Portugal between 1950 and the 1990s, Pinheiro (1997) and Baganha and Marques (2001). Figures 5 and 6 show a few efforts referring to active population and employment (Nunes, 1989, Pinheiro, 1997, INE, 1979-1982 and 1983-1994, in addition to the original census figures, given in Nunes, 2001). It is certainly not easy to extract a clear picture from this contradictory collection of information.
Total population, Portugal, 1950-1990s (1000 of persons)
[figure 4]
]]> Active population, Portugal, 1950-1990s (1000 of persons)
[figure 5]
Employment, Portugal, 1950-1990s (1000 of persons)
[figure 6]
Starting with total population and the Baganha and Marques (2001) series, we can identify a few serious problems. The first is that these authors take for granted the data coming from the censuses, which, as noted above, are rife with errors. The second is that the annual figures are not genuine annual figures, but rather linear interpolations between the 1960, 1970, 1981, and 1991 census figures. This is a legitimate thing to do, of course, and even a potentially correct one, in the absence of other information. As it happens, however, more information is available. The original official figures were corrected by Cónim (1977) not only for the 1960 and 1970 census years, but for the intermediate years, as well. This was not just a casual and inconsequential revision, but one that turned out to be adopted by INE from the 1980 Statistical Yearbook (INE, 1980) onward.
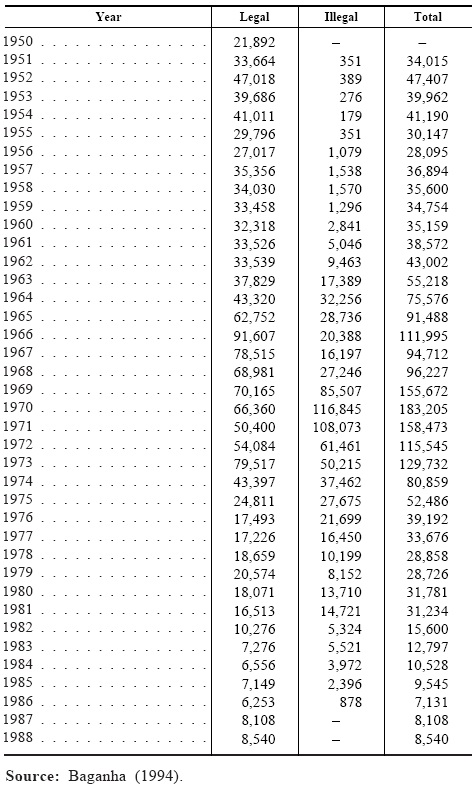
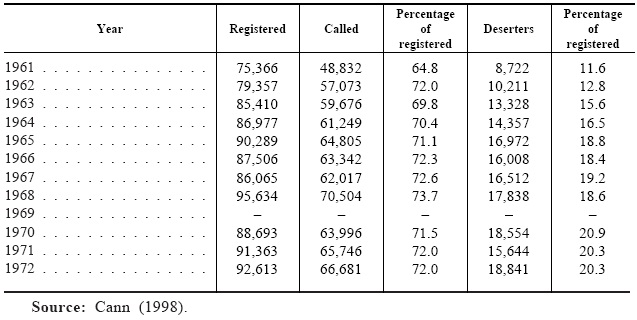
Another problem is that the linear interpolation method, although statistically correct, does not take into account some important events that do not fit the simple decennial logic underlying it. We know that population declined during the 1960s and early 1970s due to two combined effects: a surge in emigration (see table II), involving the departure of more than one million persons from the country from 1960 to 1973 (or the equivalent of more than 10% of total population), and the large deployment of soldiers to the African Colonial Wars between 1961 and 1974: in the final years of the war, between conscripts and deserters more than 100,000 young men were enrolled for action in three different theaters of war or fled the country, the equivalent to roughly 1% of the total population (see table III).
]]>Emigration, Portugal, 1950-1988
[table II]
Mainland conscripts in the African wars
[table III]
We also know that total population increased greatly from 1974 to 1976 (about 600,000 persons in three years, or the equivalent to roughly 6% of the total population), resulting mostly from the return of colonists living in Africa but returning to the mainland when the colonies gained independence. Consequently, the linear interpolation effect introduces an unwarranted break in 1970. In fact, emigration slowed decisively only from 1974 on, and the return of the colonists started only in that same year and accelerated in 1975 and 1976. Any reliable series must take these features into consideration.
]]> As for active population, the available series also pose extremely serious problems. Starting from rather similar levels in 1950, the Nunes (1989), Pinheiro (1997), and census series diverge only slightly in 1960 but are totally incompatible in 1970, with a difference between the lowest level (from Nunes, 1989) and the highest (from Pinheiro, 1997) of about half a million persons (the equivalent to more than 5% of total population). It is not easy to understand the origin of Nunes’ (1989) benchmark figures for 1960, 1970, and 1981, since she uses the censuses as her source. Perhaps the difference comes from the fact that she identifies active population with employment. As a matter of fact, a constanly acknowledged correction of the official figures in Nunes (1989) is: “we have considered as ‘active population’ only the group of active people with a profession”. This is obviously a problem, which is compounded with the use, again, of linear interpolation: “the method… [to find the annual figures was] linear interpolation of the activity rate in each region” (Nunes, 1989). The regions were then aggregated to give total figures. As with total population, there is no reason to believe in a break in the series in 1970. Quite the contrary, there are reasons to believe in a continuation of the previous trend, with a break taking place only in 1974.Pinheiro (1997) did not adopt the original census figures for total population, but the Cónim (1977)/INE(1980) ones instead, thus correcting the first’s main errors. The problem here refers to active population. It is not easy to understand why, according to Pinheiro (1997), despite a decline in total population between 1960 and 1970, active population not only continued to increase, but increase very quickly. The implicit participation rate jumps about 5 percentage points between 1953 and 1973. Although we may presume a slight increase in participation as a consequence of labor scarcity, a figure this large is highly unlikely. Population declined mostly due to the abandonment of the country by a large number of active men (either emigrating or being mobilized into military service abroad), but the variable that should have reflected this shows an increase. Additionally, the Pinheiro (1997) series shows a decline of active population between 1974 and 1976, precisely at the time of the ex-colonists’ return (as mentioned above, a population influx of about 600,000 persons, most of them active – according to Pires et al., 1984, about 80% of returned colonists had ages between 15 and 65), of the abrupt slowdown in emigration, and of the end of military deployment to the Colonial Wars. It is difficult to understand how and why active population would decline so significantly under these circumstances. These figures are particularly puzzling when we consider that Pinheiro (1997) adopted the corrected total population data.
The problems with active population data do not stop there, as revealed by the INE (1979-1982 and 1983-1994) series for the period between 1974 and 1994, shown in figure 5. This extra series shows a very anomalous behavior between 1983 and 1991, in what seems to be a statistical record error. This poses an additional challenge to obtaining a complete picture for the full period between 1950 and 2007. As discussed in the 1979 volume of INE (1979-1982), there were many doubts at the time concerning the coverage of these surveys. Two main problems raised doubts over the actual figures for employment and unemployment: the low quality of the 1970 census and the difficulties in tracking the activity of a large number of returned colonists. A common thought at the time was that unemployment was underestimated. On the other hand, this is also a period of increase of the shadow economy, which was able to absorb a significant part of the new labor shock (cf. Cabral, 1983). So, ultimately, the data we use, despite some inevitable errors, should not be too far from the employment reality of those years.
Clearly then, full and coherent series for total population and active population in this period are impossible to obtain by simply gathering data from existing sources. Some process of (re)construction has to be used instead. Due to the implausibility of the existing series, room for improvement is ample, and that is what I offer here.
As a first step, I adopted the corrected figures for total population given in Cónim (1977) and INE (1980) for the period between 1950 and 1980. This series was then chained with the official figures for the period between 1980 and 2007 given on the INE site (see INE). The results are presented in figure 4 and compared with the existing series. The new series is essentially similar to Pinheiro’s (1997) until 1981, something that is not surprising, since their fundamental data are the same. From then on, however, they diverge. The two series are significantly different from Baganha and Marques (2001). This is understandable, as the latter is a linear interpolation of the official census figures. In general, the effect of the new series is to shift the figures upward. In the late-1960s the difference between the new series and Baganha and Marques (2001) reaches about 500,000 persons. The two sets of data converge only in 1974. A clear advantage of the new series is the avoidance of linear interpolation. Thus, it reflects not only the most important population movements of the 1960s, but also those of the mid-1970s. The new series shows neither the sudden break in 1970 nor the artificial regular growth between censuses. As described below, due to these more realistic features, I used it as a benchmark to determine active population.
We should pause here to understand better the main principles used in Cónim’s (1977) revision of total population and its effects in comparison with the official figures. Cónim’s (1977) purpose was to include population movements that had been underreported and misreported in official statistics, especially illegal emigration and definitive returns of former emigrants (which can be easily confounded with regular short-term movements at the borders — these also increased due to the growth of tourism, thus helping to blur the picture even more), as well as another population movement that (as a result of its own peculiar circumstances) was also misreported: the return of colonists from Africa. As stated in Cónim (1976): “If, on the one hand, we have witnessed the stabilization-diminution of the intensity of certain events (the natural population movement), on the other, migratory phenomena have acquired a behavior that we must classify as ‘exceptional’”.This, together with the suspicion that the 1960 and 1970 censuses (especially the latter), were surveys of very poor quality, led Cónim (1977) to reconstruct data for total population (see also INE, 1980, and Nazareth, 1984). The method was to combine the official yearly statistics for births and deaths with the official statistics for legal emigration, plus some estimates for illegal emigration, emigrants’ returns and colonists’ returns, all corrected with data provided by the 1975 and 1976 electoral censuses (for details, see Cónim, 1977). The latter were especially important in order to determine the actual numbers as well as the age and gender structure of returned colonists, which were not reported in the official statistics (Cónim, 1976).
Neither Cónim (1977) nor INE (1980) provide a corrected active population series, and as a result, I decided to build a new one. Four steps were taken. First, I interpolated linearly between the official census figures for active population for 1950, 1960, 1970, and 1981, in order to have a continuous series. I decided to build this new series rather than use Nunes’ (1989) due to the problems identified above. Second, I derived the participation rate by finding the ratio of the new series over the Baganha and Marques (2001) total population series. Since the source used in both is the same (the censuses), their errors (namely the undervaluation of the population size) should at least be consistent among them. Additionally, the method followed to find the inter-census figures (linear interpolation) was the same. I thus obtained a continuous participation rate series. In a third step, I applied this participation rate series to the corrected total population series in order to obtain a continuous series with absolute figures for active population between 1950 and 1981. In a final step, I chained this series with those coming from Pinheiro (1997) for the period between 1981 and 1992, and then with the official figures given in the INE site for the period between 1992 and 2007. Pinheiro’s (1997) figures seem to be reliable for the 1981-1992 period, since they are a plausible correction of the series given by INE (1979-1982 and 1983-1994). The series thus obtained is presented in figure 5 and compared with the other series previously available.
The new series presents various advantages over the existing ones. First, although built indirectly for the most difficult period (1950 to 1981), it uses as a benchmark the more realistic total population series given in Cónim (1977) and INE (1980). Since participation rates tend to change slower than do absolute figures, the procedure used is preferable to the simple linear interpolation of absolute figures. Then, if we compare its behavior with that of the other series, it reflects the major population movements in Portugal in the period between 1960 and 1981. First, it corrects for the apparent undervaluation of absolute figures in the 1960 and 1970 censuses noted (and corrected) by Cónim (1977). Second, it presents a much higher overall level than the Nunes (1989) figures. Third, and contrary to the unexplainable ascending movement between 1960 and 1974 given by Pinheiro (1997), it incorporates in active population the decline in total population given by the corrected figures. Fourth, it shows a sudden increase in active population between 1974 and 1976, something that is much more plausible than the sudden and constant increase from 1970 to 1981 given by Nunes (1989), but also more plausible than the decline between 1974 and 1976 given by Pinheiro (1997). Although it is impossible to claim that this is a perfect series, it seems to improve considerably on the existing alternatives.
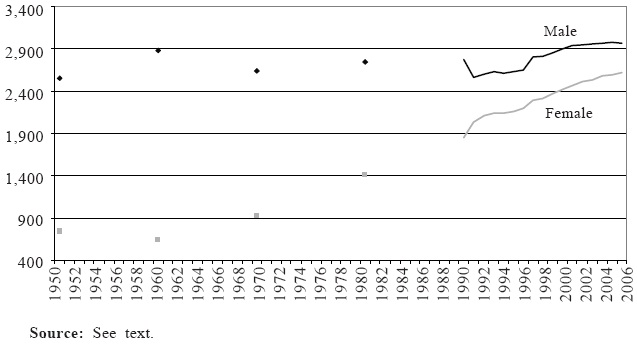
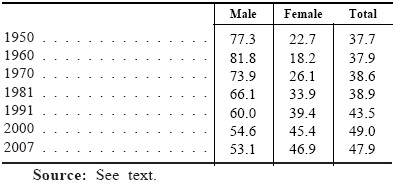
In addition to the aggregated series, I also provide here a few estimates for active population separated by gender. Although not crucial for the calculation of GDP per worker, this breakdown is interesting due to its relation with a classic topic of Portuguese social, economic, and demographic history: the increase of female participation in the labor force from the 1960s onward, as a consequence of emigration and military deployment in the colonies. In order to build the data given in figure 7, I first obtained the participation rates by gender implied by the 1960, 1970, 1981, and 1991 censuses. Then, I applied this rate to the new aggregate series for active population that was calculated as explained in the previous paragraph. From 1992 to 2007, the participation rates by gender were calculated from the figures given on INE’s website. These rates were then applied to the new aggregate series. The results confirm the traditional idea regarding female participation: from 1960 onward, it grew persistently, in a process that has continued until today. If we look at the participation rate by gender that is given on table IV, we can see that female participation grew from 18% in 1960 to 47% in 2007. This was accompanied by a decline in male participation, from 82% in 1960 to 53% in 2007. The two rates have converged to nearly the same level. The decrease in male participation has to do with the growth of the dependency rate, explainable by the decline in birth rates, by the delayed entry in the labor market of youth, who have continued to extend their studies, and by the growth of retired people thanks to the increase in life expectancy. The increase in female participation is explained by the continuous entry of women in the labor market.
]]> Active population by gender, Portugal, 1950-2007 (1000 of persons)
[figure 7]
Participation rate by gender, Portugal, 1950-2007
(percentage)
[table IV]
Finally, in order to find an employment series (the variable of real interest to build GDP per worker and per worker-hour series) I used the unemployment rate between 1950 and 1992 given in Pinheiro (1997) and applied it to the new active population series. The resulting employment series was then chained with the employment figures given on INE’s website site for the period between 1992 and 2007. Figure 6 compares the resulting series with the existing ones.
]]> We are now in a position to make some observations on the comparison between the employment figures thus found with those in Ameco and GGDC. As figure 3 shows, the new series is much closer to GGDC than to Ameco, although avoiding some of its less understandable movements at particular points in time, mostly in the critical period between 1960 and the mid-1970s: the GGDC series displays a “syncopated” configuration that suggests an abundant use of linear interpolation. Figure 8 provides a comparison between the employment rates implied by the two data sets and by the new series.
Employment rate, Portugal, 1950-2007
(percentage)
[figure 8]
A final element we need in order to complete the picture of labor supply in Portugal between 1950 and 2007 is a series for hours of work. Again, data problems abound. Ameco does not provide any series. As for GGDC, “creativity” seems to have been used again, in the absence of reliable official (or other) data. Figure 9 shows the series provided by GGDC. As explained in the GGDC notes, the series until 1987 is built through a) linear interpolations between the 1950, 1960, and 1973 benchmarks, which were obtained from OECD (various years); b) interpolations from 1974 to 1978 and from 1980 to 1985; c) extrapolation from 1990 to the period 1986-1989, with a trend obtained from OECD (2008); d) direct information from Eurostat’s New Chronos database for the period 1990-2007. I offer here an alternative. It is not perfect, but it is at least grounded in more direct data.
Annual hours of work, Portugal, 1950-2007
]]> [figure n.º 9]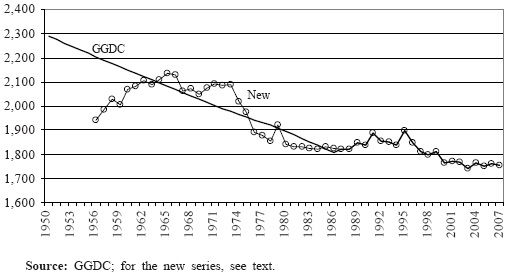
Even if there are no series for hours of work in Portugal for the whole economy until 1990, there are figures for weekly working hours in manufacturing from 1950 to 1990, as well as some less systematic information for a few other sectors (e. g. fishing and transportation) (INE, 1961-1991). In the absence of systematic figures for other sectors, I assumed the manufacturing series to be representative of all sectors of the economy. As there seem to be some questions concerning the quality of the data until 1955, I decided to reject the figures for the 1950-1955 years and start the series in 1956 (cf. Guimarães, 1966). I then found the yearly growth rates of the series and an initial value that, once linked with the growth rates, could be spliced with the 1990 level provided by the New Chronos database used by GGDC. The results are clearly different from GGDC. Whereas GGDC shows a continuous linear decline from 1950 to 1990, the new series shows first an increase from the mid-1950s to the mid-1960s, then a mild decline until 1974, then a strong decline until the early-1980s, and finally stability until the end of the decade.
New GDP per capita, per worker, and per worker-hour series
With the new and better population, employment, and hours of work data, I could finally build new series for GDP per capita, per worker, and per worker-hour. Fortunately, the existing GDP figures are generally considered to be of good quality. Consequently, there was no need for new calculations here, except for chaining the Pinheiro (1997) series (used as a benchmark), which stops in 1995, with the figures given on the INE site for the period between 1995 and 2007. Also, it was necessary to convert the new series into a comparable international unit. I chose PPP 1990 Geary--Khamis dollars, in which all data in GGDC as well as Maddison (1995 and 2006) are given. The same was also done to the Ameco series, which are originally presented in euros.
Figures 1 and 2 show the new series and compare them with Ameco and GGDC. Table I shows the average growth rates for various sub-periods. Using the new population series has the consequence of significantly lowering the level of GDP per capita in the period between 1973 and 1980. However, this is not readily reflected in the average growth rate between 1973 and 1986. The reason is that the three series converge to the same level in the early- to mid-1980s. The decline in GDP per capita in Portugal is much more pronounced in the new series for the period between 1974 and 1976, but so too is the recovery from 1976 onward. For the rest of the period, the series are essentially coincident, both in terms of levels and growth.
As for the GDP per worker series, the differences are much clearer. In level terms, the new series starts more or less at the same point as the GGDC series, which is higher than Ameco’s. Then, in the 1960s, it diverges and declines progressively to a level somewhere halfway between the Ameco and GGDC series, until 1973. Then, it approaches the level of the Ameco series until the mid-1990s. After the mid-1990s, it declines in relation to both Ameco and GGDC. In terms of growth rates, the result of this path is a slightly lower rate in the 1960s until 1973, in relation to both Ameco and GGDC; a rate somewhere between Ameco and GGDC from 1973 to 1986; a similar rate from 1986 to 2000; and a slightly lower rate from 2000 to 2007. Ultimately, even if the growth rate is higher for the slowdown years of the mid-1970s than in GGDC, the new series confirms the picture of a simultaneous decline both in terms of GDP per capita and GDP per worker, contrary to what was implied by Ameco, where the decline in the growth of GDP per capita was much stronger than the decline in productivity.
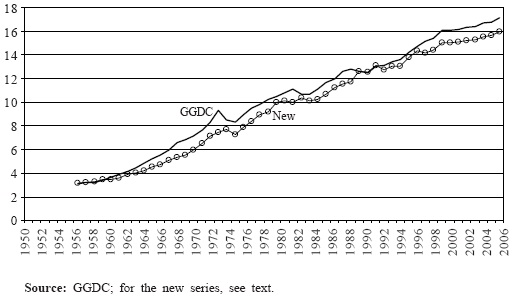
The new GDP per worker-hour series is presented in figure 10 and the growth rates are presented in table I. In the new series, the level of GDP per worker-hour is generally lower than in GGDC. The average growth rate is significantly lower in the 1950s and less so in the 1960s, but is higher in the period between 1973 and 1986. In GDP per worker-hour terms, the result is thus less negative than implied by GGDC for the slowdown years.
]]>GDP per worker-hour, Portugal, 1950-2007 (PPP 1990 Geary-Khamis dollars)
[figure 10]
Practical implications: a comparison with Spain
As shown above, the differences between the Ameco and GGDC series in the 1970s and 1980s lead to two entirely different scenarios with respect to the mid-1970s slowdown of the Portuguese economy. Whereas GGDC data indicate a paltry Portuguese performance in terms of productivity, Ameco’s correspond to a respectable one. The consequences for the interpretation of the Portuguese economy’s performance in that period can perhaps be best understood if put into a comparative framework. A comparison with Spain shows that, according to Ameco figures, the two economies slowed-down in the mid-1970s essentially in the same manner: both grew very quickly during the 1960s, in per capita as well as per worker terms; then, during the 1970s, slowdown was similarly stronger in both measures. As shown in table V, Portugal went from an average growth rate of GDP per capita of 6.43% between 1960 and 1973 to one of 1.21% between 1973 and 1986, whereas in Spain the figures were 5.99% between 1960 and 1974 and 0.87% in 1974 to 1986; in terms of GDP per worker the evolution is similar in the two countries: 6.61% to 3.01% for Portugal between the two periods, and 6.4% to 2.92% for Spain. According to Ameco figures, we would thus have an essentially similar performance between the two countries. That is not the case with GGDC data: although decline in GDP per capita is virtually identical between them (6.95% to 1.62% in Portugal from 1960-1973 to 1973-1986, and 7.24% to 1.72% in Spain), it was completely different in productivity terms (6.83% to 1.13% in Portugal, and 7.44% to 3.86% in Spain). In the case of GGDC, productivity exhausts the explanation of Portugal’s slowdown, but not Spain’s, where a still respectable productivity performance was not reflected in GDP per capita.
Growth rates of GDP per capita, GDP per worker, and GDP per worker-hour, Portugal and Spain, 1950-2007
(percentage)
]]> [table V]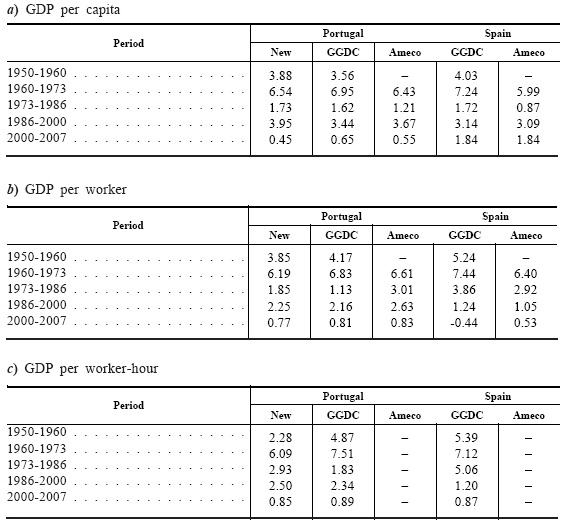
These contradictions show that, depending on the dataset used, one extracts entirely different conclusions on the comparative behavior of the Portuguese and Spanish economies. According to Ameco figures, the two economies’ slowdowns were not due to serious productivity problems, but rather to employment problems. According to GGDC figures, this is Spain’s problem only; Portugal’s problem is essentially one of productivity. The lessons to draw are consequently entirely different. The new series presented in this paper, although marginally improving the productivity record of the Portuguese economy, confirm the general idea transmitted by GGDC: if the slowdown in GDP per capita was similar in Portugal and in Spain, the slowdown in productivity was much stronger in Portugal than in Spain.
Conclusion
Ameco and GGDC datasets lead to two contrasting pictures of the performance of the Portuguese economy during the slowdown period of the mid-1970s. Although they display virtually no difference in terms of GDP per capita, the same does not occur with GDP per worker, with Ameco showing higher rates in that period. These differences lead to two entirely different interpretations of the performance of the Portuguese economy during the mid-1970s slowdown. Whereas GGDC data indicate a very poor Portuguese performance in terms of productivity from the mid-1970s to the mid-1980s, Ameco’s indicate the opposite.
I showed in this paper that the reason for this is the different employment data used in the two data sets and that the origin of the problem is the low quality of the official population statistics from the 1960s to 1973. In order to tackle this problem I built new and more reliable series for population, employment, hours of work, and consequently, for GDP per capita, per worker, and per worker-hour in Portugal from 1950 to 2007. Although imperfect, I believe the new series are considerably better than those available until now.
References
]]>Baganha, m. i. (1994), “As correntes emigratórias portuguesas no século xx e o seu impacto na economia nacional”, Análise Social, xxix (4), pp. 959-980. [ Links ]
Baganha, m. i., and Marques, j. c. (2001), “População”. In N. Valério (ed.), Estatísticas Históricas, Lisbon, INE.
Cabral, m. v. (1983), “A economia subterrânea vem ao de cima: estratégias da população rural perante a industrialização e a urbanização”, Análise Social, xix (2), pp. 199-234. [ Links ]
Cann, j. p. (1998), Contra-Insurreição em África: O Modo Português de Fazer a Guerra, 1961-1974, Lisbon, Atena.
Cónim, c. (1976), Algumas Considerações sobre a Situação Demográfica Portuguesa de 1960 a 1975, Lisbon, INE.
Cónim, c. (1977), Estimativas da População Residente no Continente, Açores e Madeira, por Sexos e Grupos Etários em 31 de Dezembro (1941-1975), Lisbon, INE.
Eurostat, AMECO, http://ec.europa.eu/economy_finance/ameco/user/serie/SelectSerie.cfm.
GGDC (Groningen Growth and Development Centre), http://www.ggdc.net/databases/ted.htm
Guimarães, F. L. M. (1966), Estatísticas da Duração do Trabalho, Lisbon, FDMO.
INE, Instituto Nacional de Estatística, http://www.ine.pt/xporta/.
]]> INE (1980), Anuário Estatístico, Lisbon, INE.INE (1961-1991), Anuário Estatístico, Lisbon, INE.
INE (1979-1982), Inquérito Permanente ao Emprego, Lisbon, INE.
INE (1983-1994), Inquérito ao Emprego, Lisbon, INE.
INE (1970), Recenseamento Geral da População, Lisbon, INE.
Maddison, A. (1989), World Economy in the Twentieth Century, Paris, OECD.
Maddison, A. (1995), Monitoring the World Economy, 1820-1995, Paris, OECD.
Maddison, A. (2006), The World Economy, Paris, OECD.
Nazareth, J. M. (1984), “Conjuntura demográfica da população portuguesa no período de 1970-80: aspectos globais”, Análise Social, xx (2-3), pp. 237-262. [ Links ]
Nunes, A. B. (1989), População Activa e Actividade Económica em Portugal dos Finais do Século XIX à Actualidade, PhD dissertation, Lisbon, ISEG.
]]> Nunes, A. B. (2001), “Actividade económica da população”. In N. Valério (ed.), Estatísticas Históricas, pp. 149-195, Lisbon, INE.OECD (various years), Labour Force Statistics, Paris, OECD.
OECD (2008), Employment Outlook 2008, Paris, OECD.
Pinheiro, M. (1997), Séries Longas para a Economia Portuguesa, Pós-II Guerra Mundial, vo. i, Séries Estatísticas, Lisbon, Banco de Portugal.
Pires, R. P., et al. (1984), Os Retornados, Um Estudo Sociográfico, Lisbon, IED.
Series
]]> [table A.I]
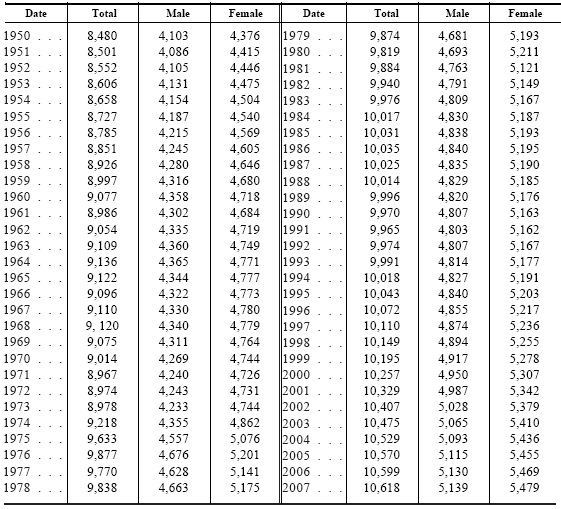
Active Population, Portugal, 1950-2007 (1000 of persons)
[table A.II]
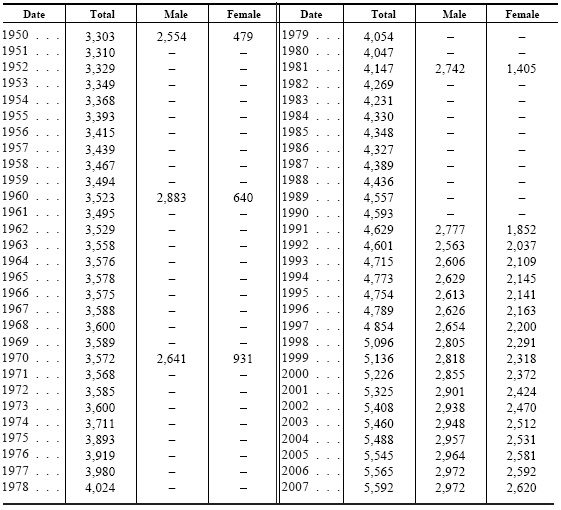
Employment, Portugal, 1950-2007 (1000 of persons)
[table A.III]
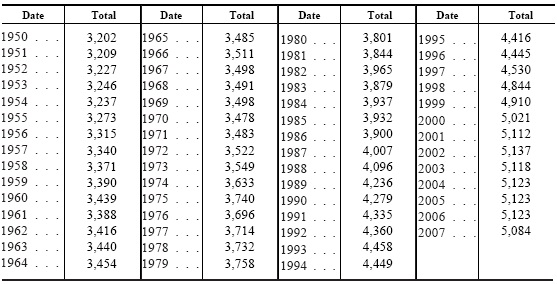
Annual Hours of Work, Portugal, 1950-2007
[table A.IV]
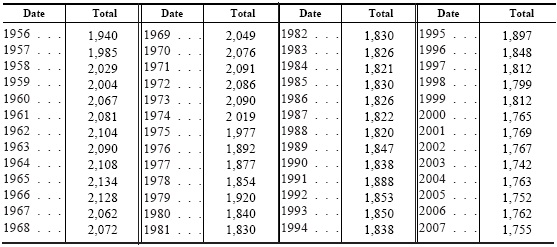
GDP per capita, Portugal, 1950-2007 (PPP 1990 Geary-Khamis dollars)
[table A.V]
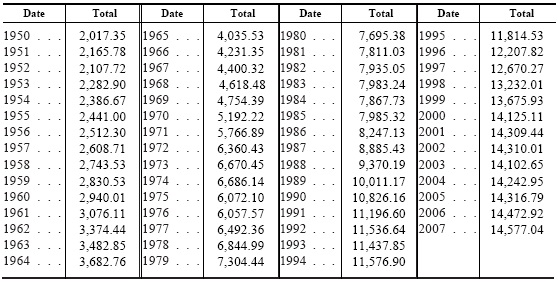
GDP per worker, Portugal, 1950-2007 (PPP 1990 Geary-Khamis dollars)
]]> [table A.VI]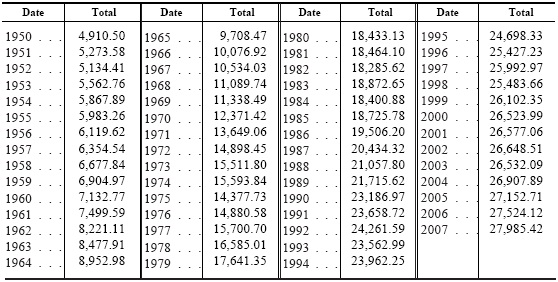
GDP per worker-hour, Portugal, 1950-2007 (PPP 1990 Geary-Khamis dollars)
[table A.VII]