
Determinação de cobalto em vinho e mosto por espectrofotometria deabsorção atómica com atomização electrotérmica. desenvolvimento evalidação do método de análise
S. Catarino1,2*, A. Neves1,2, R. Bruno de Sousa2
1Instituto Nacional de Recursos Biológicos, I.P. /INIA - Dois Portos, 2565-191 Dois Portos
2Instituto Superior de Agronomia, Departamento de Química Agrícola e Ambiental, Universidade Técnica de Lisboa. Tapada da Ajuda, 1349017 Lisboa.
*Corresponding author: evn.sofia.catarino@mail.net4b.pt
(Manuscrito recebido em 05.10.09. Aceite para publicação em 19.11.09)
SUMMARY
]]> An electrothermal atomization atomic absorption spectrometry method was optimized to quantify cobalt in musts and wines, especially within quality control scope. As far as wine samples are concerned, the method involves reduced risk of contamination by eliminating prior treatment other than dilution (1:2). For must samples a pre-treatment is needed, in order to destroy the organic matter that could interfere with the analytical determination. A conventional thermal program (with pyrolysis step), with and without matrix modifier [Mg(NO3)2], was developed and optimized. Pyrolysis and atomization curves were studied using a Co standard solution, must and wine samples. The analytical figures of merit of the method such as linearity of the calibration curve, specificity (standard additions test), accuracy, analytical limits and precision were studied using wine samples. The linear dynamic range under optimized conditions was 0.4-10.0 μg/L. The recoveries were between 87% and 98% for all of the wines and addition levels used in the test. The method presents a very satisfactory specificity for red wines, while matrix effect was observed for white wines. The limit of detection in undiluted wines was 0.8 μg/L. Repeatability was lower than 0.7 μg/L (RSD < 5%). For accuracy evaluation, Co content in six wine samples and one Co standard solution, from an international collaborative trial, was determined by ETAAS and ICP-MS with comparable results (in general the differences were lower than 5%). Bearing in mind that must samples are previously digested, it is expected that the method performance parameters are at least as favourable as those observed with wines.Palavras-chave: vinho, cobalto, validação do método de análise, espectrofotometria de absorção atómica com atomização electrotérmica
RESUMO
Apresenta-se a optimização de um método de análise para a determinação de cobalto, em mostos e vinhos, por espectrofotometria de absorção atómica com atomização electrotérmica. A preparação das amostras de vinho consiste na sua diluição (1:2), pelo que o risco de contaminação é reduzido. No caso das amostras de mosto, é necessário eliminar previamente a matéria orgânica, susceptível de causar interferências na determinação analítica. Foi optimizado um programa térmico convencional (com etapa de pirólise), com e sem adição de modificador de matriz [Mg(NO3)2]. As curvas de pirólise e de atomização foram estabelecidas com recurso a uma solução padrão de Co, mosto e vinho tintos. Foram avaliadas as seguintes características do método: linearidade da curva de calibração, especificidade (teste das adições de padrão), exactidão, limites analíticos e precisão. A gama de trabalho do método é de 0.4 a 10.0 μg/L. As taxas de recuperação variaram entre 87% e 98%, para todos os vinhos e níveis de adição utilizados no teste. A especificidade do método é bastante satisfatória para vinhos tintos, tendo sido verificada a existência de efeito de matriz nos vinhos brancos. A quantidade mínima de analito doseável em vinhos é de 0,8 μg/L e o valor da repetibilidade inferior a 0,7 μg/L (CV < 5%). A exactidão do método foi avaliada por comparação de resultados analíticos obtidos por aplicação do método proposto (ETAAS) e de um método ICP-MS, a amostras originárias de um ensaio colaborativo internacional. As diferenças observadas foram, em geral, inferiores a 5%. É de admitir que as características do método (com excepção da praticabilidade), quando aplicado a mosto, sejam no mínimo tão favoráveis quanto aquelas observadas na sua aplicação a vinhos, uma vez que as amostras de mosto são previamente mineralizadas.
Keywords: wine, cobalt, analytical method validation, electrothermal atomization atomic absorption spectrometry
INTRODUCTION
The presence of heavy metals in wines is of special special concern, particularly within the technological, sensory and food safety scope. Over the last years, aspects associated with contaminant metals evolution throughout the winemaking process, endogenous and exogenous presence, contamination sources, levels of occurrence and development of analytical methods, have been deeply investigated in order to prevent undesirable contaminations (Médina et al., 2000; Almeida, 2002; Gómez et al., 2004a; Nicolini et al., 2004; Catarino, 2006; Catarino et al., 2006a; Garcia Esparza et al., 2006; Catarino et al., 2008).
Cobalt is an essential element, potentially toxic in case of excessive intake (Galgano et al., 2008). The levels of Co that have been found in grape berries and musts are lower than 3 mg/Kg (dry weight) (Tokalioglu et al., 2004) and 4 µg/L (Catarino et al., 2006a), respectively. According to monitoring studies carried out all over the world, the cobalt content in wines does not normally exceed 15 µg/L. Greek wines, from different types and different vintages, were analysed by Soulis et al. (1984), and yielded Co concentrations always lower than 8 µg/L. A large number of German white wines (127) were studied by Gómez et al. (2004b) showing Co levels between 0.4 µg/L and 15 µg/L. These results are consistent with those of Thiel et al. (2004). Slightly low concentrations were measured in Canadian wines: a mean concentration of 2.27 µg/L in 59 wines from Okanagan and 4.02 µg/L in 36 wines from Niagara (Taylor et al., 2003). Similar concentrations were also observed by Greenough et al. (1997) in Canadian wines. Information on 120 Italian wines was provided by Galgano et al. (2008), indicating a Co mean concentration close to 5 µg/L. Concerning Portuguese wines, the authors found a maximum value of 2.5 µg/ L in wines obtained by microvinification processes. Soares et al. (1995) observed a mean concentration of 9.6 µg of Co in twenty Port wines, with values ranging between 3.2 µg/L and 16.7 µg/L.
]]> As a result of contamination, Co concentration in must and wine can increase due to bentonite used as a technological aid for clarification purposes (Nicolini et al., 2004; Catarino et al., 2008). Enrichments may also occur from the attack of alloys by cobalt (Curvelo-Garcia, 1988) and in the bed-filtration of wine (Eschnauer et al., 1989).Currently, the concentrations of only few elements in wines are under International Organization of Vine and Wine regulation, and no maximum Co concentration limit in wines is established (OIV, 2009). Nevertheless, the increasing concern for health effects and environmental exposure will probably result in a longer list of potentially toxic elements to be monitored.
The content of Co in must and wine have been determined by several techniques, among them, electrochemical methods such as voltammetry (Soulis et al., 1984), electrothermal atomization atomic absorption spectrometry (ETAAS) (Soares et al., 1995) and mainly by multi-elemental techniques such as inductively coupled plasma mass spectrometry (ICP-MS) (Almeida and Vasconcelos, 2002; Gómez et al., 2004; Thiel et al., 2004; Catarino et al., 2006b) or inductively coupled plasma optical emission spectrometry (ICP-OES) (Eschnauer et al., 1989; Minnaar et al., 2005).
The technique of FAAS shows insufficient detection capacity (with typical detection limits in the sub mg/ L range), considering the range of concentrations found in most wines. The standard additions method, used in these situations, is not a good enough alternative since it presents low precision for the lowest Co concentrations, among other drawbacks (Miller and Miller, 1993). On the other hand, the alternative of sample pre-concentration decreases the practicability of the method. It is well known that sample preparation step is very important in the whole analytical protocol. A possible source of error during this step is sample contamination and an analyte loss. Nevertheless, FAAS was applied to evaluate the content of Co in grapes, after a conventional procedure of sample preparation (Tokalioglu et al., 2004). Recently, Fabani et al. (2009) attempted to apply this technique to assess Co content in wines, without success.
Some of the strengths of the ETAAS technique are the low detection limits allowing the measurement of trace metals in most wines, with minimum sample preparation required, high sample throughput, and lower cost compared to ICP-MS technique. When information is needed on only Co element in musts and wines, ETAAS could be a more appropriate solution than ICP-OES (detection limits for most metals are in the range of 1 to 10 μg/L) or ICP-MS (detection limits typically lower than 0.01 μg/L).
To our knowledge, the literature available on Co determination in musts and wines by ETAAS is scarce and overall, not fully validated (Soares et al., 1995). The aim of the present work was to develop, validate and discuss an analytical method for the determination of cobalt in musts and wines using ETAAS, applicable for routine control purposes.
MATERIAL AND METHODS
Instrumentation
The ETAAS instrument used was a Perkin Elmer Model 4110 ZL graphite furnace atomic absorption spectrometer (PerkinElmer Life and Analytical Sciences, Shelton, CT, USA), using Zeeman-effect background correction (to minimize the unspecific absorption), a model AS-72 autosampler, and PerkinElmer AAWinLab software, version 2.5. Argon N50 (purity > 99,999%), was used to protect and purge the graphite tubes with an internal flow rate of 250 mL/min. A PerkinElmer Lumina hollow cathode lamp was used. The spectrometer settings for pyrolytically coated graphite tubes with end caps and L'vov platforms are given in Table I. The measurement mode was integrated absorbance. The autosampler was programmed to pipette 20 μL of the sample (Co standard solution, must, wine) and 5 μL of the matrix modifier onto the platform.
]]> ICP-MS measurement (quantitative approach) of cobalt in wine was carried out as previously reported by the authors (Catarino et al., 2006b). A PerkinElmer Elan 9000 apparatus, equipped with a crossflow nebulizer, a Scott-type spray chamber made of Ryton, nickel cones, and a peristaltic sample delivery pump (a four channel model Gilson) were used. The autosampler (PerkinElmer AS-93 Plus) was protected by a flow-laminar clean room, class 100 (Max Petex Reinraumtechnik). The application software was Elan-6100/windows NT, version 2.4.Furnace thermal program and operating conditions
Programa térmico da câmara de grafite e condições operatórias
Materials and reagents
For ETAAS analysis, standard solutions (1.0; 2.5; 5.0; 7.5 and 10.0 μg/L) were daily prepared from a 1000 mg/L solution (CertiPUR, Merck) of Co in HNO3 (0.2% v/v) (Ultrapure, J.T. Baker) and C2H6O (6% v/ v) (Lichrosolv, Merck), with purified water (conductivity lower than 0.05 μS/cm). Magnesium nitrate, from Merck, was used as chemical modifier in the standard solutions and samples [15 μg Mg(NO3)2], as recommended by PerkinElmer. Must and wine samples were diluted 1:2 HNO3 (0.2%). Musts were previously treated by wet digestion with HNO3 (5% v/v) at a temperature of 95º C, as described by Neves (2009). Immediately after preparation, the standard and sample solutions were transferred to polyethylene material. Standards and samples were analysed in triplicate.
For ICP-MS optimization procedures, monoelement standard solutions of Be, Co, In (1000 mg/L), from Merck, and a solution with Mg, Cu, Rh, Cd, In, Ba, Ce, Pb and U (10 μg/L), from PerkinElmer, were used. Ultrapure concentrated HNO3 (J.T.Baker), C2H5OH (Lichrosolv, Merck) and Au (Merck, 1000 mg/L) for wash, blank, and standard solutions were used. ICPMS quantitative calibration was established with a multielement standard solution with 30 elements, including Co element (PerkinElmer III, 10 mg/L). A ten-fold final dilution of wine samples, without any further sample preparation, was used for ICP-MS analysis.
HNO3 and a solution of Rh (1 mg/L) were added to samples in order to provide a final concentration of 1% (v/v) and 10 μg/L, respectively. Blank solution and standards contained 1% HNO3 (v/v), 1% C2H5OH (v/v) and 10 μg/L of Rh. The operating conditions were optimized as previously reported (Catarino et al., 2006b).
]]> To avoid contamination of the samples, all glassware and polyethylene material (volumetric flasks, micropipette tips, and autosampler cups) were immersed at least for 24 hours in 20% (v/v) HNO3, and then rinsed thoroughly with pure water before use. The water purification system was a Seralpur Pro 90 CN purifier (Seral, Ransbach-Baumbach, Germany).Thermal program optimization
The ETAAS interferences depend mainly on the applied analytical conditions for measurement, and a careful optimization of the temperature program for Co is needed. Chemical modification is recommended in order to maximize permissible pyrolisis temperature and to minimize interferences as well as to alter carbon-cobalt interactions (Schlemmer and Radziuk, 1999). Magnesium was chosen as the matrix modifier because of its recognized thermal stabilization characteristics for cobalt, being recommended by the ETAAS apparatus manufacturer (PerkinElmer, 1995). The thermal program was optimized towards obtaining a more sensitive and reproducible method and also for reducing the respective costs and analytical time.
The dry step was established by the visual control of the sample behaviour during the heating stage and by the consistency of instrumental output.
A conventional thermal program (with pyrolysis step), with and without matrix modifier [15 μg Mg(NO3)2], was developed. For the pyrolysis and atomization steps, the variation of the integrated absorbance with temperature was studied. The influence of different temperatures, ramp, and hold times were also assessed. This work was carried out with a 2 μg/L aqueous Co standard, in parallel with must and red wine sample solutions. In order to obtain high absorbance signals, the red wine was spiked with a Co standard solution, 3 μg/L and 5 μg/L for pyrolysis and atomization optimization study, respectively. This approach was used because we could not find a wine with (natural) high content of this element.
Validation of the method
The method was validated according to the methodology described by Miller and Miller (1993), Bouvier (1994) and OIV (2005). The essays for the assessment of the figures of merit were carried out with aqueous standard and wine samples.
Linearity, specificity/selectivity and accuracy
Calibration against acidified standard solutions was carried out, in the working range from 0 to 10 μg/L (1.0; 2.5; 5.0; 7.5 and 10.0 μg/L). Two white wines and two red wines were spiked with four concentration levels of Co (between 5 μg/L and 19 μg/L), never exceeding the total concentration of 20 μg/L. The linearity (y = a+bx) of the calibration and standard addition curves was investigated (test of the linearity assumption: Fisher-Snedecor test). The specificity of the method was checked using recovery assays by adding known amounts of Co to different chosen samples (never exceeding the total concentration of 20 μg/L), and processing the samples in the same way as experimental wine samples. In order to investigate the existence of matrix effect, the slopes of standard additions curves were compared (t test) (Bouvier, 1994).
An efficient way for the quality control of the analytical results is through the analysis of certified reference materials (CRM). However, to the best of our knowledge, reference wines with certified concentrations of Co are not available. The accuracy of the proposed method was evaluated by using a series of samples already studied. Seven samples from an OIV collaborative trial for metal determination in wines by ICP-MS, with reference values (not certified values) for Co content calculated based on results from 12 laboratories, were used. Three white wines (C, D and F), 3 red wines (A, B and E) and a Co standard solution (MH2) were analysed by ETAAS and by quantitative calibration ICP-MS (Catarino et al., 2006b). Then, a regression line to compare the analytical methods and detect potential systematic errors was established. This approach described by Miller and Miller (1993) is almost universally adopted in comparative studies of instrumental methods but we are fully aware that some objections may arise. Despite the theoretical objections, such procedure seemed to us more appropriate (a large concentration range is used) than the comparison of the means (t test) of two samples.
]]> Analytical limits (determination on blank)Where measurements are made at trace levels, as Co content in wine, it is important to know what is the lowest concentration of the analyte that can be confidently detected by the method.
The detection limit was calculated as the mean concentration, plus three standard deviations of the blank of calibration (0.2% HNO3 + 6% C2H6O), obtained with 20 independent determinations. The quantification limit was calculated as the mean concentration, plus 10 standard deviations of the blank. For analytical limits assessment, three independent essays were carried out.
Precision
Repeatability (within-run precision) was assessed following the basic protocol and calculations recommended by OIV (OIV, 2005). A number of 12 test materials, six white wines and six red wines, at several concentration levels, were tested in duplicate.
RESULTS AND DISCUSSION
Thermal program optimization
The drying of the sample is the first important program optimization step. A two-stage procedure for this step proved convenient. During the first stage (110ºC), the alcohol volatilizes without spattering and the drying of the sample is completed during the second stage (130ºC).
The results of pyrolysis and atomization optimization for an aqueous Co standard (2 μg/L) and must and wine solutions (diluted 1:2), with matrix modifier addition [15 μg Mg(NO3)2], are shown in Figure 1. The pyrolysis curves were run measuring the integrated absorbance of Co as a function of pyrolysis temperature, using a constant atomization temperature (2400ºC, as recommended by manufacturer). The results show that the matrix modifier was able to stabilize Co up to 1400ºC (standard solution and red wine) and 1500ºC (must). Above these temperatures, Co starts to be lost prior to atomization.
]]> Atomization curves show the relation between integrated absorbance and atomization temperature (pyrolysis temperature of 1400ºC). High absorbance signals and satisfactory peak shape were obtained at 2100ºC, for standard solution and both samples. The results of pyrolysis and atomization optimization, without matrix modifier, were previously described by Neves (2009). Without matrix modifier addition, a lower absorbance signal for the red wines was observed (Neves, 2009), suggesting the loss of analyte. In conclusion, the determination of Co can be carried out with or without matrix modifier. However, the conventional program with Mg(NO3)2, allowed a higher sensitivity and consequently that was the procedure selected for method validation. The overall optimized furnace program is summarized in Table I.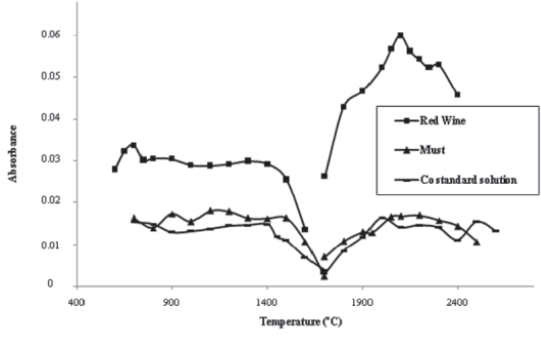
Fig. 1 -Thermal program optimization: pyrolysis and atomization curves of Co standard solution (2 μg/L), red wine and must (diluted 1:2), with matrix modifier [15 μg Mg(NO3)2].
Optimização do programa térmico: curvas de pirólise e de atomização de solução padrão de Co (2 μg/L), vinho tinto e mosto (diluição 1:2), com modificador de matriz [15 μg Mg(NO3)2].
Validation of the analysis method
Linearity of the calibration curve, specificity and accuracy
Calibration against acidified standard solutions was carried out. Curves of standard additions were obtained spiking two white wines and two red wines with Co standard solution. A high correlation coefficient of the calibration curve (R = 0.998) was observed. Nevertheless, its linearity and the linearity of standard additions curves were investigated.
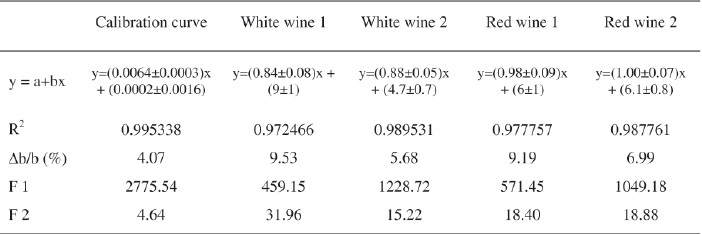
The results presented in Table II show that Δb/b coefficient of the calibration curve is lower than 5%. As regards to standard additions curves, this coefficient is higher than 5%. For each curve, a high percentage of the total variance is explained by the regression, which has a calculated F (F1) higher than the Fisher-Snedecor's F (95% confidence level). The residual variance due to the adjustment error is significant in all cases (F2) (Bouvier, 1994). Although the residual variability is very low, since the pure error and adjustment error are not of the same magnitude, the test is significant. This may result from the small variability within each group because the replicates are not independent (different concentrations were prepared from aliquots of the same master solution). Thus, it can be concluded that the calibration curve presents a satisfactory adjustment to linear model.
]]> For red wines, the slope of the curves plotted by wine standard additions (wine Co concentration as a function of Co additions) are not different from 1, meaning that there is no matrix effect (OIV, 2005). Thus, the method presents a very satisfactory specificity (selectivity) for red wines (Figure 2). For white wines, matrix effect was observed.Additionally, the slopes of wine standard additions curves were compared by the t-test. For each pair of curves, the value of Student t (2n-4 degrees of freedom, n=15), at 95 % confidence level, was calculated. The results were as follows: when wines of the same type (white or red wines) were compared, the t value was lower than theoretical value [t(0.05; 26) = 1.706]. When wines of different type were compared (a red wine with a white wine, or vice-versa), t values were higher than theoretical t, confirming the existence of matrix effect (Neves, 2009).
Spiking wine samples with aqueous Co gave recoveries between 87% and 98%: 91±15%, 87±4%, 92±9% and 98±8% (recovery ± standard deviation), for white wine 1 and 2, red wine 1 and 2, respectively. According to the slope values (alternative approach), recoveries were of 84% (white wine 1), 88% (white wine 2), 98% (red wine 1) and 100% (red wine 2). These recovery percentages are acceptable and similar to those obtained by Soares et al. (1995) using ETAAS, and to those observed by the authors using the ICP-MS technique (Catarino et al., 2006b).
TABLE II
Characteristic parameters of calibration and (wine) standard additions curves (variance analysis of the linear regressions)
Parâmetros característicos da curva de calibração e das curvas de adição de padrão (análise de variância das regressões lineares)
As previously referred, the attempt to get reference wine material for this parameter had no success. Hence, for validation of ETAAS method, three white wines, three red wines and one standard solution originating from a collaborative study, were measured both by ETAAS and ICP-MS. The results, including those of the collaborative trial (not certified values), are shown at Figure 3. Concerning samples E and F, Co concentrations were below the analytical limits of the method. The differences between the results obtained by the two techniques (ETAAS and ICPMS analysis carried out at our laboratory) do not exceed 5%, with exception of samples C and MH2. Despite the low number of points (n = 5), linear least squares adjustment was applied to samples A, B, C, D and MH2 analysed by ICP-MS (x-axis) and ETAAS (y- axis). The regression line of the global results yielded the equation: y = (0.957 ± 0.002) x + (5 ± 18), (95% confidence level), with a correlation coefficient of R = 0.9999, suggesting high precision for both of the methods. A deviation of the slope from unity indicates proportional discrepancies between the two methods. A non-zero intercept is diagnosed as a constant discrepancy. A high correlation was found, being very close to unity. The ETAAS results are slightly lower than ICP-MS results, suggesting the existence of a slight bias. On the other hand, the comparison between ETAAS and ICP-MS collaborative trial results (from 12 laboratories) shows differences up to 25%. However, it should be noted that the Co results of the collaborative trial were not satisfactory and an additional test is running.

Curvas de adição de padrão (vinho)
Analytical limits
Variation of analytical limits between essays was observed: the values ranged between 0.01 and 0.37 μg/L (detection limit) and between 1.02 and 1.62 μg/ L (quantification limit). Admitting the worst case situation, the experimental conditions enable to detect 0.4 μg/L and to quantify 1.6 μg/L. These values are lower than the detection limit of 1.6 μg/L reported by Soares et al. (1995) and, as expected, higher than the detection limit for Co determination by ICP-MS technique (Catarino et al., 2006b), 0.0004 μg/L. The method is suitable for quality control purposes, since the quantification limit allows the Co quantification from 3.2 μg/L in undiluted wines. Ideally the analytical limits should be re-determined regularly, which would be hardly feasible by this methodology.

Fig. 3 -Levels of cobalt in wines (A, B, C, D, E and F) and Co standard solution (MH2) determined by ETAAS and ICPMS, including the results (not certified values) of a collaborative trial (12 laboratories). The y-axis represents the logarithm of concentrations.
Teores de cobalto nos vinhos (A, B, C, D, E, F) e na solução padrão (MH2) determinados por ETAAS e ICP-MS, incluindo resultados (valores não certificados) de um ensaio colaborativo (12 laboratórios). As concentrações são apresentadas em escala logarítmica.
Precision
According to the used methodology, the repeatability of the results is lower than 0.7 μg/L (95% confidence level). The relative standard deviation ranged between 0.4 and 4.6%, which is very satisfactory. This value is lower than 6.8% reported by Soares et al. (1995) using ETAAS and, as expected, higher than those reported by the authors using ICP-MS (Catarino et al., 2006b).
]]> As previously pointed out, validation procedures were carried out with standard solution and wine samples, not with must samples. Nevertheless, unlike wine, must samples are previously treated in order to destroy the organic matter that could interfere with the analytical determination by ETAAS. Thus, it can be admitted that digested must presents a less complex matrix than wine, reducing the occurrence of interferences. Therefore, it is expected that the method figures of merit are at least as favourable as those observed with wines, with exception of its practicability.
CONCLUSIONS
The analytical method proposed, of cobalt determination by atomic absorption spectrometry with electrothermal atomization, is suitable for the quantification of this heavy metal in musts and wines at residual levels. The quantification can be carried out using a conventional thermal program with or without matrix modifier [Mg(NO3)2]. However, the addition of matrix modifier enables higher sensitivity, and it was the chosen procedure for validation, with wine samples. The method presents a low limit of detection and is enough precise and accurate, enabling high sample throughput, essential for the routine control purposes. For wine, dilution is the only sample preparation step necessary, reducing the risk of sample contamination. The results of the method validation results were obtained with wine samples and are only indicative for must samples. Nevertheless, bearing in mind that must samples are previously digested, it can be expected that the method figures of merit are at least as favourable as those observed with wines (with exception of its practicability).
REFERENCES
Almeida C.M.R., 2002. Isotopic and multi-element characterisation of wine for identification of lead contamination sources and of the provenance region. Doctoral thesis, 252 p. Faculdade de Ciências, Universidade do Porto, Porto.
Almeida C.M., Vasconcelos M.T.S.D., 2002. Advantages and limitations of the semi-quantitative operation mode of an inductively coupled plasma - mass spectrometer for multi-elemental analysis of wines. Analytica Chimica Acta, 463, 165-175.
Bouvier J.C., 1994. Guide d'évaluation et validation d'une méthode d'analyse chimique. 219 p. INRA, Narbonne.
[ Links ]Catarino S.C.G., 2006. Metais contaminantes nos vinhos. Ocorrência por influência das bentonites. Doctoral thesis, 158 p. Instituto Superior de Agronomia, Universidade Técnica de Lisboa, Lisboa.
]]> Catarino S., Capelo J.L., Curvelo-Garcia A.S., Bruno de Sousa R., 2006a. Evaluation of contaminant elements in portuguese wines and original musts by high intensity focused ultrasound combined with inductively coupled plasma mass spectrometry. Journal International des Sciences de la Vigne et du Vin, 40 (2), 91-100.Catarino S., Curvelo-Garcia A.S., Bruno de Sousa R., 2006b. Measurements of contaminant elements of wines by inductively coupled plasma mass spectrometry. A comparison of two calibration approaches. Talanta, 70, 1073-1080.
Catarino S., Madeira M., Monteiro F., Rocha F., Curvelo-Garcia A.S., Bruno de Sousa R., 2008. Effect of bentonite characteristics on the elemental composition of wine. Journal of Agricultural and Food Chemistry, 56, 158-165.
Curvelo-Garcia A.S., 1988. Controlo da Qualidade dos Vinhos. Química Enológica. Métodos Analíticos. 420 p. Instituto da Vinha e do Vinho, Lisboa.
Eschnauer H., Jakob L., Meierer H., Neeb R., 1989. Use and limitations of ICP-OES in wine analysis. Mikrochimica Acta, III, 291-298.
Fabani M.P., Toro M.E., Vázquez F., Diaz M.P., Wunderlin D.A., 2009. Differential absorption of metals from soil to diverse vine varieties from de valley of tulum (argentina): consequences to evaluate wine provenance. Journal of Agricultural and Food Chemistry, 57, 7409-7416.
Galgano F., Favati F., Caruso M., Scarpa T., Palma A., 2008. Analysis of trace elements in southern Italian wines and their classification according to provenance. LWT- Food Science and Technology, 41, 1808-1815.
García-Esparza M.A., Capri E., Pirzahed P., Trevisan M., 2006. Copper content of grape and wine from italian farms. Food Additives and Contaminants, 23 (3), 274-280.
Gómez M.D.M.C., Brandt R., Jakubowski N., Andersson J.T., 2004a. Changes of the metal composition in German white wines through the winemaking process. A study of 63 elements by inductively coupled plasma-mass spectrometry. Journal of Agricultural and Food Chemistry, 52, 2953-2961.
Gómez M.M.C., Feldmann I., Jakubowski N., Anderson J.T., 2004b. Classification of German white wines with certified brand of origin by multielement quantitation and pattern recognition techniques. Journal of Agricultural and Food Chemistry, 52, 2962-2974.
]]> Greenough J.D., Longerich H.P., Jackson S.E., 1997. Element fingerprint of Okanagan valley wines using ICP-MS: relationships between wine composition, vineyard and wine colour. Australian Journal of Grape and Wine Research, 3, 75-83.Médina B., Augagneur S., Barbaste M., Grousset F.E., Buat-Ménard P., 2000. Influence of atmospheric pollution on the lead content of wines. Food Additives and Contaminants, 17 (6), 435-445.
Miller J.C. and Miller J.N., 1993. Statistics for analytical chemistry, 3rd edition. 233 p. Ellis Horwood, PTR Prentice Hall Analytical Chemistry Series.
Minnaar P.P., Rohwer E.R., Booyse M., 2005. Investigating the use of element analysis for differentiation between the geographic origins of western cape wines. South African Journal of Enology and Viticulture, 26 (2), 95-105.
Neves A.C.H.S., 2009. Desenvolvimento e aplicação de métodos de análise por técnicas espectrométricas para controlo da qualidade do vinho. Master thesis, 55 p. Instituto Superior de Agronomia, Universidade Técnica de Lisboa, Lisboa.
Nicolini G., Larcher R., Pangrazzi P., Bontempo L., 2004. Changes in the contents of micro- and trace-elements in wine due to winemaking treatments. Vitis, 43 (1), 41-45.
OIV, 2009. Compendium of International Methods of Analysis of Wine and Musts. International Organization of Vine and Wine, Paris.
OIV, 2005. Resolution Oeno 10/2005. A pratical guide for the validation, quality control, and uncertainty assessment of an alternative oenological analysis method. 71 p. International Organization of Vine and Wine, Paris.
PerkinElmer, 1995. The THGA Graphite Furnace: Techniques and Recommended Conditions. PerkinElmer, Germany.
Pyrzynska K., 2004. Analytical methods for the determination of trace metals in wine. Critical Reviews in Analytical Chemistry, 34, 69-83.
]]> Schlemmer G., Radziuk B., 1999. Analytical Graphite Furnace Atomic Absorption Spectrometry. A laboratory guide. 286 p. Birkhauser Verlag, Basel, Switzerland.Soares M.E., Bastos M.L., Ferreira M.A., 1995. Quantification of Ag, Co, Si, and Zn in Port Wine by Atomic Absorption Spectrometry. Atomic Spectroscopy, 6, 256-260.
Soulis Th., Voulgaropoulos A., Kofidou Th., 1984. Teneurs de certains vins grecs du commerce en plomb, cuivre, cadmium, zinc, nickel et cobalt. Connaissance de la Vigne et du Vin, 18 (3), 177-184.
Taylor V.F., Longerich H.P., Greenough J.D., 2003. Multielement analysis of Canadian wines by inductively coupled plasma mass spectrometry (ICP-MS) and multivariate statistics. Journal of Agricultural and Food Chemistry, 51, 856-860.
Thiel G., Geisler G., Blechschmidt I., Danzer K., 2004. Determination of trace elements in wines and classification according to their provenance. Analytical and Bioanalytical Chemistry, 378, 1630-1636.
Tokalioglu S., Kartal S., GuneS A.A., 2004. Statistical evaluation of bioavailability of metals to grapes growing in contaminated vineyard soils using single extractants. International Journal of Environmental Analytical Chemistry, 84 (9), 691-705.
]]>