Luís Soares Barreto
Jubilee Professor of Forestry
Av. do M.F.A., 41-3D, 2825-372 COSTA DA CAPARICA
Abstract
The author analysis the structure and the dynamic of self-thinned uneven-aged mixed stands of Quercus robur + Fraxinus excelsior, and Alnus rubra + Pseudotsuga menziesii + Picea sitchensis. He depicted the influence of competitive hierarchy, proportions of the species, and age upon them. Stochastic simulations of the stands with European species are also presented and commented.
Key words: Competitive hierarchies; self-thinned uneven-aged mixed stands; stand structure; stand dynamics; stochastic simulation
]]> A Mistura de Geometria dos Povoamentos Auto-Desbastados Mistos e Irregulares
Sumário
O autor analisa a estrutura e a dinâmica de povoamentos auto-desbastados irregulares mistos de Quercus robur + Fraxinusexcelsior, e Alnus rubra + Pseudotsuga menziesii + Picea sitchensis. Evidencia a influência que nelas exercem a hierarquia competitiva, proporções das espécies e idade. Apresenta e comenta simulações estocásticas dos povoamentos com as espécies europeias.
Palavras-chaves: Dinâmica dos povoamentos; estruturas dos povoamentos; hierarquias competitivas; povoamentos auto-desbastados irregulares mistos; simulações estocásticas
Les Mixages de Géométrie des Peuplements Mixtes Irréguliers et Auto Éclaircis
Résumé
L'auteur analyse la structure et la dynamique des peuplements mixtes irréguliers et auto-éclaircis de Quercus robur + Fraxinusexcelsior, et Alnus rubra + Pseudotsuga menziesii + Picea sitchensis. Il met en évidence l'influence de la hiérarchie compétitive, les proportions des espèces et leurs âges. Il présente et commente également des simulations.
Mots clés: Dynamique des peuplements; structure des peuplements; hiérarchies compétitives; peuplements mixtes irréguliers et auto-éclaircis; simulations stochastiques
]]> Introduction
In Barreto (2002), I illustrated the changing geometry of self-thinned even-aged mixed stands (SEMS). In this same paper, I also stated that self-thinned uneven-aged mixed stands (SUMS) are mixtures in space of the geometries that succeed in time, in SEMS, because there is a time-space symmetry between SEMS and SUMS.
For the sake of illustrative completeness, in the present article, I will attempt to evince the influence of age, competitive hierarchy, and the proportions of trees in the dynamic parameters of the populations in SUMS.
The models, simulations, and analysis here introduced are grounded in my integrated theory of self-thinned stands, particularly for SEMS, and SUMS (Barreto, 1989, 1990, 1997a,b, 1999a,b, 2000,2001,2002). I already disclosed several applications, in Visual Basic 6, to simulate SEMS.
In a previous paper (Barreto, 1998), I already modeled, simulated, and proposed management guidelines for SUMS of Pinus pinaster + Quercus robur, and Pinus pinaster + Acer pseudoplatanus.
For the prosecution of my purpose, I will analyze two different SUMS, that naturally occur in Europe, and in North America.
A very common mixture in Europe is the stands with Quercus robur (Qro) + Fraxinus excelsior (Fre). This is my choice for the SUMS with two species.
For an example of a SUMS with three species, I elected Alnus rubra (Aru) + Pseudotsuga menziesii (Pme) + Picea sitchensis (Psi).
From here on, I will use the following acronyms: SEPS for self-thinned even-aged pure stands, and SUPS for self-thinned uneven-aged pure stands. I will refer to forest variables as yijt. The meanings of the subscripts are as follows: i= power of the linear dimension associated to the variable; j individualizes the variable; t= refers to the age, in years.
Finally, I will present stochastic simulations of the SUMS of the European species, following the simulative strategy introduced in Barreto (2006).
]]> This article is a revised and enlarged version of Barreto (2003).
General Issues and Assumptions
My theory for SEMS assumes that with species of very close competitive ability, the dynamics of the number of trees per area unit (y-21t) as in SEPS, can be modeled by a Gompertz equation, such as:
y-21t= y-21f R-2exp(-c(t-t0)) (1)
being: c, and R-2 constant values for a given species; t0 the age when the stand enters the 3/2 power line, here equal to 10 years; y-21t0= the number of trees per area at age t0; y-21f =the final or asymptotic value of the variable; R-2= y-21t0 /y-21f. In mixed stands, c and R-2 change with the proportions of the species, and the variation of their relative competitive abilities, thus with age.
I also adopt the following notation and units: y11t = tree dbh at age t, cm; y12t= tree height at age t, m; y14t= stem standing volume per area unit, m3/area unit; y1j= any of the previous variables, with i=1; y31t= tree stem volume at age t, m3.
In the characterization of the SUPS with European species, I made them symmetric of SEPS with 10000 trees per area unit at age 10. The SUPS with North-American species are symmetric of SEPS with 12000 trees per area unit.
The SUMS with European species are symmetric of SEMS with a total number of trees per area unit, at age 10, equal to 10000. The same figure for SUMS with North-American species is 12000 trees per area unit.
The fraction of trees of a species, in the SUMS, refers to the fraction of trees fr, at age 10, in a symmetric SEMS.
]]>The Stands with Qro, and Fre
Qro, and Fre are two species that have a broad, and almost coincident distribution in Europe. It is not surprising the existence of mixed stands with them.
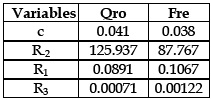
In Table 1, I introduce the specific values of the dynamics of the pure stands of Qro, and Fre.
Table 1 - Specific values of Qro, and Fre
In Table 2, I show the age classes I adopted, and the competitive hierarchies prevalent in each age class, and referred to ages 19.5, 39.5, 59.5, 79.5, 99.5, 119.5. In the first three classes, Qro is dominant; in classes IV, V, VI the competitive hierarchy is reversed, as the ratio "relative growth rate of Qro/relative growth rate of Fre" is greater then 1. With rigor, Qro is dominant for ages equal or less than 61 years.
]]> Table 2 - Structures and competitive hierarchies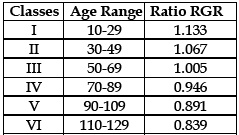
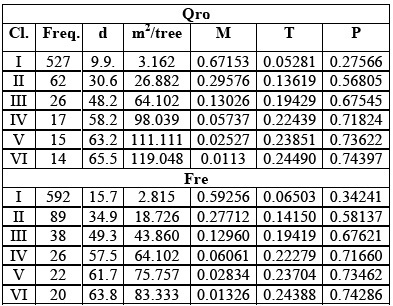
For comparative purposes, in Table 3, I exhibit the structures and dynamics of the SUPS of each species. From here on, I use the following notation, referred to a age class, and a period of five years: M=fraction of trees that is self-thinned; T=fraction of trees that moves to the next class; P=fraction of trees that remains in the class.
Table 3 - The characterization of the SUPS of Qro, and Fre. Freq=trees/class; d=class mean dbh
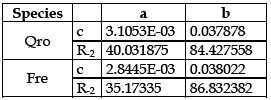
I simulated SEMS of Qro, and Fre with the fraction of Qro with values 0.2, 0.3,...0.8, to fit the following equation for the population parameters c, and R-2:
c or R-2= a fr + b (2)
]]> The values of a, and b are exhibited in Table 4.
Table 4 - The values of a, and b in eq. (2). r2=0.999 for Qro:c; Fre:c, R-2; r2=1.000 for Qro: R-2
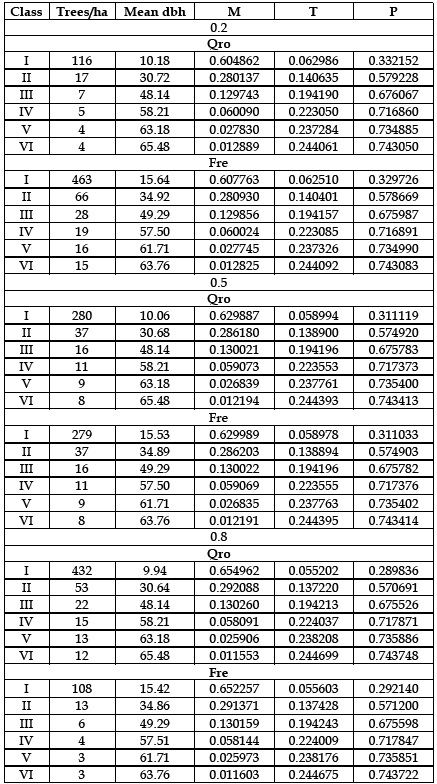
For the previous mentioned simulations, I characterized the stands for fr=0.2, 0.5, 0.8 of Qro, in Table 5. Tables 3, and 5 must be compared.
Table 5 - The structures, and dynamic parameters of simulated SUMS Qro+Fre
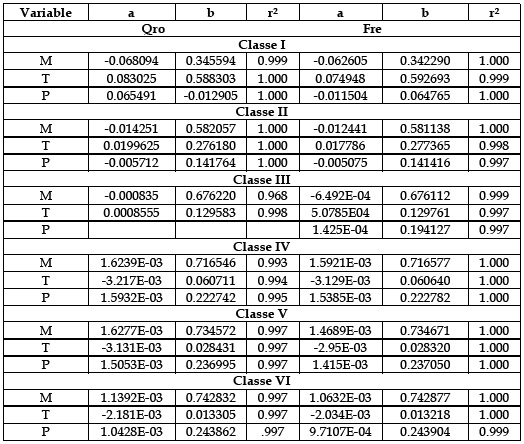
]]> For the parameters M, T, P, of each class of the simulated stands, I also fitted eq. (2), as shown in Table 6.
Table 6 - SUMS Qro+Fre. The fitting of eq. (2) to the simulated values of M, T, and P
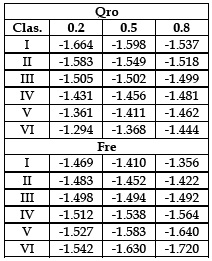
For the midle age of the classes upper mentioned, and for fr=0.2, 0.5, 0.8, I estimated the power (b(t)) of y-21 in the allometric equation that relates it to the mean tree volume (the 3/2 power law, in SEPS). These values are exibited in Table 7.
Table 7 - SUMS Qro+Fre. Values of b(t). t=19.5, 39.5,... 119.5
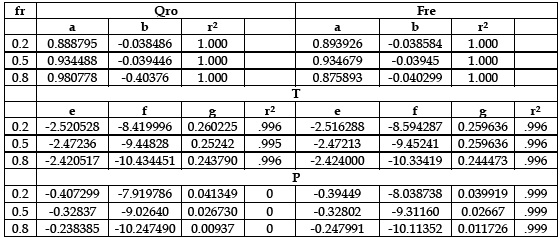
]]> Finally, I established equations for the variables M, T, P with age, for fractions of Qro equal to 0.2, 0.5, 0.8.
The equations for M are the following ones:
M=a exp(b t) (3)
For T, and P the equation is:
T or P=exp(e+f/t+g ln t) (4)
In Table 8, I exhibit the values of the parameters of eqs. (3), (4).
Table 8 - SUMS Qro+Fre. Constants in eqs. (3), and (4)
]]> The structures of the SUMS exhibited are stable, for the span of ages considered. The competitive ability declines with age, and after stabilize. Very old trees do not bring more insight to the competitive situation.
In rigor, each group of trees of the same age has its own geometry, and dynamics. For the sake of clarity of explanation, and analysis, I aggregated the trees in age classes. I consider trees with less then 10 years as regeneration.
It is also implicit in the way I present my results, in this paper, that I consider all SUMS with the same tree size, but occupying a variable area.
The Stands with Aru, Pme, and Psi
Mixed stands with Aru, Pme, Psi occur naturally in North-America.
In my analysis, my assumption about the longevity of Aru is optimistic: 89 years. Thus, I consider only four age classes, with the same span as for the SUMS Qro+Fre.
In North-American forest literature, there is a large bibliography about these three species. Thus, I will not engage in any characterization of them.
From here on, I design the fraction of trees at age 10, of Aru as x1, and the one of Pme as x2. The fractional composition of the stands, number of trees at age 10 of the simmetric SEMS, is designated in the following order: Aru, Pme, Psi. In the triplet 0.2/0.2/0.6, the figures correspond to the species Aru/Pme/Psi.
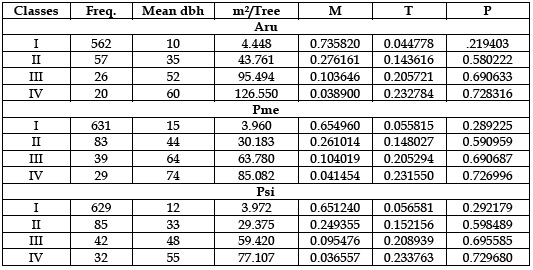
As I already did, I start by presenting the characteristic parameters of the species (Table 9), and the structures of their SUPS (Table 10).
]]>Table 9 - The characteristic parameters of Aru, Pme, Psi
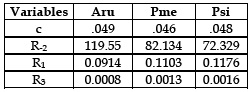
Table 10 - The structures of SUPS Aru, Pme, Psi. They are symmetric of SEPS with 12000 trees/area unit
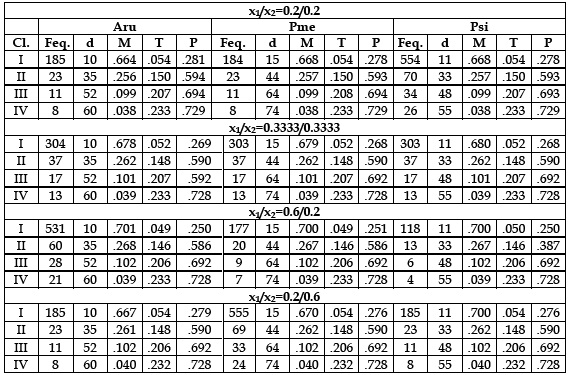
With three species, there is a great variety of combinations of the proportions that can be considered for simulative purposes. I simulated the structure and dynamics of the following combinations of x1, and x2 (x1/x2): 0.2/0.2, 0.3333/0.3333, 0.6/0.2, 0.2/0.6, 0.4/0.3, 0.3/0.4, 0.5/0.25, 0.25/.5, 0.25/0.25. The competitive hierarchies observed are the following ones: till age 16 Aru>Psi>Pme; 16<age<59: Aru>Pme>Psi; after age 59: Pme>Aru>Psi. These species have very close relative growth rates (Barreto, 1999a).
In Barreto (1999b), I introduced a simulator for SEMS Aru+Pme+Ps.
For illustrative purposes, in Table 11, I exhibit the structures and the dynamic parameters (M,P,T) of four SUMS, of the type I am analysing.
]]>Table 11 - The structures and dynamic parameters of four SUMS Aru+Pme+Psi
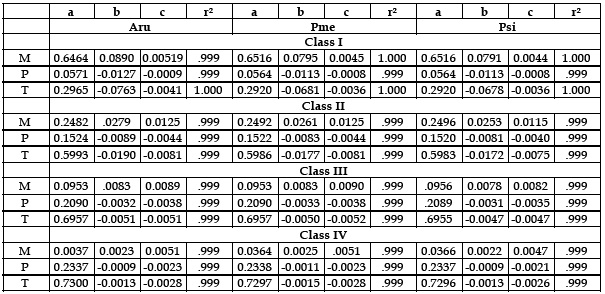
For the values of M,P,T of the simulated SUMS, I fitted the following equation:
M, T, or P=a+bx1+cx2 (5)
The values of the constants in eq. (5) are displaied in Table 12.
Table 12 - SUMS Aru+Pme+Psi. The constants in eq. (5)
In Table 13, I insert the values of b(t), of the SUMS described in Table11.
Table 13 - The values of b(t) of the SUMS described in Table 11. t=19.5, 39.5, 59.5, 79.5

The Stochastic Simulations of the SUMS Qro+Fre
Comparing my approach to pure stands (Barreto, 2006), for the sake of completeness, I will introduce the results of simulations of SUMS Qro+Fre. The strategy and modelling approach I here use is described in the same reference, and I will not repeat it here, although I consider convenient to include the description of the main algorithm as follows:
Generate a random numberà generate a random value for sà calculate mà calculate cà multiply the figures in the first lines of the matrices in table 14 by cà calculate the new frequencies of the classesà for each class, calculate the area occupied by the mean treeà check, and adjust, if the upper limits of the classes are violatedàcalculate the total area occupied by the new frequenciesàcheck if this area is greater then 10000 m2, and eventually adjust the frequenciesàuse the new value of total density, and the previous one to calculate the natural logarithm of their ratio (growth rate) s is a random variable with lognormal distribution; m is an intermediate variable used in the mechanism of homeostasis of the stand, that is regulated by r. The greater is r, the greater is c. When r=1 the stand behaves as in a deterministic environment.
I chose the stands 0.5/0.5, in Table 5. The two projection matrices are described in Table 14.
]]>Table 14 - The two projection matrices of the SUMS Qro+Fre
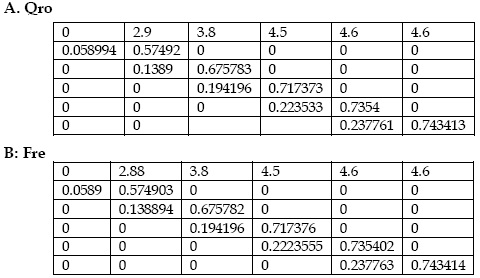
The stable age distribution of the SUMS is (trees/ha):
Qro: 281; 38; 15; 10; 8; 7. Fre: 280; 38; 15; 10; 8; 7. Total density: 717 trees/ha.
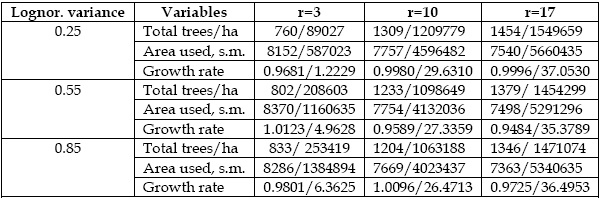
I used a lognormal distribution with mean 6.57507, being the variances equal to 0.25, 0.55, and 0.85. r assumes the values 3, 10, 17.
For each combination variance/r, I run 10 simulations for 105 periods of 5 years. I retained the final 100 values of each run, and I calculated the arithmetic mean of the density, and area used (m2), and the geometric mean of the growth rate. Also their variances were estimated. The means of these values, for each statistic, were finally calculated, and displayed in Table 15. Each simulation started with 104 trees in class I, of each species. At the end of the 105 loops both species can either coexist or one had been extinguished. It is assumed that every five years, trees older then 129 years are removed.
Table 15 - Results of the stochastic simulations of the SUMS Qro+Fre. Figures as follows: mean/variance. The greater is r, the greater is the response of the forest to environmental changes
]]>
To render the effect of r clearer, I introduce Figure 1.
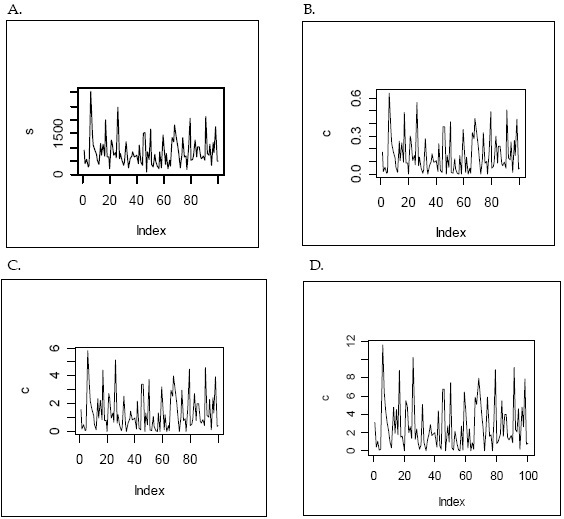
Figure 1 - A. Random values of s for LN (6.57507, 0.55). B. Values of c when r=1.1. C. Values of c when r=10. D. Values of c for r=20. A constant density was used (717 trees/ha)
The Simulations
Before I introduce the results of the simulations, it is worthwhile to stress some aspects of the structure and dynamics of mixed stands. Given the time-space symmetry between even-aged and uneven-aged stands, for the sake of clarity, I concentrate my attention on the former stands. They evince:
a) Shifts of competitive hierarchy (Table 2).
]]> b) Changing allometry (Barreto, 2007).c) Sensitivity to the initial conditions, or the butterfly effect (Barreto, 2005a, 2005b: chapter 11), as illustrated in Figure 3.
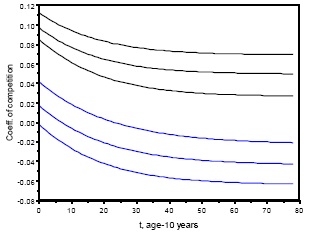
Figure 2 - Coefficients of competition for the mixture Q. robur+F. excelcior, ages 10 to 88 years. Top three lines mirror the effect of the ash upon the oak. In each group, from top to bottom: proportions of 0.2, 0.5, 0.8 of the oak, at age 10 years. If the proportion of Qro is low, in the initial years of the SEMS, both species can benefit from the association. This fact facilitates the establishment of this type of SEMS
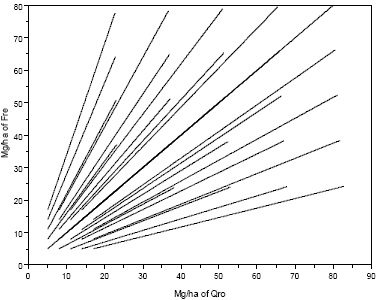
Figure 3 - The sensitivity of the growth of total biomass of SEMS Qro+Fre to the initial values (deterministic butterfly effect). Mg of dry matter
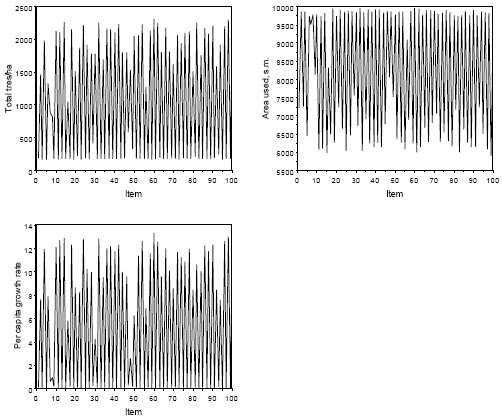
Given these characteristics, the stochastic simulations of SUMS are difficult to interpret, to detect patterns of variation in their results, and are not exempt of some unexpected results. In Table 15, I summarize the results of the simulations I realized.
Now, I will elaborate the comments on Table 15. For the reasons already explained, they are few.
As expected, the variances of the population parameters follow the variance of the lognormal distribution, and they increase with r.
With level of generalization that I can not estimate, it is observed that increasing r promotes the occurrence of stands with more trees, but with larger proportions of small individuals, and less area used.
I am not able to depict other consistent patterns of variation of the population characteristics here simulated.
Final Comments
I admit that I satisfied the purposes of this paper: a) to illustrate the blended geometry of SUMS, thus b) to complete the information displayed in Barreto (2002, 2007), dedicated to the changing geometry of SEMS.
]]> If anyone carefully scrutinizes the information here exhibited, he or she will verify that the results of my simulations are intrinsically coherent. The effects of the proportions of the species, and their relations of competitive dominance are consistent with my theory for self-thinned mixed stands. In the SUMS Aru+Pme+Psi the transitivity of the competitive hierarchies is shown.When there is an increasing interest about continuous cover forestry, favouring mixed uneven-aged stands, I hope my analysis may contribute for a better forestry practice, with this type of stands. The management of this stands it is not an easy task.
References
Barreto, L.S., 1989. Even-aged Self-thinned Stands of Corsican pine and Maritime pine. Departamento de Engenharia Florestal, Instituto Superior de Agronomia, Lisboa.
Barreto, L.S., 1990. Two Species Even-aged Stands. A Simulation Approach. Departamento de Engenharia Florestal, Instituto Superior de Agronomia, Lisboa.
Barreto, L.S., 1997a. Coexistence and Competitive ability of tree species. Elaborations on Grime theory. Silva Lusitana 5(1): 79-93. [ Links ]
Barreto, L.S., 1997b. Instrumentos para a condução de povoamentos mistos regulares de pinheiro bravo e folhosas. Silva Lusitana 5(2): 241-256. [ Links ]
Barreto, L.S., 1998. Povoamentos mistos irregulares de pinheiro bravo e folhosas. Silva Lusitana 6(2): 241-245. [ Links ]
Barreto, L.S., 1999a. A tentative typification of the patterns interaction with models BACO2 and BACO3. Silva Lusitana 7(1): 117-125. [ Links ]
Barreto, L.S., 1999b. US-EVEN. A program to support the forestry of some even-aged North-American stands. Silva Lusitana 7(2): 233-248. [ Links ]
Barreto, L.S., 2000. SB-MIXPINAST. A Simulator for a few Mixed Stands with Pinus pinaster. Departamento de Engenharia Florestal, Instituto Superior de Agronomia, Lisboa.
Barreto, L.S., 2001. O Modelo BACO3 para a Competição entre Plantas. Research Paper SB-02/01. Departamento de Engenharia Florestal, Instituto Superior de Agronomia, Lisboa.
Barreto, L.S., 2002. The Changing Geometry of Self-Thinned Mixed Stands. A Simulative Quest. Research Paper SB-02/02. Departamento de Engenharia Florestal, Instituto Superior de Agronomia, Lisboa.
Barreto, L.S., 2003. The Blended Geometry of Self-Thinned Uneven-Aged Mixed Stands. Research Paper SB-04/03. Departamento de Engenharia Florestal, Instituto Superior de Agronomia, Lisboa.
Barreto, L.S., 2005a. Gause's Competition Experiments with Parameciumsp. Revisited. Research Paper SB-01/05. Departamento de Engenharia Florestal, Instituto Superior de Agronomia, Lisboa.
Barreto, L.S., 2005b. Theoretical Ecology. A Unified Approach. Author's edition, disseminated in pdf format. Costa de Caparica.
Barreto, L.S., 2006. The Stochastic Dynamics of Self-Thinned Pure Stands. A Simulative Quest. Silva Lusitana 14(2): 227-238. [ Links ]
Entregue para publicação em Outubro de 2007
]]> Aceite para publicação em Junho de 2008 ]]>