
Temporal clustering detection of disease in agricultural crops
Detecção de agrupamento temporal de doenças em culturas agrícolas
Ana Lúcia Souza Silva Mateus1and João Domingos Scalon2
1Federal University of Santa Maria (UFSM), Center of Exact and Natural Sciences, Departament of Statistics, Av. Roraima 1000, ZipeCode: 97105-900, Santa Maria, RS, Brazil. *E-mail: analucia.stat@gmail.com
2Federal University of Lavras (UFLA), Departament of Exact Sciences, CP 3037, ZipeCode: 37200-000, Lavras, MG, Brazil.
ABSTRACT
]]> Information about temporal dynamics of plant diseases is of paramount importance for appropriate technologies development for diseases management in production systems. The major interest when studying a temporal point pattern is to detect temporal clustering of events. There are some methods available for events cluster detection over time. The majority of these methods has been developed to detect temporal clustering inhuman diseases. The temporal patterns analysisfor plant diseases are not very well described in the literature. In this study, we aimed to propose new methods, based on both empirical distribution function and Monte Carlo simulation, for testing the null hypothesis that a temporal point pattern is purely random. These methods are compared to the time K-function for detecting temporal clustering for incidence of citrus sudden death disease in orange trees. All methodologies were found to show good performance for analyzing temporal point patterns and they led to the detection of temporal clustering of the citrus sudden death disease in an orange trees planting.Key words: Citrus sinensis, counting process, disease spread, homogeneous Poisson point process, hypotheses testing.
RESUMO
Informação sobre dinâmica temporal de doenças de plantas é de suma importância para o desenvolvimento de tecnologias apropriadas para o manejo de doenças em sistemas de produção. O principal interesse quando se estuda um padrão de ponto temporal é detectar agrupamento temporal de eventos. Existem alguns métodos disponíveis para a detecção de agrupamento de eventos ao longo do tempo. A maioria destes métodos tem sido desenvolvido para detectar agrupamento temporal de doenças em humanos. A análise de padrões temporais de doenças de plantas não é muito bem descrita na literatura. Neste estudo, objetivou-se propor novos métodos, com base tanto na função de distribuição empírica como na simulação de Monte Carlo, para testar a hipótese nula de que um padrão de ponto temporal é puramente aleatório. Estes métodos são comparados com a função K-tempo para a detecção de agrupamento temporal na incidência de morte súbita dos citros em árvores de laranja. Todas as metodologias revelarambom desempenho para a análise de padrões de pontos temporais e este estudo levou à detecção de agrupamento temporal da morte súbita dos citros numa plantação de laranjeiras.
Palavras-chave: Citrus sinensis, processo de contagem, propagação de doenças, processo pontual de Poisson homogêneo, teste de hipóteses.
Introduction
The citrus sudden death disease (CSD) has killed more than a million of orange trees in Brazil in the past few years and, thus, causing severe economical losses for the Brazilian citrus industry (Bassanezi and Laranjeira, 2007; Bassanezi and Yamamoto, 2007). Symptomatic plants show a pale green coloration of the entire tree canopy, different levels of defoliation, and absence of new shoots and root system death. The disease is also characterized by the development of a strong yellow stain in to the phloem of Rangpur lime and Volkamer lemon rootstocks (Bassanezi and Yamamoto, 2007).
Two viruses similar to plants infected with CSD, the virus CTV (Citrus tristeza virus, family Closteroviridae) and a new type virus belonging to the family Tymoviridae, as well as their association with the disease has been studied (Coletta Filho et al., 2005; Maccheroni et al., 2005; Terencio et al., 2005). Up to now, the diagnostics of CSD is based on signs found in sick plants. There is still no diagnostic test by which it knows whether the plant shows CSD before it manifests typical signs of the disease. However, it is not yet fully proven that these viruses are, indeed, the causal agents of this disease.
]]> The study about temporal dynamics of plant diseases, such as the CSD, may help researchers in describing the disease dynamics, to evaluate biological hypotheses on propagation mechanisms and, to guide the proposition of new methods for controlling the epidemy, focused on the presence of the disease and not on the vector (Bassanezi and Laranjeira, 2007).The basic reference model used when studying a temporal point pattern, such as moments on which plants are infected by a disease, may be described as the homogeneous Poisson process with constant intensity, also named complete temporal randomness (CTR). By CTR we intuitively mean that events are independently random and uniformly distributed over time. This implies that there are no time periods where events are more (or less) likely to occur. In addition, the presence of an event does not modify the appearance probability of other events nearby. Thus, we may state that the homogeneous Poisson process serves as the null model in the statistical analysis for temporal events. The alternative hypothesis is that the temporal pattern tends to cluster, where a temporal clustering may be defined as an unusual aggregation of disease incidence occurring within a small temporal domain.
Temporal clustering may be informally detected by plotting the temporal point pattern as a time series and, by observing whether the points are or not more clustered than expected in a complete random point pattern. Although, visual techniques may describe what we need to know, to deep examine the CTR hypothesis, in an objective and precise manner, remains necessary the use of formal statistical methods.
There are several methods available in the literature for testing the CTR null hypothesis in point patterns and they have been applied in many fields of science, especially in epidemiology. The tests are the considered traditional among others: EdererMyersMantels test (Ederer et al., 1964), the Naus scan test (Naus, 1965), the Tangos test (Tango, 1984) and, the time scan statistic test (Kulldorff, 1997). In the current level of knowledge, these tests have not been used for temporal analysis of agricultural diseases. The majority of the temporal, specifically for CSD, are used for analyzing the disease behavior progression over time by estimating monthly rates (Batista et al., 2008) or by using spatial and temporal analyses (Bassanezi et al., 2005), models of cellular automata (Peixoto et al., 2008) and, autologistic models (Krainskiet al., 2008), rather than testing against the CTR hypothesis.
The purpose of this paper was to propose novel methods, based on both empirical distribution function and Monte Carlo simulation, for detecting temporal disease clustering. The performance of these new methods was compared to tests based on the time K-function (Diggle et al., 1995) by applying them to detect temporal pattern in the occurrence of CSD cases in a Brazilian orange trees planting.
Materials and Methods
The CSD incidence data were obtained from a plot of sweet orange trees [Citrus sinensis (L.) Osbeck], Natal variety, planted in 1990, which is in a farm located in the municipality of Comendador Gomes, State of Minas Gerais, Brazil. The geographical coordinates are the following 19o38 south and 48o58 west. These data were obtained as part of a data set collected by the Fundecitrus and they are available at the Rcitrus library (Krainski and Ribeiro Jr., 2007) in the R statistical software (R Core Team, 2014).
The plot consisted of 20 rows with 48 plants each, with spacing pattern of 7.5m x 4m. Evaluations for detecting the time of diagnosis of cases of the disease in the orange trees were performed from November 2001 to July 2003. The disease incidence was recorded with score one for those plants showing symptoms and; zero for those without symptoms.
The null hypothesis is that the observed temporal point pattern is a realization of a homogeneous Poisson process with a constant intensity λ, while the alternative hypothesis is that the observed point pattern is a realization of a clustering temporal point process.
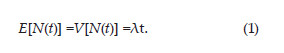
]]> T1, T2, ,Tk denotes the sequence observed events occurring over a period of time T, so that we can explore the existing dependence between temporal events in T in many different ways. Thus, we may specifically consider nearest neighbor distances (the distance from each point to its nearest neighbor) and use the cumulative distribution function of these distances (G-function) for the point pattern characterization (Ripley, 1976). We may also consider pair wise distances (the distances between all distinct pair of points) and use the time K-function for characterization of the second order properties of the temporal point pattern (Ripley, 1976; Diggle et al., 1995). If we consider the number of points in arbitrary windows moving, we can use the scan statistic for the same purpose (Naus, 1965; Kuldorff, 1997).In this work, we are suggesting the use of another counting process based method. According to Daley and Vere-Jones (2003) any nonnegative, integer-valued stochastic process {N(t); t=0} is named counting process, if N(t) represents the total number of events occurred in an (0, t) interval such that N(s)=N(t) whenever s =t. If N(t) is a homogeneous temporal Poisson point process with intensity λ>0, then
The cumulative frequency of the observed sequence of events occurring over time, , can be used as a natural estimator of E[N(t)], that is,
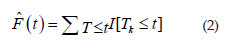
Where I is an indicator functionhaving the value 1 when the condition [.] is valid and the value 0 when the condition [.] is not satisfied.
We can thus compare with the value of λt obtained by plugging in the estimated intensity (average number of events per unit of time)
For example, considering the observing events occurring over a period of 5 units of time given by the vector [1,2,2,2,2,2,3,3,4,5,5]. It was recorded one event at the time 1, 5 events at the time two and so on. The cumulative frequency is given by =[0,1,6,8,9,11]. The estimated intensity is given by 
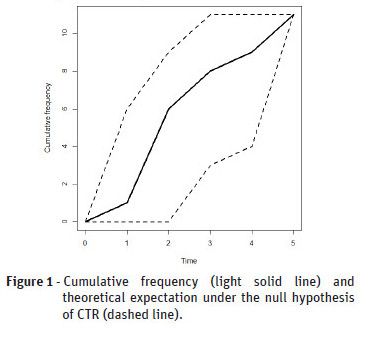
However, it is not easy to assess how far the curve should move away from the line tto provide indication for rejecting the CTR null hypothesis (Figure 1). Thus, alternatives methods are needed to this plot for a statistical CTR assessment. We advocate that these methods can be based on Monte Carlo simulations, including both the formal hypothesis test and envelopes.
For the formal hypothesis test approach, also named cumulative test, we follow the method suggested by Diggle (2003) for spatial point pattern analysis. First of all, it needs to define a measure that examines the degree of agreement betweenthe cumulative frequency against the theoretical expectation E[N(t)] under CTR. Since we are working with cumulative frequency, a natural choice is the Kolmogorov-Smirnov distance measure given by
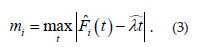
is the cumulative frequency of an observed temporal pattern with n events as defined in (2) and ,
, are cumulative frequencies from s simulations of a homogeneous Poisson point process with intensity λ. Estimates the statistic mi for the observed and simulated patterns. Then, the estimate of m1 for the observed pattern is compared with estimates m2,
,ms from the simulated patterns. If m1 ranks among the largest of m2,
,ms, it shows departure from CTR and, ifm1 = mj for any then it rejects the CTR hypotheses if 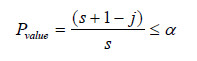
The cumulative test to the example was carried out by running 99 simulations. The estimatem1and the p-value for this data set were 1.5 and 0.84, respectively, what meaning that there is no significant statistically difference between the cumulative frequency and the theoretical expectation under CTR.
Ripley (1977) proposed the envelopes simulation approach in the context of spatial point pattern analysis. Then, we use the same idea considering the cumulative frequency and, thus, naming it cumulative envelopes. We firstly estimated , , , as described above. And, we obtained the point wise upper and lower envelopes of the simulated functions , , ,
]]>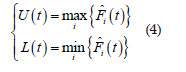
We ploted the F1(t), U(t) and L(t) estimates on the same graphic against the distance t. For those situations F1(t) was inside the simulation envelopes [L(t), U(t)] we accepted the null hypothesis of complete temporal randomness, i.e, events do not interact each other, and the expected number of events per unit of time (intensity) is constant.
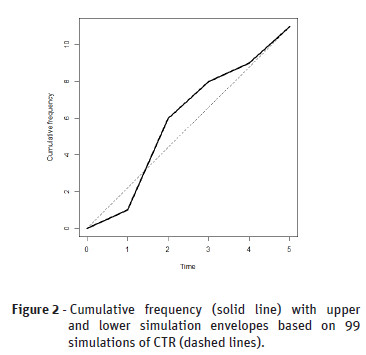
The Figure 2 shows the cumulative envelopes of the temporal point pattern that we considered before. This point pattern is compatible with CTR because the cumulative frequency is within the envelopes.
The temporal K function is an extension of the spatial K function (Ripley, 1976, 1977). It is a way of measuring second-order properties of a temporal point process and, is described by Diggle et al. (1995) as = E(number of further events within the distance t of an arbitrary event), where E(.) is the expectancy, and λ is the intensity.
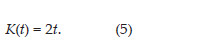
Diggle et al. (1995) show that the temporal K function for a homogeneous Poisson point process is described as
]]> An estimator that corrects the edge effects is given by the following equation:

where n is the number of events observed in the interval of time T,uij is the distance between events i and j(i ≠ j), It(uij) is an indicative function equal to 1 when uij is less than a distance t and, otherwise, equal to 0 and vij is an edge correction factor which represents a segment of a line, centered in i passing through the event jwhich is found inside the total interval of time T (Diggle et al., 1995).
Althoughmany forms for testing the null hypothesis of complete randomness of a spatial point pattern using the K-function are found in the literature (Ripley, 1976, 1977; Diggle, 2003), we have not found similar analysis for the temporal case. This work states that the temporal K function can be used in the same way as the spatial K function, using formal hypotheses tests and envelopes simulation approaches, for testing the null hypothesis of complete temporal randomness.
For the formal hypotheses tests approach, Diggle (2003) suggests the Cramer-VonMises distance measure to examine the degree of agreement between the observed and the theoretical K function under the hypotheses CTR, given by the following equation:
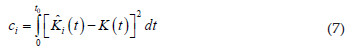
where is the estimated temporal K function, given by equation (5) and K(t) is the theoretical temporal K function, given by equation (6).
is the K-function of an observed temporal pattern with n events as defined in (2) and , , are K-functions from s simulations of a homogeneous Poisson point process with intensity estimated by λ. Significance of the observed value of the test statistic can be computed by means of a Monte Carlo test.
]]> In addition, point wise simulation envelopes under CTR of the point pattern can be computed by repeatedly simulating a homogeneous Poisson point process with the same estimated intensity under study for time T. For those situations K1(t) was inside the envelopes, we accepted the null hypothesis of complete temporal randomness, i.e, events do not interact each other, and the expected number of events per unit of time (intensity) is constant. For situations K1(t) was below the lower simulation envelope, it indicates deficiency of small distances among events in the considered time scale and that is typical for regular patterns. Otherwise, when K1(t) was above the upper simulation envelope, the situation typifies an aggregate pattern, and indicates the excess of small distances among time events in the considered time scale.We have applied K-function based methods and the proposed newtest on the example pattern and both showed that there are signs related to temporal clustering.
The new methods described in this work were run using functions developed using the R statistical software (R Core Team, 2014). Analyzes based on the temporal K function were carried out using functions available in the splancs library (Rowlingson and Diggle, 1993). Realizations of point patterns were generated using the spatstat library (Baddeley and Turner, 2005).
Results and Discussion
The focus of this study was the use of statistical methods to evaluate evidence of temporal clustering in an observed point pattern. We were specifically interested on the evaluation of cumulative test and cumulative envelopes for detecting evidence of time clustering.
Simulated temporal point patterns are show to describe the pattern of the cumulative test and cumulative envelopesunder typical temporal clustering cases. Data sets were simulated considering the occurrence of disease cases recorded for a year (365 days).We generated the Matérn cluster process, constructed by means of certain number of clusters ("offsprings") obtained from the homogeneous Poisson point process, considered the intensity λ. Then, a random cluster of points replaces each cluster, and the number of points in each cluster has a Poisson (k) distribution. These points are distributed independently and uniformly on a line segment about 2×r, centered around the clusters (Diggle, 2003; Baddeley and Turner, 2005). We used λ =0.00003, for each cluster we established a Poisson with 200 offspring, and we found that as smaller was the estimate of r, the intensity of clusters was higher. Using those parameters, we were able to generate realizations of temporal point patterns with 600 disease cases distributed in approximately four clusters per year, with different cluster intensities. We carried out the analysis using 100 Monte Carlo simulations under the CTR null hypothesis.
The first case refers to a Matérn cluster process with small line segment of clusters (r = 5), i.e, we have a pattern with well-defined heavy clusters. The cumulative test showed that there were statistical evidences to reject the CTR null hypothesis (m1=157.6; p=0.01). Figure 3-a shows that the average rate of occurrences, given by the positive inclination of the line, increased from 0 to 40 days and from 320 to365 days, while it kept constant from 40 to 320 days. Thus, this plot shows a typical temporal pattern that displays clusters at both the beginning and the end of the period under study.
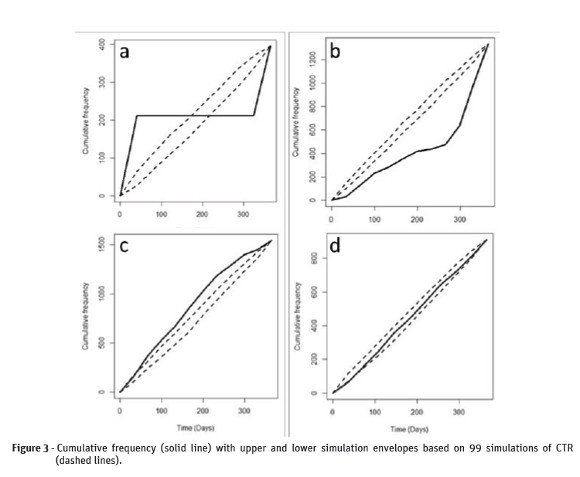
]]> The second case refers to a Matérn cluster process with r = 75, where the temporal clustering occurs in the beginning of the period under study. The Figure 3-b shows that the cumulative function is located below the lower simulation envelopes, which represents the CTR null hypothesis for the period under study. The cumulative test also shows that there are strong statistical evidences that led to the rejection of the CTR null hypothesis (m1=221.9; p= 0.01).
The third case describes the Matérn cluster process with r = 150, from which the temporal clustering occurs at the end of the period under study. The Figure 3-c shows that the cumulative function was above upper simulation envelopes for the period under study, which led to the rejection of the CTR null hypothesis. The cumulative test also led to the rejection of the null hypothesis of temporal randomness (m1=135.8; p=0.01).
The fourth case describes the Matérn cluster process with r = 300, i.e, a realization of a temporal pattern very close to the random process. The Figure 3-d shows that the cumulative function was between the simulation envelopes for the period under study, the reason why there was a strong statistical evidence that this point pattern shows complete temporal randomness.The hypothesis test led to the acceptance of the CTR null hypothesis (m1=26.0; p =0.28).
We carried out the same analysis for all four typical cases using the K-function and results (not shown here) led us to the same conclusions we found by using these methods. Results obtained with these typical cases of temporal patterns appear to show that both novel methods (cumulative test and cumulative envelopes) show good performance not only for rejecting the CTR null hypothesis in patterns that show clusters, but also for the acceptance of the CTR null hypothesis in simulated patterns that feature this pattern.
We also tested these novel methods in typical patterns that showed temporal regularity, i.e, patterns on which any of these two events were separated by a minimum interval of time (not shown here). In such patterns, these methods led to the acceptance of the CTR null hypothesis and, yet, they are not able to detect regularity. We thus realized that it would be necessary to carry out analysis of power and type I error for better evaluation of the performance of these methods for different types of patterns.
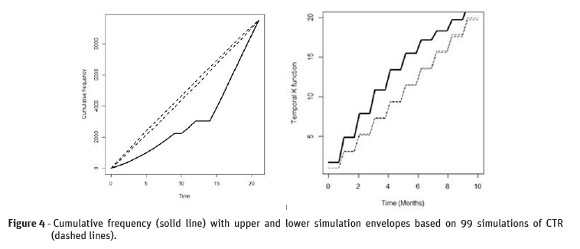
We applied both novel methods (cumulative test and the cumulative envelopes) and the K-function based methods for testing the null hypothesis that the occurrence of the CSD cases over time is a realization of a homogeneous Poisson point process with constant intensity. The cumulative test (m1=3091.86, p=0.01) and the K-function test (c1=5.16, p= 0.01) led to an emphatic rejection of the CTR null hypothesis for CSD disease cases.
The Figure 4 (left) shows that there are strong statistical evidence that the CTR null hypothesis should be rejected in favor of the clustering alternative. In addition, clusters tend to occur in the beginning of the period under study. The Figura 4 (right) shows that the observed K-function was above the simulation envelopes for the time under study. This is a strong evident that the occurrence of CSD casesshows temporal clustering.
We did not find papers in the literature addressing about the emphasis showed in this study to diagnose the presence of temporal clustering of agricultural disease cases, specifically for those related to CSD. In general, the temporal analysis appears as a byproduct of the spatial analysis (Bassanezi et al., 2003; Peixoto et al., 2008).
]]> We found that if certain plant disease was caused by the pathogen spreading process from plant to plant, one would expect an aggregation (clustering) of infected plants in space and time. Studies have suggested an aggregated spatial structure of symptomatic plants with CSD (Bassanezi et al., 2003; Bassanezi and Laranjeira, 2007), and shown that the CSD annual rate increases during periods under study (Bassanezi et al., 2003; Batista et al., 2008). The present work shows strong evidence of temporal clustering for CSD, which is mainly characterized by temporal clustering in the beginning of the trial. Thus, the temporal clustering pattern of plants affected by CSD may suggest that this disease can be caused by a pathogen. Various researches have suggested the pathogen based theory. For example, Maccheroni et al. (2005) suggest that the pathogen could be a new strain of citrus tristeza or a new virus belonging to the family Tymoviridae (gender Marafivirus) and transmitted by insects.The CSD was found to be a novel disease but sufficient temporal data are still not available so far; thus this important epidemic feature could not be thoroughly analysed.
These results show that both cumulative test and K-function test are able to test the CTR null hypothesis, but they cannot determine whether the rejection was due to the presence of clusters or due to the presence of cases that show regularity over time. Thus, if the most important in data analysis is not the rejection of the CTR null hypothesis , but the indication of the direction (regularity or cluster) that caused the rejection, the use of simulation envelopes becomes essential. It appears that the cumulative envelopes can detect only patterns with clusters. However, it is well known that the K-function simulation envelopes is able to detect patterns that exhibit both clusters and regularity (Ripley, 1976, 1977; Diggle et al., 1995). K-function envelopes are only able to detect clustering and regularity at different scales, what is not possible for cumulative envelopes, which may be used to detect the moments on which clusters occur (early or late). Therefore, cumulative and K-function based methods were found to be complementary to each other, not competitors.
Conclusions
The results shown that the cumulative test and the cumulative envelopes were able to detect temporal clustering in point patterns that have been generated by different stochastic mechanisms. The use of these novel methods along with the K-function based methods seems to provide a complete characterization of temporal clustering in disease of agricultural crops. In particular, these methods lead to an emphatically rejection of the hypothesis of complete temporal randomness in favor of the hypothesis of temporal clustering of CSD.
Acknowledgements
The authors would like to thank the FAPEMIG and FAPEAM foundations for the financial support.
]]> References
Baddeley, A. and Turner, R. (2005) - Spatstat: An R package for analyzing spatial point Patterns. Journal of Statistical Software, vol. 12, n. 6, p. 1-42.
http://dx.doi.org/10.18637/jss.v012.i06
Bassanezi, R.B.; Bergamin F.A.; Amorim, L.; Gimenes-Fernandes, N.; Gottwald, T.R. and Bové, J.M. (2003) - Spatial and temporal analyses of citrus sudden death as a tool to generate hypotheses concerning its etiology. Phytopathology, vol. 93, n. 4, p. 502-512.
http://dx.doi.org/10.1094/PHYTO.2003.93.4.502
Bassanezi, R.B.; Bergamin Filho, A.; Amorim, L. and Gottwald, T.R. (2005) - Spatial and temporal analyses of citrus sudden death in Brazil. In: Proceedings Conference of the International Organization of Citrus Virologists. Riverside, California, IOVC, p. 217-229. [ Links ]
Bassanezi, R.B. and Laranjeira, F.F. (2007) - Spatial patterns of leprosis and its mite vector in commercial citrus groves in Brazil. Plant Pathology, vol. 56, n. 1, p. 97-106.
http://dx.doi.org/10.1111/j.1365-3059.2006.01457.x
Bassanezi, R.B. and Yamamoto, P.T. (2007) - Manual da morte súbita dos citros. Araraquara, Fundecitrus, 12 p.
Received/recebido: 2015.10.01
Received in revised version/recebido em versão revista: 2015.11.30
]]> Accepted/aceite: 2016.02.15 ]]>