C.A. Martínez-Huitle,1,2,* N. Suely Fernandes,1 M. Cerro-Lopez,2 M.A. Quiroz2
1 Universidade Federal do Rio Grande do Norte, CCET – Departamento de Química, Lagoa Nova –RN, CEP 59.072-970 Brazil
2 Universidad de las Americas-Puebla, Laboratorio de Electroquímica, CP 72820 – Puebla, México
Abstract
Surface modification by chitosan (CT) on a glassy carbon electrode (GCE) was employed in the present study to determine metal traces (Cu, Pb, Cd, Co, As and Pt). Previous report about the chitosan film affinity toward positive or negative species demonstrated and allowed the application of these polymeric films for detecting heavy metals in aqueous solutions. The modified surface exhibited an affinity to chelating metal ions in solution, forming complexes. Differential pulse voltammetry combined with a pre-concentrating process and standard addition method were employed for trace analysis, obtaining the detection ranges (Cu (II) from 3.99´10-6 to 3.91´10-5 mol L-1, Pb(II) from 1.99´10-6 to 1.58´10-5 mol L-1, Cd(II) from 1.59´10-5 to 6.23´10-5 mol L-1, As(IV) from 7.99´10-6 to 5.04´10-5 mol L-1, Pt(IV) from 8.19´10-6 to 3.59´10-5 mol L-1, Co(II) from 6.11´10-4 to 2.78´10-3 mol L-1), calibrations plots and relevant equations for each metal. Finally, cyclic voltammetry technique was used to characterize the polymeric surface behavior in presence of different metals and during the differential pulse voltammetric analysis. The results are described and discussed in the light of the existing literature.
Keywords: cyclic voltammetry, chitosan-modified electrodes, heavy metals, electrochemical sensors.
]]> Introduction
In recent years, applications of chemically modified electrodes (CME) have had great interest in various areas of research and development, such as material corrosion and inhibition, electrocatalysis, electronics, biosensors and electroanalysis [1-8].
For the analysis of trace metals, CME have shown some advantages over other analytical methods and have been employed as powerful tools for concentration determination and surface structure identification [9, 10]. One of the strategies for surface modification is to employ organic ligands [11-19] which adsorb onto the electrode surface. Generally, these molecules contain conjugated benzene rings that can be easily and irreversibly adsorbed on the material electrode surface, forming the CME.
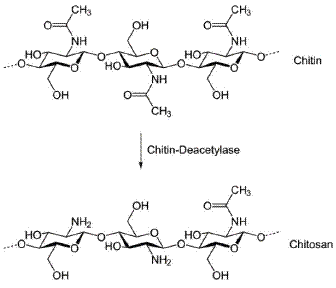
Chitosan (CT), as shown in Fig. 1, has been identified as effective reactant for chemical extraction and determination of metals [20-24]. The interest in this biopolymer for electrochemical applications is due to its combination of film-forming ability, high water permeability, good adhesion, biocompatibility, non-toxicity, high mechanical strength and susceptibility to chemical modifications. These peculiar properties depend on the presence of reactive amino and hydroxyl functional groups that lead to a large hydrophilic surface.
Figure 1. Chemical structure of chitosan.
In previous work [25], series of experiments were performed, for testing the modified electrodes at different pH values (1, 3, 5 and 7) containing a positively charged species (Ru(NH3)63+/2+). According to these results, some electrodes exhibited an only slight current increase with respect to the bare GC electrode, depending on pH solution. CT-GCEAcOH exhibits a poorer current response than that observed at the bare GCE (curve 5, Fig. 4 in Ref. 25) in presence of Ru(NH3)63+/2+, at pH values of 1 and 3. Thus, CT-GCEAcOH seems completely inactivated in the presence of positively charged species at low pH values, indicating that this behaviour was strongly dependent on pH solution and the chitosan structure. This effect could be due to the protonation of chitosan films at lower pH values that decreases the sorption capacities of chitosan towards cationic species. On the contrary, at pH 5 and 7, CT-GCEAcOH showed significant performances regarding the bare electrode (curves 3, 4, 5, Fig. 4 in Ref. 25), indicating that these modified electrodes could be a potential tool for detecting positive charged species (cations) at lower concentrations.
Therefore, at the present paper, chitosan-modified glassy carbon electrode (CT-GCE) was fabricated according to the method employed in Ref 25 and it was used to determine trace amounts of heavy metals (Cu, Pb, Cd, Co, As and Pt).
]]>Experimental
Chemicals
Chemicals were of the highest quality commercially available and were used without further purification. Chitosan (MW 1.9-3.1´105; 75-85% deacetylation) was purchased by Merck (Brazil). The other reagents were purchased from Fluka. Aqueous solutions were prepared using double-distilled deionised water and purged with nitrogen gas prior to each experiment.
Apparatus and procedures
A multi-potentiostat 1030 (CH Instruments– Austin Texas, USA) connected to a desktop computer was used for cyclic voltammetric (CV) and differential pulse voltammetric (DPV) analysis. Potential values used to obtain the cyclic voltammograms were selected in order to determine the pre-concentration potential values for each metal employed in DPV: initial potentials -0.5, -0.2, -0.9, -0.4, -0.2 and -0.2 V and end potentials about 0.5, 0.8, 0.2, 0.85, 0.95 and 0.8 V for Cu, Cd, Pb, As, Pt and Co, respectively. Scan rate of 50 mV sec-1 and phosphate buffer solution (pH 7) as supporting electrolyte solution. DPV parameters were purge time: 5 min, slow agitation, pre-concentration time of 3 min, equilibration time of 15 sec, scan rate of 10 mV s-1, pulse amplitude of 100 mV and pulse width of 50 ms. The three electrode cell assembly consisted of a CT-GCE, an Ag/AgCl (3.0 mol L-1) as reference electrode and a platinum wire as counter electrode. All the potentials are reported versus the above specified reference electrode. The experiments were conducted at room temperature (22 ± 2 °C). The pH of the solution was measured by a pH meter. All experimental results were processed by spreadsheets prepared in Mathcad 7.02a Professional (MathSoft Massachusetts, USA) [26]. Calibrations were analysed by ordinary linear least-square regression and the relevant results (slopes and intercepts) are reported with their confidence interval (P = 95%).
Solutions and CT-GCE preparation
Stock solutions of Cu, Cd and Co (1×10⁻² mol L-1) were prepared by cupric, cadmium or cobalt sulphate reagents. Pb stock solution (1×10⁻² mol L-1) was prepared by nitrate reagent. As and Pt commercial standard solutions (from J.T. Baker Instra-Analysed) were used to obtain the calibration curve for these metals (arsenic atomic absorption standard solution 1000 mg L-1 and dihydrogen hexachloroplatinate (IV) known as chloroplatinic acid (H2PtCl6) 1000 mg L-1). Nitrogen was used to expel dissolved oxygen in all solutions.
]]> Chitosan stock solution was prepared by dissolving 0.0163 g chitosan in 10 mL of 2 mol L-1 acetic acid solution. The surface of GCE was polished with alumina slurry and sonicated with deionised water, respectively, for 5 min. After sonication, the electrode was rinsed with deionised water and allowed to dry in the air. Then the electrode was coated by injecting 6.0 μL of chitosan solution with a microsyringe. CT-GCE was left to dry in air for 30 min. Before use, CT-GCE was equilibrated for about 10 min in the supporting electrolyte solution (phosphate buffer solution (PBS), pH 7). More details about the CT-GCE preparation were reported in a previous paper [25]. Every experiment was performed by using a newly prepared CT-GCE. The CT-film was removed at the end of each experiment and the electrode was polished as above described.
Discussion and results
Cyclic voltammetric experiments
Preliminary CV experiments were performed to study the behavior at bare and CT-GCE materials. The electrodes were first immersed in an electrochemical cell containing PBS (pH 7.0). It is important to remark that the protonation of amine groups is responsible for the dissolution of the biopolymer in many acidic solutions, but not in sulphuric acid and phosphate solutions [27]. For this reason, the experiments were carried out in PBS media. The voltammograms attained at both bare and CT-GCE materials were similar to those obtained in previous findings [25]. The experiments were carried out in PBS as supporting electrolyte. Fig. 2 in Ref 25 shows that the behaviour of the modified and bare GCE in the chosen supporting electrolyte (PBS) was dependent on the preparation method. CT-GCEAcOH electrode showed a lower current increase regarding the bare electrode, likely resulting from permeability changes.
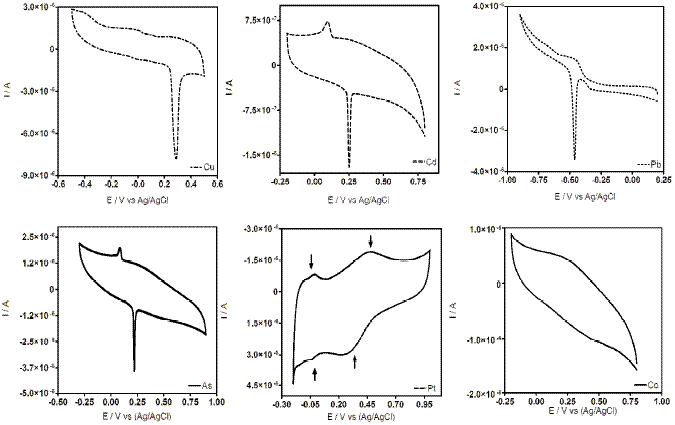
Figure 2. Cyclic voltammograms at CT-GCE after DPV experiments.
Based on previous results reported in Ref 25, CT-GCEAcOH was selected as sensor to test its properties for detecting heavy metals in aqueous solutions. Then, determinations of heavy metal traces (Cu, Pb, Cd, Co, As and Pt) were performed by differential pulse voltammetry (DPV); however, the behavior of each metal was also studied by CV in order to understand the affinity of CT film towards them.
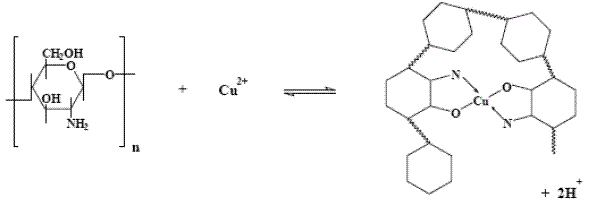
]]> CV measurements at CT-GCE were recorded during the DPV experiments (before and after DPV analyses). The cyclic voltammograms obtained at lower concentrations of metal ion did not show changes in the profile. However, at higher metal ion concentrations, CT-GCE presented a peak response in the investigated potential range after the DPV experiments (see Fig. 2). These observations suggest that the modified electrode has a strong affinity through surface coordination between metal ion and CT film. The coordination is fairly strong with two ligands around each metal ion. These surface complex structures have been already proposed by other researchers, in the case of Cu(II) [20, 28] (see Fig. 3), Pb(II) [29] and Pt [30]. According to our results, similar interaction between CT film and a specific metal was observed.
Differential pulse voltammetry
DPV was used for testing the sensitivity of CT-GCE and the relevant parameters are reported in the experimental section. For metals determination, CT-GCE was then placed in the electrochemical cell containing PBS and metal specie. The modified electrode was submersed in sample solution, maintaining a stable potential value for the pre-concentration of analytes. As discussed by other authors, the pre-concentration potential (Ep) at which the metal ion is able to deposition in the electrode surface is critical [22]. Thus, the effect of pre-concentration potential was optimized in order to obtain maximum sensitivity. Our findings showed that the sensitive, stability and reliability of peak height could be reached in the potential range between –1.0 to -0.1 V, depending on the metal determination.
Alternatively, the pre-concentration time is another important measurement parameter, which should be precisely controlled during the experiment [22]. In this frame, pre-concentration times were determined in the range of 0-9 minutes. However, it was observed that when the time was longer than about 6 minutes, the relationship between current and time would deviate from linearity. A possible explanation could be due to the surface saturation, i.e., there are no more CT molecules available to chelate the metal ion [23]. A pre-concentration time of 3 minutes was chosen for the following measurements, and then a differential pulse mode was employed to obtain the voltammograms.
Calibration curve and detection limit
DPV at different metal ion concentrations are shown in Fig. 4.
]]>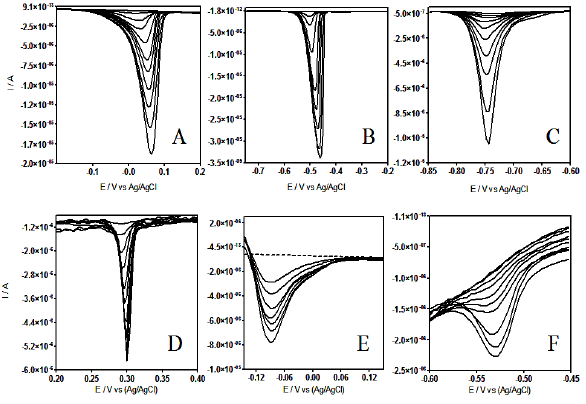
Figure 4. Differential pulse voltammograms at CT-GCE, recorded in acidic solution (pH 7.0) containing different metal ion concentrations: A) Cu (II) from 3.99´10-6 to 3.91´10-5 mol L-1; B) Cd(II) from 1.59´10-5 to 6.23´10-5 mol L-1; C) Pb(II) from 1.99´10-6 to 1.58´10-5 mol L-1; D) As(IV) from 7.99´10-6 to 5.04´10-5 mol L-1; E) Pt(IV) from 8.19´10-6 to 3.59´10-5 and F) Co(II) from 6.11´10-4 to 2.78´10-3 mol L-1.
A linear range between the peak current and metal ions (Cu, Pb, Cd, Co, As and Pt) concentration were obtained (Fig. 5) under the experimental conditions above described.
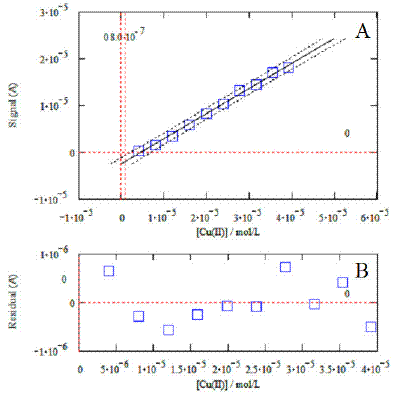
Figure 5. Example of calibration plot relevant to the analysis of copper (standard additions method). The graphic at the bottom displays the residuals.
]]>Data obtained from the analyses of metal standard solutions in the chosen medium allowed estimating the functional relationship (peak current vs. concentration), which is linear in different ranges:
a) Cu (II) from 3.99 ´ 10-6 to 3.91 ´ 10-5 mol L-1,
b) Pb(II) from 1.99 ´ 10-6 to 1.58 ´ 10-5 mol L-1,
c) Cd(II) from 1.59 ´ 10-5 to 6.23 ´ 10-5 mol L-1,
d) As(IV) from 7.99 ´ 10-6 to 5.04 ´ 10-5 mol L-1,
e) Pt(IV) from 8.19 ´ 10-6 to 3.59 ´ 10-5 mol L-1,
f) Co(II) from 6.11 ´ 10-4 to 2.78 ´ 10-3 mol L-1.
At lower concentration values the reproducibility of the response was poorer and at higher values the slope slowly decreases up to reach an asymptotic value (saturation of the electrode surface). Due to the poor improvements of CT-GCE to detect lower concentrations of Co during the DPV experiments, this metal ion was abandoned.
]]> Under optimal conditions, using the differential pulse mode and CT-GCE as electrode, the catalytic peak current was linearly dependent on the metal concentration over the ranges above mentioned. Then, the detection limits for each metal were 3.09 × 10⁻⁷ (Pb); 8.99×10⁻⁷ (Cu); 2.35×10⁻⁶ (Cd); 6.67×10⁻⁷ (As) and 3.50×10⁻⁸ (Pt) mol L-1. When the metal concentration was more than detection limit (for each metal), the current response decreased gradually and its plateau was observed; this is attributed to the saturation of CT film on the modified electrode.
Calibration plot
An example of calibration plot relevant from the DPV analysis for Cu (Fig. 4A) is shown in Fig. 5. In this case, DPV measurements were obtained by using the standard addition method. The corresponding calibration curve is shown in Fig. 5A. The relevant equation (X and Y; Cu concentration and current response, respectively) is:
Cu: Y= (0.5361± 0.0313)X – (2.3745 ± 0.7658) ´ 10-6 (a=0.05, n=10, r2=0.9949)
The window at the bottom (Fig. 5B) shows that the residuals of the regression are randomly distributed around the zero, allowing a visual verification of the absence of significant non linearity. The same mathematical procedure was also employed to obtain the calibration plots and relevant equations for each metal:
Pb: Y=(2.5763 ± 0.1913)X – (4.5964 ± 1.2922) ´ 10-6 (a=0.05, n=10, r2=0.9945)
Cd: Y=(0.2073 ± 0.0392)X – (6.3289 ± 1.9115) ´ 10-6 (a=0.05, n=10, r2=0.9836)
As: Y=(0.1375 ± 0.0092)X – (1.2101 ± 0.3507) ´ 10-6 (a=0.05, n=10, r2=0.9956)
Pt: Y=(1.0313 ± 0.0224)X – (4.3083 ± 1.147) ´ 10–7 (a=0.05, n=9, r2=0.9996)
]]>Further DPV experiments were carried out at CT-GCE in presence of several metal ions in the support electrolyte solution (PBS). According to DPV results previously obtained, the detection of Cd, Pb, Cu and As could be attained avoiding interferences between them, because their potentials were different. Under previously selected conditions, amounts of Cd, Pb, Cu and As were detected. However, the DP voltammograms have showed a preference selectivity of the CT film towards some metals and the eventual formation of an intermetallic compound, particularly when the Cu and Pb are in solution.
Matrix metal behaviour
A series of experiments were performed to determinate the selectivity for each metal into CT film. Thus, the follow order sequence was obtained: Pb > Cu > Cd > As. In order to demonstrate this behavior, each metal was added in solution separately. As was the first metal detected and its peak immediately decreased after introduce Cd in solution. Subsequently, Cu was putted in solution and it contributed to decrease the Cd peak current response. Finally, Pb showed great preference to be incorporated into CT film, displacing other metals on polymer matrix (decreasing the current response of the other metals). This behavior was verified at lower and higher metal concentrations under the detection limits above described. On the other hand, due to the poor improvements of CT-GCE to detect lower concentrations of Pt and the preference of these modified electrodes for detecting other metals (Pb, Cu, Cd and As) during the DPV experiments, this metal ion was abandoned in this section.
Fig. 6 illustrates similar preference behavior in presence of the four metals in solution. However, during these experiments a new peak around –0.37 V was achieved. This signal is due to the formation of an intermetallic compound between Cu and Pb. This outcome is in agreement with the data reported and discussed by Agra-Gutiérrez et al. [31]. Under our conditions, Cu-Pb intermetallic compound seems to depend on Pb concentration (see Fig. 6). In fact, when the Pb concentration was increased, the Cu-Pb peak response notably increased. After several tests, two series of experiments were chosen to investigate this behavior: i) CT film saturation with Pb and standard additions of Cu solution, and ii) CT film saturation with Cu and standard additions of Pb solution.
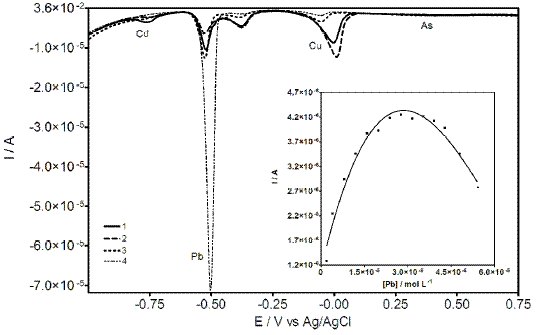
Figure 6. DP voltammograms at CT-GCE obtained in PBS containing Cu, Cd, Pb, and As at different concentrations: 1) 1.2 ´ 10-5, 1.6 ´ 10-5, 1.9 ´ 10-5, 4.31 ´ 10-5; 2) 1.8 ´ 10-5, 1.9 ´ 10-5, 1.9 ´ 10-5, 4.31 ´ 10-5; 3) 1.8 ´ 10-5, 1.9 ´ 10-5, 3.8 ´ 10-5, 4.31 ´ 10-5; 4) 1.8 ´ 10-5; 2.4 ´ 10-5; 5.5 ´ 10-5; 7.1 ´ 10-5; all concentrations are expressed in mol L-1. Inset: intermetallic compound peak behavior during additions of Pb (CT film was previously saturated with Cu).
]]> Under described experimental conditions, the results demonstrated that in both cases the formation of intermetallic compound was achieved. However, in the first case, the variation of Cu concentration did not evidence a strong influence on the formation of Cu-Pb compound. In the second case, a gradual increase in the Pb concentration leads to Cu-Pb formation until a change in the direction (formation decrease) was observed, which is also reflecting a decrease of Cu concentration (previously incorporate into Ct film). This behavior could be explained based on the preference of selectivity of CT film towards Pb, previously discussed in this study. At this regard, Pb ions displace Cu ions, which were incorporated into the CT film, and then forming the intermetallic compound. Thus, the Cu-Pb compound decreases completely to allow the saturation with Pb (see Inset Fig. 6). In fact, according to literature information, these results clearly indicate the occurrence of a copper–lead alloy, in the form of an intermetallic compound or a solid solution [30].
Stability of modified electrodes
The stability of CT-GCE electrodes also was examined in experiment. The modified electrodes were stored in the 0.1 mol L−1 PBS (pH 7) after every experiment. The cyclic voltammetric experiments were carried out using modified electrodes once a day at the same operation conditions. Calibration curves for each metal can hardly change by means of long times. Then, it showed that the chitosan sensor has a nicer stability, with relative standard deviation (RSD) of 3.5% (n=10).
Conclusions
In conclusion, it was possible demonstrating the potentiality of the proposed electrode for determining heavy metals. Such a sensor is characterized by a higher sensitivity and reproducibility than those of the bare glassy carbon electrode. The low limit of detection allows reducing matrix effects by working in highly diluted solutions. Moreover, the proposed method is cheaper than the commonly used spectroscopy adsorption analysis and than other electroanalytical methods involving more toxic or expensive modification materials (such as nanotubes or mercury polarography). The possibility of simultaneous detection of more than a heavy metal was also introduced and it is a great advantage for analysing water matrixes. The research is in progress: real samples such as tap and natural waters (from, e.g., rivers or lakes) are being tested for determining heavy metals.
References
1. V.E.M. Mouchreck Filho, G.O. Chierice, A.L.B. Marques, Quím. Nova 22 (1999) 312. 10.1590/S0100-40421999000300004 [ Links ]
2. R.W. Murray, In Chemically Modified Electrodes in Electroanalytical Chemistry; A.J. Bard, Ed.; Marcel Dekker: New York, 1984, p. 191.
3. H.D. Abruna, Coord. Chem. Rev. 86 (1988) 135. 10.1016/0010-8545(88)85013-6
4. R.W. Murray, Acc. Chem. Res. 13 (1980) 135. 10.1021/ar50149a002
5. W. Kutner, J. Wang, M. L’her, R.P. Buck, Pure Appl. Chem. 70 (1998) 1301. 10.1351/pac199870061301
6. D.W. Arrigan, Analyst 119 (1994) 1953. 10.1039/AN9941901953
7. K. Kalcher, Electroanalysis 2 (1990) 419. 10.1002/elan.1140020603
8. K. Kalcher, J.M. Kauffmann, J. Wang, I. Svancara, K. Vytras, C. Neuhold, Z. Yang, Electroanalysis 7 (1995) 5. 10.1002/elan.1140070103
9. S.K. Cha, H.D. Abruña, Anal. Chem. 62 (1990) 274. 10.1021/ac00202a010
10. J. Labuda, V. Plaskson, Anal. Chim. Acta 228 (1990) 259. 10.1016/S0003-2670(00)80502-4 [ Links ]
11. A.L.B. Marques, J. Zhang, A.B.P. Lever, W.J. Pietro, J. Electroanal. Chem. 392 (1995) 43. 10.1016/0022-0728(95)03997-U
]]> 12. J. Zhang, F.C. Anson, J. Electroanal. Chem. 341 (1992) 323. 10.1016/0022-0728(92)80491-L13. A.P. Brown, C. Koval, F.C. Anson; J. Electroanal. Chem. 72 (1976) 379. 10.1016/S0022-0728(76)80324-5
14. J. Zhang, F.C. Anson, Electrochim. Acta 38 (1993) 2423. 10.1016/0013-4686(93)85111-B [ Links ]
15. J. Zhang, F.C. Anson, J. Electroanal. Chem. 331 (1992) 945. 10.1016/0022-0728(92)85016-V
16. J. Zhang, F.C. Anson, J. Electroanal. Chem. 348 (1993) 81. 10.1016/0022-0728(93)80124-Z
17. J. Zhang, A.B.P. Lever, W.J. Pietro, Inorg. Chem. 33 (1994) 1392. 10.1021/ic00085a030
18. A.L.B. Marques, E.P. Marques, J. Zhang, W. Li, Electrochim. Acta 49 (2004) 879. 10.1016/j.electacta.2003.09.040 [ Links ]
19. A.L.B. Marques, E.P. Marques, V.L.N. Dias, E.N. Fernandes, J. Zhang, J. Power Sources 142 (2005) 10. 10.1016/j.jpowsour.2004.09.032
20. R. Schmuhl, H.M. Krieg, K. Keizer, Water SA 27 (2001) 1.
21. J. Xu, B. Liu, Analyst 119 (1994) 1599. 10.1039/AN9941901599
]]> 22. A. Riccardo, A. Muzzarelli, R. Rocchetti, Talanta 21 (1974) 1137. 10.1016/0039-9140(74)80097-423. G. Lu, X. Yao, X. Wu, T. Zhan, Michochem. J. 69 (2001) 81. 10.1016/S0026-265X(01)00066-2
24. X. Ye, Q. Yang, Y. Wang, N. Li, Talanta 47 (1998) 1099. 10.1016/S0039-9140(98)00189-1
25. C.A. Martínez-Huitle, C. Carlesi Jara, M. Cerro-Lopez, M.A. Quiroz, Canadian J. Anal. Sci. Spectrosc. 54 (2009) 53.
26. E. Desimoni, Analyst 124 (1999) 1191. 10.1039/a902251a
27. G. Gibbs, J.M. Tobin, E. Guibal, Ind. Eng. Chem. Res. 43 (2004) 1. 10.1021/ie030352p
28. W. Kamiñski, Z. Modrzejewska, Sep. Sci. Technol. 32 (1997) 2659. 10.1080/01496399708006962
29. R.-M. Wang, X. Xie, J.-Q. Wang, S.-J. Pan, Y.-P. Wang, C.-G. Xia, Polym. Adv. Technol. 15 (2004) 52. 10.1002/pat.450
30. C.L.P.S. Zanta, C.A. Martínez-Huitle, J. Chem. Sci. 119 (2007) 283. 10.1007/s12039-007-0037-1
31. C. Agra-Gutiérrez, J.L. Hardcastle, J.C. Ball, R.G. Compton, Analyst 124 (1999) 1053. 10.1039/a902974e
]]>Received 29 June 2009; accepted 14 December 2009
* Corresponding author: carlosmh@quimica.ufrn.br
]]>