<?xml version="1.0" encoding="ISO-8859-1"?><article xmlns:mml="http://www.w3.org/1998/Math/MathML" xmlns:xlink="http://www.w3.org/1999/xlink" xmlns:xsi="http://www.w3.org/2001/XMLSchema-instance">
<front>
<journal-meta>
<journal-id>1646-2408</journal-id>
<journal-title><![CDATA[Revista Encontros Científicos - Tourism & Management Studies]]></journal-title>
<abbrev-journal-title><![CDATA[Encontros Científicos]]></abbrev-journal-title>
<issn>1646-2408</issn>
<publisher>
<publisher-name><![CDATA[Escola Superior de Gestão, Hotelaria e Turismo]]></publisher-name>
</publisher>
</journal-meta>
<article-meta>
<article-id>S1646-24082010000100003</article-id>
<title-group>
<article-title xml:lang="en"><![CDATA[The causal relationship between tourism and economic growth in Malaysia: Evidence from multivariate causality tests]]></article-title>
<article-title xml:lang="pt"><![CDATA[A relação causal entre turismo e crescimento económico na Malásia: A evidência dos testes de causalidade multivariada]]></article-title>
</title-group>
<contrib-group>
<contrib contrib-type="author">
<name>
<surname><![CDATA[Kadir]]></surname>
<given-names><![CDATA[Norsiah]]></given-names>
</name>
<xref ref-type="aff" rid="A01"/>
</contrib>
<contrib contrib-type="author">
<name>
<surname><![CDATA[Nayan]]></surname>
<given-names><![CDATA[Sabri]]></given-names>
</name>
<xref ref-type="aff" rid="A01"/>
</contrib>
<contrib contrib-type="author">
<name>
<surname><![CDATA[Abdullah]]></surname>
<given-names><![CDATA[Mat Saad]]></given-names>
</name>
<xref ref-type="aff" rid="A01"/>
</contrib>
</contrib-group>
<aff id="A01">
<institution><![CDATA[,Universiti Teknologi MARA Malaysia Faculty of Business and Management Department of Economics]]></institution>
<addr-line><![CDATA[ ]]></addr-line>
</aff>
<pub-date pub-type="pub">
<day>00</day>
<month>00</month>
<year>2010</year>
</pub-date>
<pub-date pub-type="epub">
<day>00</day>
<month>00</month>
<year>2010</year>
</pub-date>
<numero>6</numero>
<fpage>16</fpage>
<lpage>24</lpage>
<copyright-statement/>
<copyright-year/>
<self-uri xlink:href="http://scielo.pt/scielo.php?script=sci_arttext&amp;pid=S1646-24082010000100003&amp;lng=en&amp;nrm=iso"></self-uri><self-uri xlink:href="http://scielo.pt/scielo.php?script=sci_abstract&amp;pid=S1646-24082010000100003&amp;lng=en&amp;nrm=iso"></self-uri><self-uri xlink:href="http://scielo.pt/scielo.php?script=sci_pdf&amp;pid=S1646-24082010000100003&amp;lng=en&amp;nrm=iso"></self-uri><abstract abstract-type="short" xml:lang="en"><p><![CDATA[Tourism industry and economic growth of a particular country are to some extent, interrelated. The aim of this study is to investigate the presence as well as direction of (significant) causal relationship between the Malaysian international tourism receipts and real growth in its national economy. Based on the sample period of 1994 through 2004, the data are examined from the perspective of multivariate causality procedure. Major finding of the study is twofold: First, international tourism receipts and real economic growth are found to be significantly cointegrated. Secondly, multivariate causality test based on the error correction model reveals that the Granger causality between international tourism receipts and real economic growth is unidirectional - running from real economic growth to international tourism receipts. The practical implication that could be conceived from this ‘growth-led tourism’ finding is that, as the Malaysian economy is growing, accelerated growth of socio-economic activities as well as business opportunities in its tourism-related sectors could be expected.]]></p></abstract>
<abstract abstract-type="short" xml:lang="pt"><p><![CDATA[A indústria turística e o crescimento económico de um país estão até certo ponto inter-relacionados. O objectivo deste estudo é investigar a presença assim como também a direcção da relação causal (significante) entre as receitas do turismo internacional na Malásia o crescimento real na sua economia. Com base numa amostra do período de 1994 a 2004, os dados são analisados na perspectiva do método da causalidade multivariada. São dois os principais resultados do estudo: em primeiro lugar, as receitas do turismo internacional e o crescimento económico real estão significativamente inter-relacionados. Em Segundo lugar, o teste de causalidade multivariada baseado no modelo de correcção do erro revela que a causalidade de Granger entre as receitas do turismo internacional e o crescimento económico real é unidireccional - movendo-se a partir do crescimento económico real em direcção às receitas do turismo internacional. A implicação prática que pode ser derivada destes resultados é que, dado que a economia da Malásia está crescendo, deve ser esperado um crescimento acelerado das actividades socioeconómicas, assim como oportunidades de negócio nos sectores relacionados com o turismo.]]></p></abstract>
<kwd-group>
<kwd lng="en"><![CDATA[Tourism]]></kwd>
<kwd lng="en"><![CDATA[economic growth]]></kwd>
<kwd lng="en"><![CDATA[multivariate causality tests]]></kwd>
<kwd lng="en"><![CDATA[Malaysia]]></kwd>
<kwd lng="pt"><![CDATA[Turismo]]></kwd>
<kwd lng="pt"><![CDATA[Crescimento Económico]]></kwd>
<kwd lng="pt"><![CDATA[Testes de Causalidade Multivariada]]></kwd>
<kwd lng="pt"><![CDATA[Malásia]]></kwd>
</kwd-group>
</article-meta>
</front><body><![CDATA[ <p><b>The causal relationship between tourism and economic growth in Malaysia:    Evidence from multivariate causality tests</b></p>     <p>&nbsp;</P>     <p><b>Norsiah Kadir<sup>1</sup>, Sabri Nayan<sup>2</sup> and Mat Saad Abdullah<sup>3</sup></b></P>     <p><sup>1</sup>Department of Economics, Faculty of Business and Management, Universiti    Teknologi MARA Malaysia. E-mail:&nbsp; <U><a href="mailto:norsiahkadir6699@yahoo.com">norsiahkadir6699@yahoo.com</a></U></P>     <p><sup>2</sup>Department of Economics, Faculty of Business and Management, Universiti    Teknologi MARA Malaysia. E-mail:&nbsp; <A  href="mailto:sabrinayan@perlis.uitm.edu.my">sabrinayan@perlis.uitm.edu.my</A></P>     <p><sup>3</sup>Department of Finance, Faculty of Business and Management, Universiti    Teknologi MARA Malaysia. E-mail:&nbsp; <A  href="mailto:matsaad@perlis.uitm.edu.my">matsaad@perlis.uitm.edu.my</A></P>     <p>&nbsp;</P>     <p>ABSTRACT</P>     <p>Tourism industry and economic growth of a particular country are to some extent,    interrelated.&nbsp; The aim of this study is to investigate the presence as    well as direction of (significant) causal relationship between the Malaysian    international tourism receipts and real growth in its national economy.&nbsp;    Based on the sample period of 1994 through 2004, the data are examined from    the perspective of multivariate causality procedure.&nbsp; Major finding of    the study is twofold: First, international tourism receipts and real economic    growth are found to be significantly cointegrated. Secondly, multivariate causality    test based on the error correction model reveals that the Granger causality    between international tourism receipts and real economic growth is unidirectional    - running from real economic growth to international tourism receipts. The practical    implication that could be conceived from this &#8216;growth-led tourism&#8217; finding is    that, as the Malaysian economy is growing, accelerated growth of socio-economic    activities as well as business opportunities in its tourism-related sectors    could be expected.</P>     <p><b>Keywords</b>: Tourism, economic growth, multivariate causality tests, Malaysia&nbsp;&nbsp;&nbsp;&nbsp;&nbsp;&nbsp;&nbsp;</P>     ]]></body>
<body><![CDATA[<p>&nbsp;</P>     <p><b>A relação causal entre turismo e crescimento económico na Malásia: A evidência    dos testes de causalidade multivariada</b>&nbsp;&nbsp;&nbsp;&nbsp;&nbsp;&nbsp;&nbsp;&nbsp;&nbsp;&nbsp;&nbsp;  </P>     <p>RESUMO</P>     <p>A indústria turística e o crescimento económico de um país estão até certo    ponto inter-relacionados.&nbsp;&nbsp; O objectivo deste estudo é investigar    a presença assim como também a direcção da relação causal (significante) entre    as receitas do turismo internacional na Malásia o crescimento real na sua economia.    Com base numa amostra do período de 1994 a 2004, os dados são analisados na    perspectiva do método da causalidade multivariada. São dois os principais resultados    do estudo: em primeiro lugar, as receitas do turismo internacional e o crescimento    económico real estão significativamente inter-relacionados. Em Segundo lugar,    o teste de causalidade multivariada baseado no modelo de correcção do erro revela    que a causalidade de Granger entre as receitas do turismo internacional e o    crescimento económico real é unidireccional &#8211; movendo-se a partir do crescimento    económico real em direcção às receitas do turismo internacional. A implicação    prática que pode ser derivada destes resultados é que, dado que a economia da    Malásia está crescendo, deve ser esperado um crescimento acelerado das actividades    socioeconómicas, assim como oportunidades de negócio nos sectores relacionados    com o turismo.</P>     <p><b>Palavras-Chave</b>: Turismo, Crescimento Económico, Testes de Causalidade    Multivariada, Malásia. </P>     <p>&nbsp; &nbsp;&nbsp;&nbsp;&nbsp;&nbsp;&nbsp;&nbsp;</P>     <p><b>1. INTRODUCTION</b></P>     <p>Tourism industry and economic development are to some extent, interrelated.    Furthermore, during the present era of globalization, information and communications    technology, it is reasonable to believe to be a global phenomenon that tourism    - as an industry or a socio-economic activity - has become increasingly important.    Appropriately, tourism continues to be a growing focus of economic development    policy in many regions and nations (Malecki, 1997).</P>     <p>Given the aforementioned scenario, the pertinent question is, has growth in    tourism industry in a particular country in recent years brought a significantly    positive impact on real growth of its national economy? Alternatively, would    real growth of an economy significantly cause an accelerated growth in its tourism    industry? Actually, the activity of tourism to support economic growth and to    make an increasingly significant contribution to the gross domestic product    (GDP) is still a subject of intense discussion (Sharpley &amp; Telfer, 2002).</P>     <p>The present paper attempts to investigate the presence as well as direction    of (significant) causal relationship between the growth in Malaysian international    tourism receipts and real growth in its national economy. The data are analyzed    from the multivariate causality perspective.</P>     ]]></body>
<body><![CDATA[<p>The remainder of this paper is structured as follows: The study begins in Section    2.0 by reviewing the literature related to tourism industry. Section 3.0 is    devoted to explaining the data as well as sketching the methodology to be employed.    Our empirical results are presented and discussed in Section 4.0. The paper    is then concluded in Section 5.0.</P>     <p>&nbsp;</P>     <p><b>2. REVIEW OF LITERATURE </b></P>     <p>Development theory and tourism have evolved along similar time lines since    the Second World War, yet there has been little work connecting the two fields    of study (Sharpley &amp;Telfer, 2002).&nbsp; </P>     <p>Notwithstanding that in recent years there has been a growing interest in analyzing    the relationship between tourism and economic growth [see among others, Balaguer    and Cantavella-Jordà (2002); Eugenio-Martin et al. (2003); Oh (2005) and Narayan    et al. (2007)], most of such studies involve analysing the data from the bivariate    perspective. Additionally, only a small number of them have arrived at evidence    of long run causality from tourism to economic growth (Dritsakis, 2004).</P>     <p>In 2002, Balaguer and Cantavella-Jordà (2002) initiated a study to examine    the <B>tourism-led growth hypothesis (TLGH)</B> &#8211; a hypothesis directly derived    from <B>export-led growth hypothesis (ELGH)</B>. Studying the role of tourism    in the long run economic development of Spain, Balaguer and Cantavella-Jordà    (2002) have detected that economic growth is sensitive to persistent expansion    in international tourism. More precisely, evidence of their study suggests that    international tourism in Spain has produced multiplier effects over time. </P>     <p>As in the ELGH, the TLGH postulates the existence of channel where tourism    would influence overall long-run economic growth.&nbsp; In a more traditional    sense, it should be argued that tourism brings in foreign exchange, which can    be used to import capital goods in order to produce goods and services leading    in turn to economic growth (Mckinnon, 1964). Diamond (1974) however, has a different    view, claiming that not only can tourism relieve the shortage of foreign exchange    constraining industrial expansion and alleviate the growing problem of urban    unemployment, but in the long run it will provide a price and income elastic    substitute for staple exports facing less favorable demand conditions. </P>     <p>Eugenio-Martin <I>et al.</I> (2004) in studying the relationship between tourism    and economic growth in Latin American countries by using a panel data approach    and the Arellano-Bond estimator for dynamic panels found that tourism sector    is necessary for the economic growth of medium or low-income countries. The    study also provides evidence suggesting that low-income countries need adequate    levels of infrastructures, education as well as development to attract tourists.    Medium-income countries on the contrary, need high levels of social development    like health services and high GDP per capita levels.&nbsp; </P>     <p>Another study investigating the causal relationship between tourism development    and economic growth is the one by Oh (2005).&nbsp; Using Engel and Granger two-stage    approach and the bivariate Vector Auto-regression (VAR) model to analyse the    Korean data, two principal results have emerged from the study.&nbsp; Firstly,    there is no long-run relationship between the two series.&nbsp; Secondly, the    causal relationship between economic growth and tourism development in Korea    is one way in nature; it runs from economic growth to tourism development. &nbsp;The    author then concluded that in Korea, the hypothesis of tourism led-economic    growth had to be rejected.</P>     <p>To study tourism as a factor in Greece&#8217;s long-run economic growth, Dritsakis    (2004) used multivariate causality analysis.&nbsp; The study has come up with    evidence of common trend or long-run relationships among international tourism    earnings, real exchange rate and economic growth.&nbsp; Interestingly, based    on causality analysis the study has detected that international tourism earnings    and real exchange rate cause economic growth with a &#8220;strong causal relationship&#8221;,    whereas economic growth and real exchange rate cause international tourism earnings    with a &#8220;simply causal relationship&#8221;.</P>     ]]></body>
<body><![CDATA[<p>In their study to test the relationship between tourism and economic growth    for the Pacific Island countries (i.e., the Fiji Islands, the Solomon Islands,    Papua New Guinea and Tonga) by using panel data analysis, Narayan <I>et al.</I>    (2007) found that tourism industry is a significant contributor to the gross    domestic product (GDP) in all of the four Pacific Island countries.&nbsp; Findings    of the study also justify the necessity of public intervention in providing    tourism infrastructure and facilities.&nbsp; </P>     <p>Regarding the Malaysian data, convincing evidence on causal relationship between    international tourism receipts and real growth in the national economy is still    lacking.&nbsp; Such a phenomenon could be explained by the fact that published    papers discussing the role of tourism in economic growth are, by and large,    based on descriptive studies [see e.g., Oppermann (1992); Khalifah &amp; Tahir    (1997); Musa (2000); and Teo (2003)].&nbsp; Besides, most of the relatively    few econometric studies on tourism, in Malaysia have focused on analyzing tourism    from the demand perspective [see<I> inter alios</I>, Tan <I>et al</I>. (2002);    Anaman &amp; Aminah Ismail (2002); Mohd Salleh <I>et al</I>. (2008)].</P>     <p>&nbsp;</P>     <p><b>3. &nbsp;DATA&nbsp; AND METHODOLOGY</b></P>     <p>This study is based on the <B>quarterly time-series data </B>consisting of    international tourism receipts, real GDP, real effective exchange rates and    consumer price indices from nine selected ASEAN and non-ASEAN countries; namely,    Thailand, Singapore, Indonesia, the Philippines, the U.S, the U.K, Germany,    Japan and Australia.&nbsp; Covering a sample period of 1994 through 2004, the    data are obtained from the Malaysian Tourism Promotion Board (Planning and Research    Division), <I>Key Performance Indicator of Tourism in Malaysia</I>; <I>Annual    report of Bank Negara Malaysia </I>(the Central Bank of Malaysia); <I>Economic    Report 2005-2006</I> and the <I>IMF International Financial Statistics Yearbook    </I>(various issues).</P>     <p>In analyzing the data, the following econometric tests are utilized:</P>     <p>i &nbsp;&nbsp;&nbsp;&nbsp;&nbsp;&nbsp;&nbsp;&nbsp;&nbsp; Unit root tests [Augmented    Dickey-Fuller (1979,1981) test as well as Phillips and Perron (1988) test];</P>     <p>ii&nbsp;&nbsp;&nbsp;&nbsp;&nbsp;&nbsp;&nbsp;&nbsp;&nbsp; Cointegration test    [Johansen (1988,1991) as well as&nbsp; Johansen and Juselius (1990) tests];    and </P>     <p>iii&nbsp;&nbsp;&nbsp;&nbsp;&nbsp;&nbsp;&nbsp;&nbsp;&nbsp; Granger causality    test [Engle and Granger (1987)]</P>     <p>&nbsp;</P>     ]]></body>
<body><![CDATA[<p><b>3.1.&nbsp; Unit Root Tests</b></P>     <p>Before testing for cointegration, the data need to be tested for stationarity,    to ensure that the mean and variance of the series are constant through time    and the autocovariance of the series is not time varying (Enders, 2004). Therefore,    the first step in unit root testing is to test for the order of integration    (<I>I</I>) of the variables. </P>     <p>Integration means that past shocks remaining undiluted affects the realisations    of the series forever and a series has theoretically infinite variance and a    time-dependent mean.&nbsp; For this purpose, tests proposed by Dickey and Fuller    (1979, 1981) (hereafter, ADF test) and Phillips and Perron (1988) (hereafter    PP test) are used. These tests will ensure the properties of unit root in all    variables. </P>     <p>If all of the series are non-stationary in the levels, it should be stationary    in first difference with the same level of lags. To determine the appropriate    lag lengths, the Akaike Information Criterion (AIC) and Schwartz Bayesian Criterion    (SBC) are used.</P>     <p><b>3.2. Cointegration Test</b></P>     <p>After identifying the order of intergration, the Johansen (1988, 1991), and    Johansen and Juselius (1990) Full Information Maximum Likelihood (ML) technique    (hereafter JJ) is used to detect the occurrence of long-run relationships (cointegration)    between the various series [MacKinnon &nbsp;(1991); Maddala (1988); Maddala    (2001); Maddala &amp; Kim (2002)]. The JJ cointegration procedure possesses    several advantages over the residual-based Engle-Granger two-stage approach    in testing for cointegration.&nbsp; Phillips (1991) underlined the desirability    of this technique in terms of symmetry, unbiasedness, and efficiency.&nbsp;    The procedure also does not suffer from problems associated with normalisation.    It is robust to departures from normality [Cheung &amp; Lai (1993); Gonzalo    (1994)] when conditional heteroskedasticity is present (Lee &amp; Tse, 1996).&nbsp;&nbsp;  </P>     <p>The JJ test utilises two likelihood ratio (LR) test statistics for the number    of cointegration vectors: The maximum eigenvalue [<i>T</i> ln(1 -<img src="/img/revistas/ec/n6/n6a03s1.jpg" width="21" height="29"><i><sub>i</sub></i>+1)]    and trace [-<i>T</i> <img src="/img/revistas/ec/n6/n6a03s2.jpg" width="25" height="43">ln (1-    <i><sub><img src="/img/revistas/ec/n6/n6a03s1.jpg" width="21" height="29">I</sub></i>)] statistics.&nbsp;    The maximum eigenvalue test (<i>&#955;</i>-max) is based on the comparison of    H<sub>0</sub> (<i>r</i>-1) against the alternative H<sub>1</sub> (<i>r</i>),    where <i>r</i> stands for number of cointegrating vectors. In general the null    hypothesis (H<sub>0</sub>: <i>r</i> = 0) is tested against an alternative (H<sub>1</sub>:    <i>r</i> = 1), against (H<sub>1</sub>: <i>r</i> = 2), and so on.&nbsp; In the    trace test, the null hypothesis (H<sub>0</sub>) is that there is at most r cointegrating    relationships (for example, <i>r</i> = 0, 1, 2, 3) is tested against a general    alternative.&nbsp; </p>      
<p>Critical values for both the maximum eigenvalue and trace tests are tabulated in Osterwald-Lenum (1992).&nbsp; If two variables are found to be cointegrated, there exists a long-run effect that prevents them from drifting away from each other and this will force the series to converge into long-run equilibrium.&nbsp; </p>      <p>The presence of a long-run relationship between variables, would mean that they are cointegrated.&nbsp; Given that it is possible to have multiple long-run equilibrium relationships between variables, the techniques developed by Johansen (1988, 1991), and Johansen and Juselius (1990) allow us to determine the number of statistically significant long-run relationships.&nbsp; </p>      <p>The Johansen approach to cointegration is based on Vector Autoregression (VAR).&nbsp; Consider the unrestricted VAR model represented by the following equation: </p>      ]]></body>
<body><![CDATA[<p><img src="/img/revistas/ec/n6/n6a03e1.jpg" width="433" height="61"></p>      
<p>where <i>&#949;t</i> &nbsp;is a i.i.d. P-dimensional Gaussian error with mean zero and variance matrix&nbsp; &#923;, <i>&#933;<sub>t</sub> </i>is an (nx1) vector of <i>I</i>(1) variables, and <i>&#945; </i>is an (nx1) vector of constants. Given that <i>Y<sub>t</sub></i> is assumed to be non-stationary, it can be specified that &#916;<i>Y </i>= <i>Y<sub>t</sub></i> &#8211; <i>Y<sub>t</sub></i><sub>-1</sub>.&nbsp; Equation (1) then, can be expressed in error correction form as follows,</p>      <p><img src="/img/revistas/ec/n6/n6a03e2.jpg" width="431" height="70"></p>      
<p>where <i>Y<sub>t</sub></i> is a column vector of m variables, &#1043; and &#928;    represent coefficient matrices, &#916; is the first difference operator, and    <i>P</i> represents the lag length.&nbsp; There exists no stationary linear    combination of variables if &#928; has zero rank.&nbsp; If, however, the rank    <i>r</i> of &#928; is greater than zero, then there will exist <i>r</i> possible    stationary linear combinations.&nbsp; Here, &#928; may be decomposed into two    matrices <i>&#945;</i> and <i>&#946;</i>, such that &#928; = <i>&#945;&#946;&#769;</i>.&nbsp;    The cointegration vector, <i>&#946;</i>, has the property that <i>&#946;&#769;Y</i>    is stationary even though <i>Y</i> is non-stationary.&nbsp; The cointegration    rank, <i>r</i>, can be formally tested using the maximum eigenvalue (<i>&#955;<sub>max</sub></i>)    test and the trace test (<i>&#955;<sub>tr</sub></i>).&nbsp; The asymptotic critical    values are provided in Johansen and Juselius (1990).</p>      <p><b>3.3.&nbsp; Granger Causality Test</b></p>      <p>The multivariate causality tests based on Vector Error Correction Model (VECM) is used to test for the presence of short run and long run relationship among the variables of our interest.&nbsp; These variables are the Malaysian international tourism receipts, real GDP, prices of tourism as well as the Malaysian real exchange rates, ranging from 1994 to 2004.&nbsp; </p>      <p>In investigating the occurrence of causal relationship between the Malaysian real economic growth and its tourism receipts, the nature of (causal) relationship between variables are tested based on the following pairs: </p>      <p>·&nbsp;&nbsp;&nbsp;&nbsp;&nbsp;&nbsp;&nbsp;&nbsp; International tourism receipts (<i>LREC</i>) and real economic growth (<i>LGDP</i>);</p>      <p>·&nbsp;&nbsp;&nbsp;&nbsp;&nbsp;&nbsp;&nbsp;&nbsp; Real effective exchange rate (<i>LER</i>) and international tourism receipts (<i>LREC</i>);</p>      <p>·&nbsp;&nbsp;&nbsp;&nbsp;&nbsp;&nbsp;&nbsp;&nbsp; Real economic growth (<i>LGDP</i>) and real effective exchange rate (<i>LER</i>);</p>      ]]></body>
<body><![CDATA[<p>·&nbsp;&nbsp;&nbsp;&nbsp;&nbsp;&nbsp;&nbsp;&nbsp; Tourism price (<i>LPm</i>) and international tourism receipts (<i>LREC</i>).</p>      <p>These multivariate causality tests involve estimating the following regression equations:
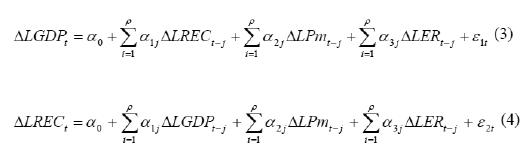
</p>      <p><img src="/img/revistas/ec/n6/n6a03e3-4.jpg" width="530" height="157"></p>      
<p>where <sub>&nbsp;&nbsp;</sub>&#916;<i>LGDP<sub>t</sub></i> and &#916;<i>LREC<sub>t</sub></i> are the differenced stationary and cointegrated variables; <i>t</i> stands for time; <i>&#949;</i><sub>1<i>t</i> </sub>and <i>&#949;</i><sub>2<i>t</i> </sub>are white noise error terms following the classical linear regression model assumptions; and <i>&#945;</i><sub>1</sub>, <i>&#945;</i><sub>2</sub> and <i>&#945;</i><sub>3</sub> are parameters of interest.<sub>&nbsp; </sub></p>      <p>The Granger-causality test is implemented by calculating the <i>F</i>-statistic (Wald test) based on the null hypothesis that the set of coefficients (<i>&#945;</i><sub>1</sub>, <i>&#945;</i><sub>2</sub> and <i>&#945;</i><sub>3</sub>) on the lagged values of independent variables are not statistically different from zero.&nbsp; If the null hypothesis is not rejected, then it can be concluded that the independent variables do not cause the dependent variable. </p>      <p>&nbsp;</p>      <p><b>4. &nbsp;EMPIRICAL RESULTS AND DISCUSSION</b></p>      <p>Since the data are analysed in three stages, findings of the study are also    discussed in three stages or sub-sections:</p>      <p><b>4.1.&nbsp; Results from Unit Root Tests</b></p>      <p>Tables 1 and 2 present the stationarity test results of international tourism receipts, real GDP, real exchange rate and prices of tourism in level as well as first differences (using ADF and PP tests). </p>      ]]></body>
<body><![CDATA[<p>&nbsp;</p>      <p><b>Table 1:&nbsp; Augmented Dickey Fuller (ADF) Test</b></p>  <table class=MsoNormalTable border=0 cellspacing=0 cellpadding=0  style='border-collapse:collapse;mso-padding-alt:0cm 0cm 0cm 0cm'>  <tr style='mso-yfti-irow:0;height:21.6pt'>   <td width=79 valign=top style='width:59.4pt;border:solid windowtext 1.0pt;   padding:0cm 5.4pt 0cm 5.4pt;height:21.6pt'>       <p>Variable</p>   </td>   <td width=264 colspan=3 valign=top style='width:198.0pt;border:solid windowtext 1.0pt;   border-left:none;padding:0cm 5.4pt 0cm 5.4pt;height:21.6pt'>       <p>Constant</p>   </td>   <td width=247 colspan=3 valign=top style='width:185.4pt;border:solid windowtext 1.0pt;   border-left:none;padding:0cm 5.4pt 0cm 5.4pt;height:21.6pt'>       <p>Trend</p>   </td>  </tr>  <tr style='mso-yfti-irow:1'>   <td width=79 valign=top style='width:59.4pt;border:solid windowtext 1.0pt;   border-top:none;padding:0cm 5.4pt 0cm 5.4pt'>       <p>&nbsp;</p>   </td>   <td width=89 valign=top style='width:67.0pt;border-top:none;border-left:none;   border-bottom:solid windowtext 1.0pt;border-right:solid windowtext 1.0pt;   padding:0cm 5.4pt 0cm 5.4pt'>       <p>Level</p>   </td>   <td width=84 valign=top style='width:63.25pt;border-top:none;border-left:   none;border-bottom:solid windowtext 1.0pt;border-right:solid windowtext 1.0pt;   padding:0cm 5.4pt 0cm 5.4pt'>       <p>First-Difference</p>   </td>   <td width=90 valign=top style='width:67.75pt;border-top:none;border-left:   none;border-bottom:solid windowtext 1.0pt;border-right:solid windowtext 1.0pt;   padding:0cm 5.4pt 0cm 5.4pt'>       <p>Conclusion</p>   </td>   <td width=78 valign=top style='width:58.8pt;border-top:none;border-left:none;   border-bottom:solid windowtext 1.0pt;border-right:solid windowtext 1.0pt;   padding:0cm 5.4pt 0cm 5.4pt'>       <p>Level</p>   </td>   <td width=84 valign=top style='width:63.2pt;border-top:none;border-left:none;   border-bottom:solid windowtext 1.0pt;border-right:solid windowtext 1.0pt;   padding:0cm 5.4pt 0cm 5.4pt'>       ]]></body>
<body><![CDATA[<p>First-Difference</p>   </td>   <td width=85 valign=top style='width:63.4pt;border-top:none;border-left:none;   border-bottom:solid windowtext 1.0pt;border-right:solid windowtext 1.0pt;   padding:0cm 5.4pt 0cm 5.4pt'>       <p>Conclusion</p>   </td>  </tr>  <tr style='mso-yfti-irow:2'>   <td width=79 valign=top style='width:59.4pt;border:solid windowtext 1.0pt;   border-top:none;padding:0cm 5.4pt 0cm 5.4pt'>       <p>lnREC</p>   </td>   <td width=89 valign=top style='width:67.0pt;border-top:none;border-left:none;   border-bottom:solid windowtext 1.0pt;border-right:solid windowtext 1.0pt;   padding:0cm 5.4pt 0cm 5.4pt'>       <p>-1.435</p>   </td>   <td width=84 valign=top style='width:63.25pt;border-top:none;border-left:   none;border-bottom:solid windowtext 1.0pt;border-right:solid windowtext 1.0pt;   padding:0cm 5.4pt 0cm 5.4pt'>       <p>-7.759**</p>   </td>   <td width=90 valign=top style='width:67.75pt;border-top:none;border-left:   none;border-bottom:solid windowtext 1.0pt;border-right:solid windowtext 1.0pt;   padding:0cm 5.4pt 0cm 5.4pt'>       <p><i>I</i>(1)</p>   </td>   <td width=78 valign=top style='width:58.8pt;border-top:none;border-left:none;   border-bottom:solid windowtext 1.0pt;border-right:solid windowtext 1.0pt;   padding:0cm 5.4pt 0cm 5.4pt'>       <p>-3.045</p>   </td>   <td width=84 valign=top style='width:63.2pt;border-top:none;border-left:none;   border-bottom:solid windowtext 1.0pt;border-right:solid windowtext 1.0pt;   padding:0cm 5.4pt 0cm 5.4pt'>       <p>-7.723**</p>   </td>   <td width=85 valign=top style='width:63.4pt;border-top:none;border-left:none;   border-bottom:solid windowtext 1.0pt;border-right:solid windowtext 1.0pt;   padding:0cm 5.4pt 0cm 5.4pt'>       <p><i>I</i>(1)</p>   </td>  </tr>  <tr style='mso-yfti-irow:3'>   <td width=79 valign=top style='width:59.4pt;border:solid windowtext 1.0pt;   border-top:none;padding:0cm 5.4pt 0cm 5.4pt'>       <p>lnGDP</p>   </td>   <td width=89 valign=top style='width:67.0pt;border-top:none;border-left:none;   border-bottom:solid windowtext 1.0pt;border-right:solid windowtext 1.0pt;   padding:0cm 5.4pt 0cm 5.4pt'>       ]]></body>
<body><![CDATA[<p>-1.124</p>   </td>   <td width=84 valign=top style='width:63.25pt;border-top:none;border-left:   none;border-bottom:solid windowtext 1.0pt;border-right:solid windowtext 1.0pt;   padding:0cm 5.4pt 0cm 5.4pt'>       <p>-7.588**</p>   </td>   <td width=90 valign=top style='width:67.75pt;border-top:none;border-left:   none;border-bottom:solid windowtext 1.0pt;border-right:solid windowtext 1.0pt;   padding:0cm 5.4pt 0cm 5.4pt'>       <p><i>I</i>(1)</p>   </td>   <td width=78 valign=top style='width:58.8pt;border-top:none;border-left:none;   border-bottom:solid windowtext 1.0pt;border-right:solid windowtext 1.0pt;   padding:0cm 5.4pt 0cm 5.4pt'>       <p>-3.024</p>   </td>   <td width=84 valign=top style='width:63.2pt;border-top:none;border-left:none;   border-bottom:solid windowtext 1.0pt;border-right:solid windowtext 1.0pt;   padding:0cm 5.4pt 0cm 5.4pt'>       <p>-7.508**</p>   </td>   <td width=85 valign=top style='width:63.4pt;border-top:none;border-left:none;   border-bottom:solid windowtext 1.0pt;border-right:solid windowtext 1.0pt;   padding:0cm 5.4pt 0cm 5.4pt'>       <p><i>I</i>(1)</p>   </td>  </tr>  <tr style='mso-yfti-irow:4'>   <td width=79 valign=top style='width:59.4pt;border:solid windowtext 1.0pt;   border-top:none;padding:0cm 5.4pt 0cm 5.4pt'>       <p>lnPr</p>   </td>   <td width=89 valign=top style='width:67.0pt;border-top:none;border-left:none;   border-bottom:solid windowtext 1.0pt;border-right:solid windowtext 1.0pt;   padding:0cm 5.4pt 0cm 5.4pt'>       <p>-0.372</p>   </td>   <td width=84 valign=top style='width:63.25pt;border-top:none;border-left:   none;border-bottom:solid windowtext 1.0pt;border-right:solid windowtext 1.0pt;   padding:0cm 5.4pt 0cm 5.4pt'>       <p>-6.415**</p>   </td>   <td width=90 valign=top style='width:67.75pt;border-top:none;border-left:   none;border-bottom:solid windowtext 1.0pt;border-right:solid windowtext 1.0pt;   padding:0cm 5.4pt 0cm 5.4pt'>       <p><i>I</i>(1)</p>   </td>   <td width=78 valign=top style='width:58.8pt;border-top:none;border-left:none;   border-bottom:solid windowtext 1.0pt;border-right:solid windowtext 1.0pt;   padding:0cm 5.4pt 0cm 5.4pt'>       ]]></body>
<body><![CDATA[<p>-1.508</p>   </td>   <td width=84 valign=top style='width:63.2pt;border-top:none;border-left:none;   border-bottom:solid windowtext 1.0pt;border-right:solid windowtext 1.0pt;   padding:0cm 5.4pt 0cm 5.4pt'>       <p>-6.539**</p>   </td>   <td width=85 valign=top style='width:63.4pt;border-top:none;border-left:none;   border-bottom:solid windowtext 1.0pt;border-right:solid windowtext 1.0pt;   padding:0cm 5.4pt 0cm 5.4pt'>       <p><i>I</i>(1)</p>   </td>  </tr>  <tr style='mso-yfti-irow:5;mso-yfti-lastrow:yes'>   <td width=79 valign=top style='width:59.4pt;border:solid windowtext 1.0pt;   border-top:none;padding:0cm 5.4pt 0cm 5.4pt'>       <p>lnER</p>   </td>   <td width=89 valign=top style='width:67.0pt;border-top:none;border-left:none;   border-bottom:solid windowtext 1.0pt;border-right:solid windowtext 1.0pt;   padding:0cm 5.4pt 0cm 5.4pt'>       <p>-1.751</p>   </td>   <td width=84 valign=top style='width:63.25pt;border-top:none;border-left:   none;border-bottom:solid windowtext 1.0pt;border-right:solid windowtext 1.0pt;   padding:0cm 5.4pt 0cm 5.4pt'>       <p>-5.287**</p>   </td>   <td width=90 valign=top style='width:67.75pt;border-top:none;border-left:   none;border-bottom:solid windowtext 1.0pt;border-right:solid windowtext 1.0pt;   padding:0cm 5.4pt 0cm 5.4pt'>       <p><i>I</i>(1)</p>   </td>   <td width=78 valign=top style='width:58.8pt;border-top:none;border-left:none;   border-bottom:solid windowtext 1.0pt;border-right:solid windowtext 1.0pt;   padding:0cm 5.4pt 0cm 5.4pt'>       <p>-1.666</p>   </td>   <td width=84 valign=top style='width:63.2pt;border-top:none;border-left:none;   border-bottom:solid windowtext 1.0pt;border-right:solid windowtext 1.0pt;   padding:0cm 5.4pt 0cm 5.4pt'>       <p>-5.242**</p>   </td>   <td width=85 valign=top style='width:63.4pt;border-top:none;border-left:none;   border-bottom:solid windowtext 1.0pt;border-right:solid windowtext 1.0pt;   padding:0cm 5.4pt 0cm 5.4pt'>       <p><i>I</i>(1)</p>   </td>  </tr> </table>      ]]></body>
<body><![CDATA[<p>Note:&nbsp; ** and * denote rejection of a unit root hypothesis based on Mackinnon critical values at 1% and 5% respectively</p>      <p>&nbsp;</p>      <p><b>Table 2:&nbsp; Phillip-Perron (PP) Test</b></p>  <table class=MsoNormalTable border=0 cellspacing=0 cellpadding=0 width=595  style='width:446.4pt;border-collapse:collapse;mso-padding-alt:0cm 0cm 0cm 0cm'>  <tr style='mso-yfti-irow:0;height:21.6pt'>   <td width=79 valign=top style='width:59.4pt;border:solid windowtext 1.0pt;   padding:0cm 5.4pt 0cm 5.4pt;height:21.6pt'>       <p>Variable&nbsp;&nbsp;&nbsp;&nbsp;&nbsp;&nbsp;&nbsp;&nbsp;&nbsp;&nbsp;&nbsp;&nbsp;&nbsp;&nbsp;&nbsp;&nbsp;&nbsp;&nbsp;&nbsp;&nbsp;&nbsp;&nbsp;&nbsp;&nbsp;&nbsp;&nbsp;&nbsp;&nbsp;&nbsp;&nbsp;&nbsp;&nbsp;&nbsp;&nbsp;&nbsp;&nbsp;&nbsp;&nbsp;&nbsp;&nbsp;&nbsp;&nbsp;&nbsp;   </p>   </td>   <td width=264 colspan=3 valign=top style='width:198.0pt;border:solid windowtext 1.0pt;   border-left:none;padding:0cm 5.4pt 0cm 5.4pt;height:21.6pt'>       <p>Constant</p>   </td>   <td width=252 colspan=3 valign=top style='width:189.0pt;border:solid windowtext 1.0pt;   border-left:none;padding:0cm 5.4pt 0cm 5.4pt;height:21.6pt'>       <p>Trend</p>   </td>  </tr>  <tr style='mso-yfti-irow:1'>   <td width=79 valign=top style='width:59.4pt;border:solid windowtext 1.0pt;   border-top:none;padding:0cm 5.4pt 0cm 5.4pt'>       <p>&nbsp;</p>   </td>   <td width=72 valign=top style='width:54.0pt;border-top:none;border-left:none;   border-bottom:solid windowtext 1.0pt;border-right:solid windowtext 1.0pt;   padding:0cm 5.4pt 0cm 5.4pt'>       <p>Level</p>   </td>   <td width=96 valign=top style='width:72.0pt;border-top:none;border-left:none;   border-bottom:solid windowtext 1.0pt;border-right:solid windowtext 1.0pt;   padding:0cm 5.4pt 0cm 5.4pt'>       <p>First-Difference</p>   </td>   <td width=96 valign=top style='width:72.0pt;border-top:none;border-left:none;   border-bottom:solid windowtext 1.0pt;border-right:solid windowtext 1.0pt;   padding:0cm 5.4pt 0cm 5.4pt'>       <p>Conclusion</p>   </td>   <td width=60 valign=top style='width:45.0pt;border-top:none;border-left:none;   border-bottom:solid windowtext 1.0pt;border-right:solid windowtext 1.0pt;   padding:0cm 5.4pt 0cm 5.4pt'>       ]]></body>
<body><![CDATA[<p>Level</p>   </td>   <td width=96 valign=top style='width:72.0pt;border-top:none;border-left:none;   border-bottom:solid windowtext 1.0pt;border-right:solid windowtext 1.0pt;   padding:0cm 5.4pt 0cm 5.4pt'>       <p>First-Difference</p>   </td>   <td width=96 valign=top style='width:72.0pt;border-top:none;border-left:none;   border-bottom:solid windowtext 1.0pt;border-right:solid windowtext 1.0pt;   padding:0cm 5.4pt 0cm 5.4pt'>       <p>Conclusion</p>   </td>  </tr>  <tr style='mso-yfti-irow:2'>   <td width=79 valign=top style='width:59.4pt;border:solid windowtext 1.0pt;   border-top:none;padding:0cm 5.4pt 0cm 5.4pt'>       <p>lnREC</p>   </td>   <td width=72 valign=top style='width:54.0pt;border-top:none;border-left:none;   border-bottom:solid windowtext 1.0pt;border-right:solid windowtext 1.0pt;   padding:0cm 5.4pt 0cm 5.4pt'>       <p>-1.256</p>   </td>   <td width=96 valign=top style='width:72.0pt;border-top:none;border-left:none;   border-bottom:solid windowtext 1.0pt;border-right:solid windowtext 1.0pt;   padding:0cm 5.4pt 0cm 5.4pt'>       <p>&nbsp;   -9.578**</p>   </td>   <td width=96 valign=top style='width:72.0pt;border-top:none;border-left:none;   border-bottom:solid windowtext 1.0pt;border-right:solid windowtext 1.0pt;   padding:0cm 5.4pt 0cm 5.4pt'>       <p><i>I</i>(1)</p>   </td>   <td width=60 valign=top style='width:45.0pt;border-top:none;border-left:none;   border-bottom:solid windowtext 1.0pt;border-right:solid windowtext 1.0pt;   padding:0cm 5.4pt 0cm 5.4pt'>       <p>-2.944</p>   </td>   <td width=96 valign=top style='width:72.0pt;border-top:none;border-left:none;   border-bottom:solid windowtext 1.0pt;border-right:solid windowtext 1.0pt;   padding:0cm 5.4pt 0cm 5.4pt'>       <p>-10.969**</p>   </td>   <td width=96 valign=top style='width:72.0pt;border-top:none;border-left:none;   border-bottom:solid windowtext 1.0pt;border-right:solid windowtext 1.0pt;   padding:0cm 5.4pt 0cm 5.4pt'>       <p><i>I</i>(1)</p>   </td>  </tr>  <tr style='mso-yfti-irow:3'>   <td width=79 valign=top style='width:59.4pt;border:solid windowtext 1.0pt;   border-top:none;padding:0cm 5.4pt 0cm 5.4pt'>       ]]></body>
<body><![CDATA[<p>lnGDP</p>   </td>   <td width=72 valign=top style='width:54.0pt;border-top:none;border-left:none;   border-bottom:solid windowtext 1.0pt;border-right:solid windowtext 1.0pt;   padding:0cm 5.4pt 0cm 5.4pt'>       <p>-0.832</p>   </td>   <td width=96 valign=top style='width:72.0pt;border-top:none;border-left:none;   border-bottom:solid windowtext 1.0pt;border-right:solid windowtext 1.0pt;   padding:0cm 5.4pt 0cm 5.4pt'>       <p>-10.671**</p>   </td>   <td width=96 valign=top style='width:72.0pt;border-top:none;border-left:none;   border-bottom:solid windowtext 1.0pt;border-right:solid windowtext 1.0pt;   padding:0cm 5.4pt 0cm 5.4pt'>       <p><i>I</i>(1)</p>   </td>   <td width=60 valign=top style='width:45.0pt;border-top:none;border-left:none;   border-bottom:solid windowtext 1.0pt;border-right:solid windowtext 1.0pt;   padding:0cm 5.4pt 0cm 5.4pt'>       <p>-3.001</p>   </td>   <td width=96 valign=top style='width:72.0pt;border-top:none;border-left:none;   border-bottom:solid windowtext 1.0pt;border-right:solid windowtext 1.0pt;   padding:0cm 5.4pt 0cm 5.4pt'>       <p>-11.066**</p>   </td>   <td width=96 valign=top style='width:72.0pt;border-top:none;border-left:none;   border-bottom:solid windowtext 1.0pt;border-right:solid windowtext 1.0pt;   padding:0cm 5.4pt 0cm 5.4pt'>       <p><i>I</i>(1)</p>   </td>  </tr>  <tr style='mso-yfti-irow:4'>   <td width=79 valign=top style='width:59.4pt;border:solid windowtext 1.0pt;   border-top:none;padding:0cm 5.4pt 0cm 5.4pt'>       <p>lnPr</p>   </td>   <td width=72 valign=top style='width:54.0pt;border-top:none;border-left:none;   border-bottom:solid windowtext 1.0pt;border-right:solid windowtext 1.0pt;   padding:0cm 5.4pt 0cm 5.4pt'>       <p>-0.449</p>   </td>   <td width=96 valign=top style='width:72.0pt;border-top:none;border-left:none;   border-bottom:solid windowtext 1.0pt;border-right:solid windowtext 1.0pt;   padding:0cm 5.4pt 0cm 5.4pt'>       <p>&nbsp;   -6.415**</p>   </td>   <td width=96 valign=top style='width:72.0pt;border-top:none;border-left:none;   border-bottom:solid windowtext 1.0pt;border-right:solid windowtext 1.0pt;   padding:0cm 5.4pt 0cm 5.4pt'>       ]]></body>
<body><![CDATA[<p><i>I</i>(1)</p>   </td>   <td width=60 valign=top style='width:45.0pt;border-top:none;border-left:none;   border-bottom:solid windowtext 1.0pt;border-right:solid windowtext 1.0pt;   padding:0cm 5.4pt 0cm 5.4pt'>       <p>-1.508</p>   </td>   <td width=96 valign=top style='width:72.0pt;border-top:none;border-left:none;   border-bottom:solid windowtext 1.0pt;border-right:solid windowtext 1.0pt;   padding:0cm 5.4pt 0cm 5.4pt'>       <p>&nbsp;   -6.539**</p>   </td>   <td width=96 valign=top style='width:72.0pt;border-top:none;border-left:none;   border-bottom:solid windowtext 1.0pt;border-right:solid windowtext 1.0pt;   padding:0cm 5.4pt 0cm 5.4pt'>       <p><i>I</i>(1)</p>   </td>  </tr>  <tr style='mso-yfti-irow:5;mso-yfti-lastrow:yes'>   <td width=79 valign=top style='width:59.4pt;border:solid windowtext 1.0pt;   border-top:none;padding:0cm 5.4pt 0cm 5.4pt'>       <p>lnER</p>   </td>   <td width=72 valign=top style='width:54.0pt;border-top:none;border-left:none;   border-bottom:solid windowtext 1.0pt;border-right:solid windowtext 1.0pt;   padding:0cm 5.4pt 0cm 5.4pt'>       <p>-1.869</p>   </td>   <td width=96 valign=top style='width:72.0pt;border-top:none;border-left:none;   border-bottom:solid windowtext 1.0pt;border-right:solid windowtext 1.0pt;   padding:0cm 5.4pt 0cm 5.4pt'>       <p>&nbsp;   -5.259**</p>   </td>   <td width=96 valign=top style='width:72.0pt;border-top:none;border-left:none;   border-bottom:solid windowtext 1.0pt;border-right:solid windowtext 1.0pt;   padding:0cm 5.4pt 0cm 5.4pt'>       <p><i>I</i>(1)</p>   </td>   <td width=60 valign=top style='width:45.0pt;border-top:none;border-left:none;   border-bottom:solid windowtext 1.0pt;border-right:solid windowtext 1.0pt;   padding:0cm 5.4pt 0cm 5.4pt'>       <p>-1.804</p>   </td>   <td width=96 valign=top style='width:72.0pt;border-top:none;border-left:none;   border-bottom:solid windowtext 1.0pt;border-right:solid windowtext 1.0pt;   padding:0cm 5.4pt 0cm 5.4pt'>       <p>&nbsp;   -5.211**</p>   </td>   <td width=96 valign=top style='width:72.0pt;border-top:none;border-left:none;   border-bottom:solid windowtext 1.0pt;border-right:solid windowtext 1.0pt;   padding:0cm 5.4pt 0cm 5.4pt'>       ]]></body>
<body><![CDATA[<p><i>I</i>(1)</p>   </td>  </tr> </table>      <p><i>Note</i>:&nbsp; ** and * denote rejection of a unit root hypothesis based on Mackinnon critical values at 1% and 5%, respectively.</p>      <p>&nbsp;</p>      <p>The results of unit root tests (in level) indicate that the null hypothesis of the unit root cannot be rejected at 1 per cent and 5 per cent critical values.&nbsp; However, the null hypothesis is rejected at 1 per cent and 5 per cent critical values when the test is based on the first-difference.&nbsp; This suggests that the data are stationary (or integrated) at first-difference but not in level.</p>      <p><b>4.2.&nbsp; Results from Cointegration Test</b></p>     <p>After confirming that all series are integrated of the same order, we proceed    with the multivariate cointegration test [Johansen (1988, 1991), and Johansen    and Juselius (1990)] to determine the presence of common trend or long-run relationship    among the series; namely, international tourism receipts, real GDP, prices of    tourism and real exchange rate. The results of the multivariate cointegration    test, as summarized in Table 3, reveal that the series are cointegrated. Simply    put, our results suggest the presence of common trend or long-run relationships    among the series.</p>     <p>&nbsp;</p>      <p><b>Table 3:&nbsp; Multivariate Cointegration Tests Based on the Johansen and    Juselius (JJ) Approach </b></p>  <table class=MsoNormalTable border=0 cellspacing=0 cellpadding=0  style='border-collapse:collapse;mso-padding-alt:0cm 0cm 0cm 0cm'>  <tr style='mso-yfti-irow:0'>   <td width=84 valign=top style='width:63.25pt;border:solid windowtext 1.0pt;   padding:0cm 5.4pt 0cm 5.4pt'>       <p>H<sub>o</sub></p>   </td>   <td width=84 valign=top style='width:63.25pt;border:solid windowtext 1.0pt;   border-left:none;padding:0cm 5.4pt 0cm 5.4pt'>       <p>Trace   test</p>       ]]></body>
<body><![CDATA[<p>&nbsp;</p>   </td>   <td width=84 valign=top style='width:63.25pt;border:solid windowtext 1.0pt;   border-left:none;padding:0cm 5.4pt 0cm 5.4pt'>       <p>5% CV</p>   </td>   <td width=84 valign=top style='width:63.25pt;border:solid windowtext 1.0pt;   border-left:none;padding:0cm 5.4pt 0cm 5.4pt'>       <p>1% CV</p>   </td>   <td width=84 valign=top style='width:63.25pt;border:solid windowtext 1.0pt;   border-left:none;padding:0cm 5.4pt 0cm 5.4pt'>       <p>Max-Eigen   test</p>   </td>   <td width=84 valign=top style='width:63.25pt;border:solid windowtext 1.0pt;   border-left:none;padding:0cm 5.4pt 0cm 5.4pt'>       <p>5% CV</p>   </td>   <td width=84 valign=top style='width:63.3pt;border:solid windowtext 1.0pt;   border-left:none;padding:0cm 5.4pt 0cm 5.4pt'>       <p>1% CV</p>   </td>  </tr>  <tr style='mso-yfti-irow:1'>   <td width=84 valign=top style='width:63.25pt;border:solid windowtext 1.0pt;   border-top:none;padding:0cm 5.4pt 0cm 5.4pt'>       <p>H<sub>0</sub>:&nbsp;   r&nbsp; = 0</p>   </td>   <td width=84 valign=top style='width:63.25pt;border-top:none;border-left:   none;border-bottom:solid windowtext 1.0pt;border-right:solid windowtext 1.0pt;   padding:0cm 5.4pt 0cm 5.4pt'>       <p>52.350**</p>   </td>   <td width=84 valign=top style='width:63.25pt;border-top:none;border-left:   none;border-bottom:solid windowtext 1.0pt;border-right:solid windowtext 1.0pt;   padding:0cm 5.4pt 0cm 5.4pt'>       <p>39.890</p>   </td>   <td width=84 valign=top style='width:63.25pt;border-top:none;border-left:   none;border-bottom:solid windowtext 1.0pt;border-right:solid windowtext 1.0pt;   padding:0cm 5.4pt 0cm 5.4pt'>       <p>45.580</p>   </td>   <td width=84 valign=top style='width:63.25pt;border-top:none;border-left:   none;border-bottom:solid windowtext 1.0pt;border-right:solid windowtext 1.0pt;   padding:0cm 5.4pt 0cm 5.4pt'>       ]]></body>
<body><![CDATA[<p>33.950**</p>   </td>   <td width=84 valign=top style='width:63.25pt;border-top:none;border-left:   none;border-bottom:solid windowtext 1.0pt;border-right:solid windowtext 1.0pt;   padding:0cm 5.4pt 0cm 5.4pt'>       <p>23.800</p>   </td>   <td width=84 valign=top style='width:63.3pt;border-top:none;border-left:none;   border-bottom:solid windowtext 1.0pt;border-right:solid windowtext 1.0pt;   padding:0cm 5.4pt 0cm 5.4pt'>       <p>28.820</p>   </td>  </tr>  <tr style='mso-yfti-irow:2'>   <td width=84 valign=top style='width:63.25pt;border:solid windowtext 1.0pt;   border-top:none;padding:0cm 5.4pt 0cm 5.4pt'>       <p>H<sub>0</sub>:&nbsp;   r&nbsp; &#8804; 1</p>   </td>   <td width=84 valign=top style='width:63.25pt;border-top:none;border-left:   none;border-bottom:solid windowtext 1.0pt;border-right:solid windowtext 1.0pt;   padding:0cm 5.4pt 0cm 5.4pt'>       <p>18.390</p>   </td>   <td width=84 valign=top style='width:63.25pt;border-top:none;border-left:   none;border-bottom:solid windowtext 1.0pt;border-right:solid windowtext 1.0pt;   padding:0cm 5.4pt 0cm 5.4pt'>       <p>24.310</p>   </td>   <td width=84 valign=top style='width:63.25pt;border-top:none;border-left:   none;border-bottom:solid windowtext 1.0pt;border-right:solid windowtext 1.0pt;   padding:0cm 5.4pt 0cm 5.4pt'>       <p>29.750</p>   </td>   <td width=84 valign=top style='width:63.25pt;border-top:none;border-left:   none;border-bottom:solid windowtext 1.0pt;border-right:solid windowtext 1.0pt;   padding:0cm 5.4pt 0cm 5.4pt'>       <p>9.980</p>   </td>   <td width=84 valign=top style='width:63.25pt;border-top:none;border-left:   none;border-bottom:solid windowtext 1.0pt;border-right:solid windowtext 1.0pt;   padding:0cm 5.4pt 0cm 5.4pt'>       <p>17.890</p>   </td>   <td width=84 valign=top style='width:63.3pt;border-top:none;border-left:none;   border-bottom:solid windowtext 1.0pt;border-right:solid windowtext 1.0pt;   padding:0cm 5.4pt 0cm 5.4pt'>       <p>22.990</p>   </td>  </tr>  <tr style='mso-yfti-irow:3'>   <td width=84 valign=top style='width:63.25pt;border:solid windowtext 1.0pt;   border-top:none;padding:0cm 5.4pt 0cm 5.4pt'>       ]]></body>
<body><![CDATA[<p>H<sub>0</sub>:&nbsp;   r&nbsp; &#8804; 2</p>   </td>   <td width=84 valign=top style='width:63.25pt;border-top:none;border-left:   none;border-bottom:solid windowtext 1.0pt;border-right:solid windowtext 1.0pt;   padding:0cm 5.4pt 0cm 5.4pt'>       <p>8.410</p>   </td>   <td width=84 valign=top style='width:63.25pt;border-top:none;border-left:   none;border-bottom:solid windowtext 1.0pt;border-right:solid windowtext 1.0pt;   padding:0cm 5.4pt 0cm 5.4pt'>       <p>12.530</p>   </td>   <td width=84 valign=top style='width:63.25pt;border-top:none;border-left:   none;border-bottom:solid windowtext 1.0pt;border-right:solid windowtext 1.0pt;   padding:0cm 5.4pt 0cm 5.4pt'>       <p>16.310</p>   </td>   <td width=84 valign=top style='width:63.25pt;border-top:none;border-left:   none;border-bottom:solid windowtext 1.0pt;border-right:solid windowtext 1.0pt;   padding:0cm 5.4pt 0cm 5.4pt'>       <p>7.380</p>   </td>   <td width=84 valign=top style='width:63.25pt;border-top:none;border-left:   none;border-bottom:solid windowtext 1.0pt;border-right:solid windowtext 1.0pt;   padding:0cm 5.4pt 0cm 5.4pt'>       <p>11.440</p>   </td>   <td width=84 valign=top style='width:63.3pt;border-top:none;border-left:none;   border-bottom:solid windowtext 1.0pt;border-right:solid windowtext 1.0pt;   padding:0cm 5.4pt 0cm 5.4pt'>       <p>15.690</p>   </td>  </tr>  <tr style='mso-yfti-irow:4;mso-yfti-lastrow:yes'>   <td width=84 valign=top style='width:63.25pt;border:solid windowtext 1.0pt;   border-top:none;padding:0cm 5.4pt 0cm 5.4pt'>       <p>H<sub>0</sub>:&nbsp;   r&nbsp; &#8804; 3</p>   </td>   <td width=84 valign=top style='width:63.25pt;border-top:none;border-left:   none;border-bottom:solid windowtext 1.0pt;border-right:solid windowtext 1.0pt;   padding:0cm 5.4pt 0cm 5.4pt'>       <p>1.030</p>   </td>   <td width=84 valign=top style='width:63.25pt;border-top:none;border-left:   none;border-bottom:solid windowtext 1.0pt;border-right:solid windowtext 1.0pt;   padding:0cm 5.4pt 0cm 5.4pt'>       <p>3.840</p>   </td>   <td width=84 valign=top style='width:63.25pt;border-top:none;border-left:   none;border-bottom:solid windowtext 1.0pt;border-right:solid windowtext 1.0pt;   padding:0cm 5.4pt 0cm 5.4pt'>       ]]></body>
<body><![CDATA[<p>&nbsp;6.510</p>   </td>   <td width=84 valign=top style='width:63.25pt;border-top:none;border-left:   none;border-bottom:solid windowtext 1.0pt;border-right:solid windowtext 1.0pt;   padding:0cm 5.4pt 0cm 5.4pt'>       <p>1.030</p>   </td>   <td width=84 valign=top style='width:63.25pt;border-top:none;border-left:   none;border-bottom:solid windowtext 1.0pt;border-right:solid windowtext 1.0pt;   padding:0cm 5.4pt 0cm 5.4pt'>       <p>3.840</p>   </td>   <td width=84 valign=top style='width:63.3pt;border-top:none;border-left:none;   border-bottom:solid windowtext 1.0pt;border-right:solid windowtext 1.0pt;   padding:0cm 5.4pt 0cm 5.4pt'>       <p>6.510</p>   </td>  </tr> </table>      <p><i>Notes: </i></p>      <p> 1.&nbsp;&nbsp; r stands for number of cointegrating vectors</p>      <p> 2.&nbsp;&nbsp; Column 1 lists the null hypothesis of zero, at least one, two, three cointegrating vector; column 2 lists the trace&nbsp;&nbsp; statistics; column 3 and 4 list the critical values for trace statistics at 5% and 1% significant levels; column 5 lists the maximum Eigenvalue statistics; column 6 and 7 list the critical value for maximum Eigenvalue statistics at 5% and 1% significant levels.</p>      <p> 3.&nbsp;&nbsp; ** and * indicate statistical significance at 1% and 5% levels, respectively.</p>      <p>&nbsp;</p>      <p><b>4.3. Results from Multivariate Causality Test</b></p>     ]]></body>
<body><![CDATA[<p>Given the results provided by the Johansen multivariate cointegration test    that the series are cointegrated, the study then proceeds with the multivariate    error-correction model.&nbsp; The results of the multivariate causality test    (based on the error-correction model) as reported in Table 4 indicate that the    coefficient, <i>&#948;</i>, is statistically significant only in the case when    international tourism receipts (REC) is used as an endogenous variable.&nbsp;    This refers to channel two, which means in the long-run, real GDP, relative    price of tourism and exchange rate Granger cause international tourism receipts.&nbsp;    However, the coefficients of lagged variables are significant only in the case    where international tourism receipts and real GDP are used as dependent variable    (channel 1).&nbsp; This implies that in the short-run relative price of tourism    Granger causes international tourism receipts and real GDP.</p>     <p>&nbsp;</p>      <p><b>Table 4:&nbsp; Multivariate Causality Test Results Based on Error-Correction    Model</b></p>  <table class=MsoNormalTable border=0 cellspacing=0 cellpadding=0  style='border-collapse:collapse;mso-padding-alt:0cm 0cm 0cm 0cm'>  <tr style='mso-yfti-irow:0'>   <td width=88 valign=top style='width:66.15pt;border:solid windowtext 1.0pt;   padding:0cm 5.4pt 0cm 5.4pt'>       <p>Dependent   variable</p>   </td>   <td width=335 colspan=4 valign=top style='width:251.45pt;border:solid windowtext 1.0pt;   border-left:none;padding:0cm 5.4pt 0cm 5.4pt'>       <p>F-Statistics</p>   </td>   <td width=167 colspan=2 valign=top style='width:125.2pt;border:solid windowtext 1.0pt;   border-left:none;padding:0cm 5.4pt 0cm 5.4pt'>       <p>ECT[&#949;<sub>i,t-1</sub>]</p>   </td>  </tr>  <tr style='mso-yfti-irow:1'>   <td width=88 valign=top style='width:66.15pt;border:solid windowtext 1.0pt;   border-top:none;padding:0cm 5.4pt 0cm 5.4pt'>       <p>&nbsp;</p>   </td>   <td width=84 valign=top style='width:63.0pt;border-top:none;border-left:none;   border-bottom:solid windowtext 1.0pt;border-right:solid windowtext 1.0pt;   padding:0cm 5.4pt 0cm 5.4pt'>       <p>&#916;lnREC</p>   </td>   <td width=84 valign=top style='width:63.0pt;border-top:none;border-left:none;   border-bottom:solid windowtext 1.0pt;border-right:solid windowtext 1.0pt;   padding:0cm 5.4pt 0cm 5.4pt'>       <p>&#916;lnGDP</p>   </td>   <td width=84 valign=top style='width:62.65pt;border-top:none;border-left:   none;border-bottom:solid windowtext 1.0pt;border-right:solid windowtext 1.0pt;   padding:0cm 5.4pt 0cm 5.4pt'>       <p>&#916;lnPr</p>   </td>   <td width=84 valign=top style='width:62.8pt;border-top:none;border-left:none;   border-bottom:solid windowtext 1.0pt;border-right:solid windowtext 1.0pt;   padding:0cm 5.4pt 0cm 5.4pt'>       ]]></body>
<body><![CDATA[<p>&#916;lnER</p>   </td>   <td width=83 valign=top style='width:62.1pt;border-top:none;border-left:none;   border-bottom:solid windowtext 1.0pt;border-right:solid windowtext 1.0pt;   padding:0cm 5.4pt 0cm 5.4pt'>       <p>C</p>   </td>   <td width=84 valign=top style='width:63.1pt;border-top:none;border-left:none;   border-bottom:solid windowtext 1.0pt;border-right:solid windowtext 1.0pt;   padding:0cm 5.4pt 0cm 5.4pt'>       <p>t-statistics</p>   </td>  </tr>  <tr style='mso-yfti-irow:2'>   <td width=88 valign=top style='width:66.15pt;border:solid windowtext 1.0pt;   border-top:none;padding:0cm 5.4pt 0cm 5.4pt'>       <p>&#916;lnREC</p>   </td>   <td width=84 valign=top style='width:63.0pt;border-top:none;border-left:none;   border-bottom:solid windowtext 1.0pt;border-right:solid windowtext 1.0pt;   padding:0cm 5.4pt 0cm 5.4pt'>       <p>-</p>   </td>   <td width=84 valign=top style='width:63.0pt;border-top:none;border-left:none;   border-bottom:solid windowtext 1.0pt;border-right:solid windowtext 1.0pt;   padding:0cm 5.4pt 0cm 5.4pt'>       <p>0.064</p>   </td>   <td width=84 valign=top style='width:62.65pt;border-top:none;border-left:   none;border-bottom:solid windowtext 1.0pt;border-right:solid windowtext 1.0pt;   padding:0cm 5.4pt 0cm 5.4pt'>       <p>1.179**</p>   </td>   <td width=84 valign=top style='width:62.8pt;border-top:none;border-left:none;   border-bottom:solid windowtext 1.0pt;border-right:solid windowtext 1.0pt;   padding:0cm 5.4pt 0cm 5.4pt'>       <p>0.298</p>   </td>   <td width=83 valign=top style='width:62.1pt;border-top:none;border-left:none;   border-bottom:solid windowtext 1.0pt;border-right:solid windowtext 1.0pt;   padding:0cm 5.4pt 0cm 5.4pt'>       <p>-0.888</p>   </td>   <td width=84 valign=top style='width:63.1pt;border-top:none;border-left:none;   border-bottom:solid windowtext 1.0pt;border-right:solid windowtext 1.0pt;   padding:0cm 5.4pt 0cm 5.4pt'>       <p>-2.074*</p>   </td>  </tr>  <tr style='mso-yfti-irow:3'>   <td width=88 valign=top style='width:66.15pt;border:solid windowtext 1.0pt;   border-top:none;padding:0cm 5.4pt 0cm 5.4pt'>       ]]></body>
<body><![CDATA[<p>&#916;lnGDP</p>   </td>   <td width=84 valign=top style='width:63.0pt;border-top:none;border-left:none;   border-bottom:solid windowtext 1.0pt;border-right:solid windowtext 1.0pt;   padding:0cm 5.4pt 0cm 5.4pt'>       <p>0.189</p>   </td>   <td width=84 valign=top style='width:63.0pt;border-top:none;border-left:none;   border-bottom:solid windowtext 1.0pt;border-right:solid windowtext 1.0pt;   padding:0cm 5.4pt 0cm 5.4pt'>       <p>-</p>   </td>   <td width=84 valign=top style='width:62.65pt;border-top:none;border-left:   none;border-bottom:solid windowtext 1.0pt;border-right:solid windowtext 1.0pt;   padding:0cm 5.4pt 0cm 5.4pt'>       <p>1.209**</p>   </td>   <td width=84 valign=top style='width:62.8pt;border-top:none;border-left:none;   border-bottom:solid windowtext 1.0pt;border-right:solid windowtext 1.0pt;   padding:0cm 5.4pt 0cm 5.4pt'>       <p>0.274</p>   </td>   <td width=83 valign=top style='width:62.1pt;border-top:none;border-left:none;   border-bottom:solid windowtext 1.0pt;border-right:solid windowtext 1.0pt;   padding:0cm 5.4pt 0cm 5.4pt'>       <p>-0.761</p>   </td>   <td width=84 valign=top style='width:63.1pt;border-top:none;border-left:none;   border-bottom:solid windowtext 1.0pt;border-right:solid windowtext 1.0pt;   padding:0cm 5.4pt 0cm 5.4pt'>       <p>-1.744</p>   </td>  </tr>  <tr style='mso-yfti-irow:4'>   <td width=88 valign=top style='width:66.15pt;border:solid windowtext 1.0pt;   border-top:none;padding:0cm 5.4pt 0cm 5.4pt'>       <p>&#916;lnPm</p>   </td>   <td width=84 valign=top style='width:63.0pt;border-top:none;border-left:none;   border-bottom:solid windowtext 1.0pt;border-right:solid windowtext 1.0pt;   padding:0cm 5.4pt 0cm 5.4pt'>       <p>0.188</p>   </td>   <td width=84 valign=top style='width:63.0pt;border-top:none;border-left:none;   border-bottom:solid windowtext 1.0pt;border-right:solid windowtext 1.0pt;   padding:0cm 5.4pt 0cm 5.4pt'>       <p>0.152</p>   </td>   <td width=84 valign=top style='width:62.65pt;border-top:none;border-left:   none;border-bottom:solid windowtext 1.0pt;border-right:solid windowtext 1.0pt;   padding:0cm 5.4pt 0cm 5.4pt'>       ]]></body>
<body><![CDATA[<p>-</p>   </td>   <td width=84 valign=top style='width:62.8pt;border-top:none;border-left:none;   border-bottom:solid windowtext 1.0pt;border-right:solid windowtext 1.0pt;   padding:0cm 5.4pt 0cm 5.4pt'>       <p>0.257</p>   </td>   <td width=83 valign=top style='width:62.1pt;border-top:none;border-left:none;   border-bottom:solid windowtext 1.0pt;border-right:solid windowtext 1.0pt;   padding:0cm 5.4pt 0cm 5.4pt'>       <p>-0.046</p>   </td>   <td width=84 valign=top style='width:63.1pt;border-top:none;border-left:none;   border-bottom:solid windowtext 1.0pt;border-right:solid windowtext 1.0pt;   padding:0cm 5.4pt 0cm 5.4pt'>       <p>-0.258</p>   </td>  </tr>  <tr style='mso-yfti-irow:5;mso-yfti-lastrow:yes'>   <td width=88 valign=top style='width:66.15pt;border:solid windowtext 1.0pt;   border-top:none;padding:0cm 5.4pt 0cm 5.4pt'>       <p>&#916;lnER</p>   </td>   <td width=84 valign=top style='width:63.0pt;border-top:none;border-left:none;   border-bottom:solid windowtext 1.0pt;border-right:solid windowtext 1.0pt;   padding:0cm 5.4pt 0cm 5.4pt'>       <p>0.2041</p>   </td>   <td width=84 valign=top style='width:63.0pt;border-top:none;border-left:none;   border-bottom:solid windowtext 1.0pt;border-right:solid windowtext 1.0pt;   padding:0cm 5.4pt 0cm 5.4pt'>       <p>0.217</p>   </td>   <td width=84 valign=top style='width:62.65pt;border-top:none;border-left:   none;border-bottom:solid windowtext 1.0pt;border-right:solid windowtext 1.0pt;   padding:0cm 5.4pt 0cm 5.4pt'>       <p>0.172</p>   </td>   <td width=84 valign=top style='width:62.8pt;border-top:none;border-left:none;   border-bottom:solid windowtext 1.0pt;border-right:solid windowtext 1.0pt;   padding:0cm 5.4pt 0cm 5.4pt'>       <p>-</p>   </td>   <td width=83 valign=top style='width:62.1pt;border-top:none;border-left:none;   border-bottom:solid windowtext 1.0pt;border-right:solid windowtext 1.0pt;   padding:0cm 5.4pt 0cm 5.4pt'>       <p>-0.182</p>   </td>   <td width=84 valign=top style='width:63.1pt;border-top:none;border-left:none;   border-bottom:solid windowtext 1.0pt;border-right:solid windowtext 1.0pt;   padding:0cm 5.4pt 0cm 5.4pt'>       ]]></body>
<body><![CDATA[<p>-1.834</p>   </td>  </tr> </table>      <p><i>Notes:</i>&nbsp; i&nbsp; C stands for coefficient</p>      <p>&nbsp;&nbsp;&nbsp;&nbsp;&nbsp;&nbsp;&nbsp;&nbsp;&nbsp;&nbsp;&nbsp; ii. ** and * indicate statistical significance at 1% and 5% levels, respectively.</p>      <p>&nbsp;</p>      <p>Lastly, it is noteworthy that seasonal patterns in international tourist arrivals    in a particular country are a common phenomenon. Correspondingly, in tourism    literature seasonal variations in tourism demand is a well-documented phenomenon.    However, in the present paper, since we are more interested in the relationship    between tourism and economic growth, this seasonality issue is only examined    briefly. The results of our analysis of seasonality patterns of tourism demand    in Malaysia are displayed in <a name="topf1"></a><a href="#f1">Figures A1</a>    and <a name="topf2"></a><a href="#f2">A2</a> (see <a name="topfa"></a><a href="#fa">Appendix</a>).    As shown in <a href="#f2">Figure A2</a>, our international tourism receipts    declined seriously in 1997 and 2002 due to Asian Financial Crisis and the Severe    Acute Respiratory Syndrome (SARS), respectively. On the other hand, the sharp    increase in tourism receipts in 2003 could be attributed to the success of the    Malaysian Government &#8216;Malaysia Truly Asia&#8217; promotional campaign.&nbsp;&nbsp;&nbsp;  </p>      <p>&nbsp;</p>      <p><b>5. CONCLUSION</b></p>      <p>In examining the presence as well as direction of causality between international tourism receipts and real economic growth in Malaysia, cointegration tests based on Johansen (1988,1991) and Johansen and Juselius (1990) are utilised.&nbsp; Findings of the study indicate that there is a long run relationship between tourism and economic growth in Malaysia.&nbsp; </p>      <p>Further, results from the multivariate causality test reveal that the relationship between real economic growth and international tourism receipts is unidirectional:&nbsp; It runs from real economic growth to international tourism receipts.</p>      <p>In closing, whereas the relationship between tourism industry and economic growth might be bidirectional, our result indicates that, for Malaysia, it is growth in the national economy that has been significantly leading growth in its tourism industry.&nbsp; Such a finding might imply that a growth in the Malaysian economy would be followed by improvements in the quality (as well as quantity) of its tourism products, facilities and services.&nbsp; Besides, the practical implication that could be conjectured from this &#8216;growth-led tourism&#8217; finding is that as the Malaysian economy is growing, accelerated growth in socio-economic activities as well as business opportunities in the tourism related sectors could be expected. However, our evidence of seasonality suggests that in planning and implementing activities, services and even promotional campaign pertaining to tourism industry in Malaysia, the fact that the arrival of international tourists are seasonal in nature need to be taken into consideration. </p>      ]]></body>
<body><![CDATA[<p>&nbsp;</p>      <p><b>REFERENCES</b></p>      <p>Anaman, K.A., and Aminah Ismail (2002): &#8220;Cross-border Tourism from Brunei Darussalam to Eastern Malaysia: An Empirical Analysis&#8221;, <i>Singapore Economic Review</i>, 47, 65-87.</p>      <p>Balaguer, J. and Cantavella-Jordà, M. (2002): &#8220;Tourism as a long-run economic growth factor: the Spanish case&#8221;, <i>Applied Economics</i>, 34, 877-884.</p>      <p>Bank Negara Malaysia, <i>Annual Report 2004</i>, Kuala Lumpur, Bank Negara Malaysia.</p>      <p>Cheung, Y.W. &amp; Lai, K.S. (1993): &#8220;Finite Sample Sizes of Johansen&#8217;s Likelihood Ratio Test for Cointegration&#8221;, <i>Oxford Bulletin of Economics and Statistics</i>, 55, 313-332.</p>      <p>Dickey, D.A. &amp; Fuller, W.A. (1979): &#8220;Distribution of Estimators for Autoregressive Time Series with a Unit Root&#8221;, <i>Journal of the American Statistical Association</i>, 74, 427-431.</p>      <p>Diamond, J. (1974): &#8220;International tourism and the Developing countries:&nbsp; A case study in failure&#8221;, <i>Economica Internazionale</i>, 27(3-4), 601-615.</p>      <p>Dritsakis, N. (2004): &#8220;Tourism as a long-run economic growth factor: an empirical investigation for Greece using causality analysis&#8221;, <i>Tourism Economics</i>, 10(3), 305-316.</p>      <!-- ref --><p>Engle, R.F. and Granger, C.W.J. (1987): &#8220;Cointegration and Error Correction:&nbsp; Representation, Estimation and Testing&#8221;, <i>Econometrica</i>, 55, 251-276.&nbsp;&nbsp;&nbsp;&nbsp;&nbsp;&nbsp;&nbsp;&nbsp;[&#160;<a href="javascript:void(0);" onclick="javascript: window.open('/scielo.php?script=sci_nlinks&ref=000262&pid=S1646-2408201000010000300001&lng=','','width=640,height=500,resizable=yes,scrollbars=1,menubar=yes,');">Links</a>&#160;]<!-- end-ref --><p>Enders, W. (2004). <i>Applied Econometric Time Series </i>(2nd ed.), New Jersey: John Wiley &amp; Sons, Inc.</p>      <p>Eugenio-Martin, J.L., Morales, N.M., &amp; Scarpa, R. (2003): <i>Tourism and    economic growth in Latin American countries: a panel data approach</i>, paper    presented at the International Conference on Tourism and Sustainable Economic    Development - Macro and Micro Economic Issues, Sardinia, Italy. Retrieved January    22, 2007, from <a href="http://www.pigliaru.it/chia/scarpa.pdf" target="_blank">http://www.pigliaru.it/chia/scarpa.pdf</a>  </p>      <p>Gonzalo, J. (1994): <i>Cointegration and Aggregation</i>, Boston University, Boston.</p>      <p>Johansen, S. (1988): &#8220;Statistical Analysis of Cointegration Vectors&#8221;, <i>Journal of Economic Dynamics</i> and Control, 12, 231-254.</p>      <p>Johansen, S. (1991): &#8220;Estimation and Hypothesis Testing of Cointegration Vectors in Gaussian Vector Autoregressive Models&#8221;, <i>Econometrica</i>, 59, 1551-1580.</p>      <p>Johansen, S. &amp; Juselius, K. (1990): &#8220;Maximum likelihood estimation and inference on cointegration-with applications to the demand for money&#8221;, <i>Oxford Bulletin of Economics and Statistics</i>, 52, 169-210.</p>      <p>Khalifah, Z., and Tahir, S. (1997): &#8220;Malaysia: Tourism in Perspective&#8221;, in Go, F., and Jenkins, C.L., eds, <i>Tourism and Economic Development in Asia and Australia</i>,&nbsp; Cassel, London, 176-196.</p>      <p>Lee, T.H. &amp; Tse, Y. (1996): &#8220;Cointegration Tests with Conditional heteroskedasticity&#8221;, <i>Journal of Econometrics</i>, 73, 401-410.</p>      <p>Malecki, E. (1997): <i>Technology and Economic Development</i> (2th ed.), Longman, Harlow.</p>      <p>MacKinnon, J.G. (1991): &#8220;Critical value for cointegration test&#8221;, in R. F. Engle &amp; C. W. J. Granger (Eds.), <i>Long-run economic relationships:&nbsp; Reading in cointegration</i>., Oxford: Oxford University Press.</p>      ]]></body>
<body><![CDATA[<p>Maddala, G.S. (1988): <i>Introduction to Econometrics</i>, Macmillan Publishing Company, New York.</p>      <p>Maddala, G.S. (2001): <i>Introduction to Econometrics </i>(3rded.), John Wiley and Sons, Ltd., New York.</p>      <p>Maddala, G.S. &amp; Kim, I.M. (2002): <i>Unit Roots, Cointegration, and Structural Change</i>, United Kingdom, Cambridge University Press.</p>      <p>Mckinnon, R. (1964): &#8220;Foreign Exchange Constrain in Economic Development and Efficient Aid Allocation&#8221;, <i>Economic Journal</i>, 74, 388-409.</p>      <p>Ministry of Finance: <i>Economic Report 2005/2006</i>, Putrajaya, Ministry of Finance Malaysia.</p>      <p>Mohd Salleh, N.H., Law, S.H., Shuib, A., Mohd Noor, Z., and Ramachandran, S. (2008): Asian To, <i>Contemporary Management Research</i>, 4, 351-368.</p>      <p>Musa, G. (2000): &#8220;Tourism in Malaysia&#8221;, in Hall, C.M., and Page, S., eds, <i>Tourism in South and Southeast Asia: &nbsp;Issues and Cases</i>, Butterworth-Heinemann, Oxford,&nbsp; 144-156. </p>      <p>Narayan, P.K., Narayan, S., Prasad, B.C., and Prasad, A. (2007): Tourism and economic growth:&nbsp; a panel data analysis for Pacific Island Countries, working paper.</p>      <p>Oh, C. (2005): &#8220;The Contribution of Tourism Development to Economic Growth in Korean Economy&#8221;, <i>Tourism Management</i>, 26, 39-44.</p>      <p>Oppermann, M. (1992): &#8220;International Tourism and Regional Development in Malaysia&#8221;, <i>Tijdschrift Voor Economische En Sociale</i>, 83, 226-233.</p>      ]]></body>
<body><![CDATA[<p>Osterwald-Lenum, M. (1992): &#8220;A note with Quantiles of the Asymptotic Distribution of the Maximum Likelihood Cointegration Rank Test Statistics&#8221;, <i>Oxford Bulletin of Economics and Statistics</i>, 54, 461-471.</p>      <p>Phillips, P.C.B. (1991): &#8220;Optimal inference in cointegrated systems&#8221;, <i>Econometrica</i>, 59,&nbsp; 283-306.</p>      <p>Phillips, P.C.B. &amp; Perron, P. (1988): &#8220;Testing for a Unit Root in Time Series Regression&#8221;, <i>Biometrika</i>, 75, 335-346.</p>      <p>Sharpley, R. and Telfer, D.J. (2002): <i>Tourism and Development:&nbsp; Concepts and Issues</i>, Channel View Publications, Clevedon, England.&nbsp; </p>      <p>Tan, A.Y.E., McMahon, C., and Miller, J. (2002):&nbsp; &#8220;Modelling Tourists Flows to Indonesia and Malaysia&#8221;, <i>Journal of Travel and Tourism Marketing</i>, 13, 63-84.</p>      <p>Teo, P. (2003): &#8220;The Limits of Imagineering:&nbsp; A case study of Penang&#8221;, <i>International Journal of&nbsp; Urban and Regional Research</i>,&nbsp; 27, 545-563.</p>      <p>Tourism Malaysia: <i>Key Performance Indicators of Tourism in Malaysia</i> (various issues), Kuala Lumpur.</p>      <p>&nbsp;</p>     <p>Submitted: 28.10.2009</p>     <p>Accepted:30.06.2010</p>     ]]></body>
<body><![CDATA[<p>&nbsp;</p>          <p><b><a name="fa"></a><a href="#topfa">APPENDIX</a></b></p>     <p>&nbsp;</p>     <p><b><a name="f1"></a><a href="#topf1">Figure A1</a>.&nbsp; International Tourism    Receipts (means by Season)
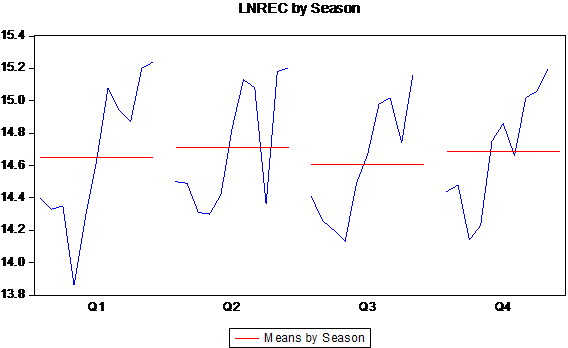
</b></p>      <p><img src="/img/revistas/ec/n6/n6a03fa1.gif" width="565" height="345"></p>       
<p>&nbsp;</p>      <p><b> <a name="f2"></a><a href="#topf2">Figure A2</a>.&nbsp; International Tourism    Receipts (by Season)</b></p>      <p><img src="/img/revistas/ec/n6/n6a03fa2.gif" width="583" height="315"></p>      
<p>&nbsp;</p>      <p><b>
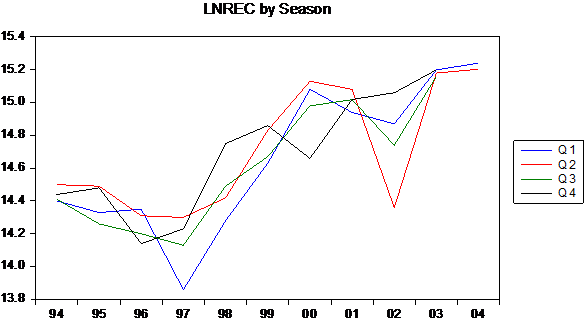
Table 1. Diagnostic Tests</b></p>  <table class=MsoNormalTable border=0 cellspacing=0 cellpadding=0  style='border-collapse:collapse;mso-padding-alt:0cm 0cm 0cm 0cm'>   <tr style='mso-yfti-irow:0'>   <td width=111 valign=top style='width:83.4pt;border:solid windowtext 1.0pt;   background:#CCCCCC;padding:0cm 5.4pt 0cm 5.4pt'>       ]]></body>
<body><![CDATA[<p class=texttablecenter9><b>Type of Test</b></p>   </td>   <td width=359 valign=top style='width:269.3pt;border:solid windowtext 1.0pt;   border-left:none;background:#CCCCCC;padding:0cm 5.4pt 0cm 5.4pt'>       <p class=texttablecenter9><b>Purpose</b></p>   </td>   <td width=85 valign=top style='width:63.8pt;border:solid windowtext 1.0pt;   border-left:none;background:#CCCCCC;padding:0cm 5.4pt 0cm 5.4pt'>       <p class=texttablecenter9><b>Result</b></p>   </td>  </tr>  <tr style='mso-yfti-irow:1'>   <td width=111 valign=top style='width:83.4pt;border:solid windowtext 1.0pt;   border-top:none;padding:0cm 5.4pt 0cm 5.4pt'>       <p class=texttablecenter9>R2</p>   </td>   <td width=359 valign=top style='width:269.3pt;border-top:none;border-left:   none;border-bottom:solid windowtext 1.0pt;border-right:solid windowtext 1.0pt;   padding:0cm 5.4pt 0cm 5.4pt'>       <p class=texttablecenter9 align=left style='text-align:left'>&nbsp;</p>   </td>   <td width=85 valign=top style='width:63.8pt;border-top:none;border-left:none;   border-bottom:solid windowtext 1.0pt;border-right:solid windowtext 1.0pt;   padding:0cm 5.4pt 0cm 5.4pt'>       <p class=texttablecenter9>0.8447</p>   </td>  </tr>  <tr style='mso-yfti-irow:2'>   <td width=111 valign=top style='width:83.4pt;border:solid windowtext 1.0pt;   border-top:none;padding:0cm 5.4pt 0cm 5.4pt'>       <p class=texttablecenter9>Adjusted   R2</p>   </td>   <td width=359 valign=top style='width:269.3pt;border-top:none;border-left:   none;border-bottom:solid windowtext 1.0pt;border-right:solid windowtext 1.0pt;   padding:0cm 5.4pt 0cm 5.4pt'>       <p class=texttablecenter9>A   goodness-of-fit measure in multiple regression analysis&nbsp; that penalizes   additional explanatory variables</p>   </td>   <td width=85 valign=top style='width:63.8pt;border-top:none;border-left:none;   border-bottom:solid windowtext 1.0pt;border-right:solid windowtext 1.0pt;   padding:0cm 5.4pt 0cm 5.4pt'>       <p class=texttablecenter9>0.8181</p>   </td>  </tr>  <tr style='mso-yfti-irow:3'>   <td width=111 valign=top style='width:83.4pt;border:solid windowtext 1.0pt;   border-top:none;padding:0cm 5.4pt 0cm 5.4pt'>       <p class=texttablecenter9>Durbin-Watson</p>   </td>   <td width=359 valign=top style='width:269.3pt;border-top:none;border-left:   none;border-bottom:solid windowtext 1.0pt;border-right:solid windowtext 1.0pt;   padding:0cm 5.4pt 0cm 5.4pt'>       ]]></body>
<body><![CDATA[<p class=texttablecenter9>Test   for autocorrelation</p>   </td>   <td width=85 valign=top style='width:63.8pt;border-top:none;border-left:none;   border-bottom:solid windowtext 1.0pt;border-right:solid windowtext 1.0pt;   padding:0cm 5.4pt 0cm 5.4pt'>       <p class=texttablecenter9>2.3950</p>   </td>  </tr>  <tr style='mso-yfti-irow:4'>   <td width=111 valign=top style='width:83.4pt;border:solid windowtext 1.0pt;   border-top:none;padding:0cm 5.4pt 0cm 5.4pt'>       <p class=texttablecenter9>Breusch-Pagan</p>   </td>   <td width=359 valign=top style='width:269.3pt;border-top:none;border-left:   none;border-bottom:solid windowtext 1.0pt;border-right:solid windowtext 1.0pt;   padding:0cm 5.4pt 0cm 5.4pt'>       <p class=texttablecenter9>Test   for heterocedasticity (BP &#955;)</p>   </td>   <td width=85 valign=top style='width:63.8pt;border-top:none;border-left:none;   border-bottom:solid windowtext 1.0pt;border-right:solid windowtext 1.0pt;   padding:0cm 5.4pt 0cm 5.4pt'>       <p class=texttablecenter9>10.1938</p>   </td>  </tr>  <tr style='mso-yfti-irow:5;mso-yfti-lastrow:yes'>   <td width=111 valign=top style='width:83.4pt;border:solid windowtext 1.0pt;   border-top:none;padding:0cm 5.4pt 0cm 5.4pt'>       <p class=texttablecenter9>Jarque-Bera</p>   </td>   <td width=359 valign=top style='width:269.3pt;border-top:none;border-left:   none;border-bottom:solid windowtext 1.0pt;border-right:solid windowtext 1.0pt;   padding:0cm 5.4pt 0cm 5.4pt'>       <p class=texttablecenter9>Test   for Normality</p>   </td>   <td width=85 valign=top style='width:63.8pt;border-top:none;border-left:none;   border-bottom:solid windowtext 1.0pt;border-right:solid windowtext 1.0pt;   padding:0cm 5.4pt 0cm 5.4pt'>       <p class=texttablecenter9>4.0294(0.1333)</p></td></tr></table>       ]]></body><back>
<ref-list>
<ref id="B1">
<nlm-citation citation-type="journal">
<person-group person-group-type="author">
<name>
<surname><![CDATA[Engle]]></surname>
<given-names><![CDATA[R.F.]]></given-names>
</name>
<name>
<surname><![CDATA[Granger]]></surname>
<given-names><![CDATA[C.W.J.]]></given-names>
</name>
</person-group>
<article-title xml:lang="en"><![CDATA[Cointegration and Error Correction: Representation, Estimation and Testing]]></article-title>
<source><![CDATA[Econometrica]]></source>
<year>1987</year>
<volume>55</volume>
<page-range>251-276</page-range></nlm-citation>
</ref>
</ref-list>
</back>
</article>
