


Serviços Personalizados
Journal

Artigo
 Inglês (pdf)
 Artigo em XML
 Referências do artigo
 Enviar este artigo por email
Indicadores
 Citado por SciELO
 Links relacionados
 Similares em
SciELO
Similares em
SciELO Compartilhar

 Permalink
Portugaliae Electrochimica Acta
versão impressa ISSN 0872-1904
Port. Electrochim. Acta vol.32 no.4 Coimbra jul. 2014
https://doi.org/10.4152/pea.201404295
Electroreduction of Salicylic Acid, Acetylsalicylic Acid and Pharmaceutical Products Containing these Compounds
Edyta Wudarska , Ewa Chrzescijanska* and Elzbieta Kusmierek
Institute of General and Ecological Chemistry, Department of Chemistry, Technical University of Lodz, Poland
Abstract
Electroreduction properties of salicylic (SA) and acetylsalicylic (ASA) acids were investigated at platinum electrode using the voltammetry method. Cyclic voltammograms (CV) of the tested compounds were used in determining half-wave potential (E1/2) -the parameter describing the anti-reductive properties. The content of active substances (SA and ASA) in the selected pharmaceuticals (salicylic alcohol, Bayer aspirin, etopirin and polopirin) was examined with the application of electrochemical and spectrophotometric methods.
Keywords: Cyclic voltammograms; Electroreduction; Salicylic acid; Acetylsalicylic acid; Pharmaceutical products.
Introduction
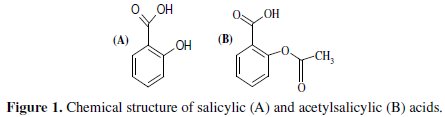
Salicylates constitute a group of organic compounds, commonly used in the prevention and curing of many diseases. Salicylic intoxication causes symptoms that can be mild up to very severe and even result in a sudden death [1, 2]. Salicylic acid (o-hydroxybenzoic acid, SA, Fig. 1A) belongs to this group of compounds.
It is used in the pharmaceutical industry in production of drug and cosmetic preparations (ointments, creams and gels) for skin care [3]. SA used in these preparations regulates a skin cell renewal and shows exfoliation activity by loosening of intercellular connections resulting in removal of cornfield epidermal cell layer. Due to its structure and medicinal properties, SA belongs to the group nonsteroidal anti-inflammatory drugs (NSAIDs) [4].
Since SA had been the first time synthesized, researches for new anti- inflammatory drugs but with higher therapeutic activity have been carried out.
Many NSAIDs belonging to various chemical groups, with different anti- inflammatory, analgesic and antipyretic activity, were developed [5]. Active substances in NSAIDs include also acetylsalicylic acid (o-acetoxybenzoic acid, aspirin, ASA, Fig. 1B) applied in curing pain and fever decrease [6, 7].
Like other drugs, salicylic acid and acetylsalicylic acid also cause some side effects. The use of SA and ASA can lead to gastrointestinal complications that may pose a direct threat to life (bleeding, stenosis, perforation), especially for children and elderly patients [8]. Thus, it is necessary to develop methods of their determination in human body fluids.
Last years, applications of electrochemical methods in determination and studies of drugs attract a lot of attention because of their accuracy and simplicity [9-17]. Electrochemical measurements enable determination of various physicochemical parameters of tested compounds, e.g. redox potential, half-wave potential, reduction currents, which can be used in calculation of kinetic parameters of electrode reactions like number of exchanged electrons, transfer coefficients, rate constants of electrode reactions. These parameters are important in estimation of anti-reductive properties of drugs as well as in understanding of their reduction mechanisms [18-23].
The aim of the investigations described in this paper was determining SA and ASA electrochemical behaviour in the process of their electroreduction at platinum electrode. According to our best knowledge, electroreduction of ASA is poorly described in literature in contrary to its electrooxidation. Determination of active substances concentrations in selected pharmaceuticals was carried out using the cyclic voltammetry method and UV-VIS spectrophotometry. The tested pharmaceuticals were as follows: salicylic alcohol, Bayer aspirin, etopirin and polopirin.
Experimental
Reagents
The pure salicylic (SA) and acetylsalicylic (ASA) acids were purchased in Sigma-Aldrich (Germany) and used as received. Pharmaceutical products (salicylic alcohol, Bayer aspirin, etopirin and polopirin) containing tested compounds were purchased in pharmacies in Lodz. The concentration of SA and ASA solutions varied in the range from 0.2 × 10⁻³ to 5 × 10⁻³ mol L-1. The aqueous solutions of tested compounds were prepared by their dissolution in the supporting electrolyte (0.1 mol L-1 NaClO4, Fluka, France).
Measurement methods
Voltammetric analysis
Electroanalytical measurements of SA, ASA and the pharmaceuticals were carried out in an Autolab PGSTA30 Electrochemical Analyzer (Eco Chemie, Netherlands). A three-electrode electrochemical cell employed in measurements consisted of a reference electrode, an auxiliary electrode (platinum wire) and a working electrode -platinum with geometric surface area of 0.5 cm2. A potential of the working electrode was measured vs. saturated calomel electrode (SCE). Measurements were carried out using a method of cyclic voltammetry (CV). CV curves were recorded in the potential from 0 to 1.25 with various scan rates (0.01 to 0.1 V s-1). The volume of the solutions used in the measurements was 20 mL. Prior to the measurements, the solution was purged with argon in order to remove dissolved oxygen. During measurements, argon blanket was kept over solutions. All experiments were carried out at room temperature.
Spectrophotometric analysis
UV-VIS spectra of the tested compounds were recorded in the wavelength range from 180 to 800 nm using a UV-VIS spectrophotometer (Shimadzu UV-24001 PC).
Results and discussion
Electrochemical reduction of SA, ASA
Electrochemical reduction of salicylic (SA) and acetylsalicylic (ASA) acid was studied at a Pt electrode using the cyclic voltammetry (CV) method.
Fig. 2 (curve 1) shows the voltammogram of SA electroreduction proving that the test compound is reduced in at least one step (Ep = -0.49 V) at potentials lower than the potential at which hydrogen evolution starts.
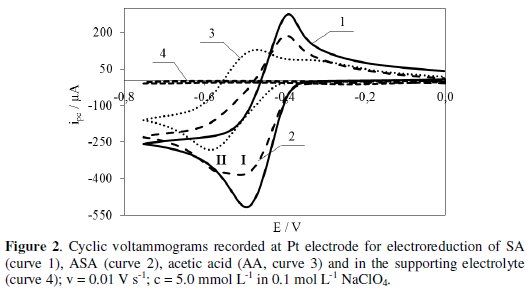
In the reverse scan, a peak observed at -0.39 V is ascribed to oxidation of SA reduced form. Whereas, the voltammogram of ASA electroreduction presented in Fig. 2 (curve 2) proves that this process proceeds in at least two steps at potentials lower than the potential at which hydrogen evolution starts. Peak potential (Epc) of the first and second step in the electroreduction is -0.50 V and -0.57 V, respectively. In the reverse scan, a peak observed at -0.41 V is ascribed to oxidation of ASA reduced form. ASA electroreduction is preceded by its hydrolysis resulting in the formation of salicylic (SA) and acetic (AA) acid. The potential of the first peak of ASA electroreduction (Fig. 2, curve 2) corresponds to the potential of SA electroreduction peak (Fig. 2, curve 1). On the other hand, the potential of the second peak of ASA electroreduction (Fig. 2, curve 2) corresponds to the potential of AA electroreduction (Fig. 2, curve 3). Probably, the electroreduction of SA is followed by AA electroreduction. The electroreduction of SA, ASA and AA is quasi-reversible. Within the potential range, where reduction peaks of the tested compounds appear, the supporting electrolyte (0.1 mol L-1 NaClO4) shows no peaks (Fig. 2, curve 4) [22].
The voltammograms were also used in determination of half-wave potentials (E1/2) of SA, ASA and AA reduction. This parameter provides information on the electroreductive properties of the compounds. The lower value of E1/2 proves that the tested compound is less susceptible to reduction. SA (E1/2 = -0.455 V) is reduced easier than ASA (E1/2 = -0.465 V), while AA (E1/2 = -0.706 V) is reduced the most difficult.
Determination of the tested substances in pharmaceutical products
Determination of active substances concentrations in the selected pharmaceuticals was carried out using the cyclic voltammetry method (Fig. 3).
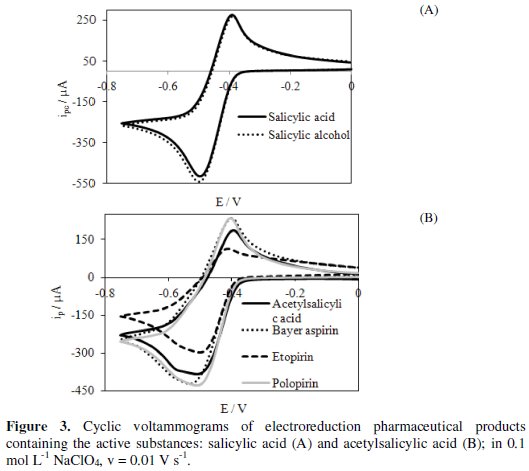
The tested pharmaceuticals were as follows: salicylic alcohol, Bayer aspirin, etopirin and polopirin.
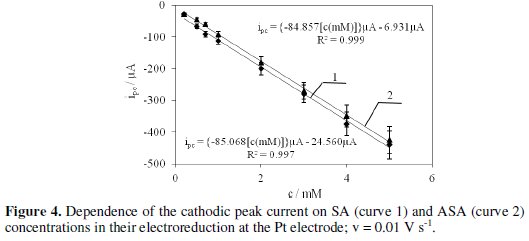
Active substances contained in the pharmaceuticals are reduced quasi-reversibly in a potential range lower than the potential at which hydrogen evolution starts. Half-wave potentials (E1/2) determined from the voltammograms for different pharmaceuticals are as follows: salicylic alcohol (-0.469 V), Bayer aspirin ( 0.490 V), etopirin (-0.469 V) and polopirin (-0.467 V). This indicates that polopirin is reduced the easiest and Bayer aspirin is reduced the most difficult. Based on the cathodic peak current (ipc) and dependence of ipc on ASA and SA concentrations (Fig. 4) determined with cyclic voltammetry, we have calculated the concentration of the tested substrates in pharmaceutical products.
The concentrations of the active substances in the pharmaceuticals determined electrochemically and the contents provided by the manufacturers are presented in Table 1.
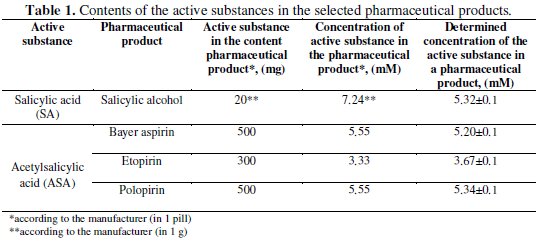
The concentrations determined by the electrochemical method are slightly different from those calculated on the base of the contents provided by manufacturers. Differences in the concentrations can be attributed to the presence of excipients in this pharmaceutical. Due to the fact that the dependences of the peak currents on the concentration of all tested compounds are linear, the cyclic voltammetry can be successfully applied in the determination of active substances concentrations in commonly used pharmaceuticals.
UV-Vis spectrophotometry of the active substances and pharmaceutical products
Salicylic (SA) and acetylsalicylic (ASA) acids were determined in the pharmaceutical products using a spectrophotometric method (Fig. 5).
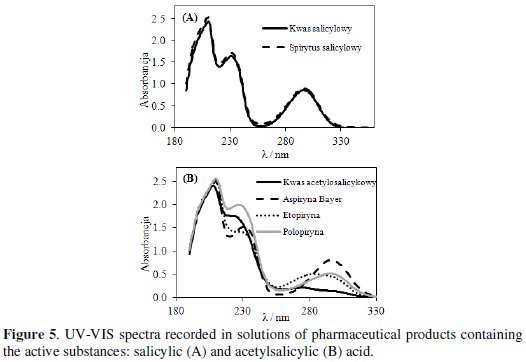
Spectrophotometric spectra were recorded in the wavelength range from 180 to 800 nm. UV-VIS spectra recorded separately in solutions of active substances and pharmaceuticals showed three absorption bands [24].
Fig. 5A presents spectra recorded in SA and salicylic alcohol. These spectra include three bands. The first band at 212 and the third one at 300 nm can be attributed to interactions of carboxylic substituents with aromatic rings. The second band at 235 nm can be related to interactions of hydroxyl groups also with aromatic rings. Spectra recorded in these two solutions overlap, what means that the concentration of the active substance was the same. Similar bands were observed at UV-VIS spectra recorded in ASA and tested pharmaceuticals solutions (Fig. 5B). Concentrations of active substances determined from UVVIS spectra correlate with the concentrations determined from voltammetric curves.
Conclusions
The electroreduction behaviour of SA and ASA was investigated at Pt electrode. SA and ASA is reduced quasi-reversibly at Pt electrode at the potentials higher than the potential at which hydrogen evolution starts. SA (E1/2 = -0.455 V) is reduced easier than ASA (E1/2 = -0.465 V), while AA (E1/2 = -0.706 V) is reduced the most difficult. Concentrations of the active substances in the tested pharmaceuticals determined using electroanalytic and spectrophotometric methods are slightly different from the concentrations provided by the manufacturers. Differences can be related to the presence of excipients in pharmaceuticals. The voltammetric method can be applied in determining active substance contents in pharmaceuticals products.
References
1. de la Pena AM, Salinas F, Meras ID. Anal Chem. 1988;60:2493. [ Links ]
2. Samborska R. Anest Ratow. 2009;3:132. [ Links ]
3. Pastuszka M, Kaszuba A. Post Derm Alergol. 2012;3:205. [ Links ]
4. Miedzybrodzki R. Post Hig Med Dosw. 2004;58:438. [ Links ]
5. Vane JR, Botting RM. Thromb Res. 2003;110:255. [ Links ]
6. Awtry EH, Loscalzo J. Circulation. 2000;101:1206. [ Links ]
7. Wang Z, Li H, Chen J, et al. Talanta. 2011;85:1672. [ Links ]
8. Regula J, Wocial T, Kraszewska E, et al. Gastroenterol Klin. 2011;3:72. [ Links ]
9. Muralidharanb B, Gopu G, Vedhi C, et al. Appl Clay Sci. 2008;42:206. [ Links ]
10. Yardim Y, Leventa A, Keskin E, et al. Talanta. 2011;85:441. [ Links ]
11. Wudarska E, Chrzescijanska E, Kusmierek E, et al. Electrochim Acta. 2013;93:189. [ Links ]
12. Atta NF, Galal A, Azab SM. Int J Electrochem Sci. 2011;6:5082. [ Links ]
13. Babaei A, Taheri AR, Afrasiab M. J Brazil Chem Soc. 2011;22:1549. [ Links ]
14. Masek A, Chrzescijanska E, Zaborski M. Int J Electrochem Sci. 2014;9:7904. [ Links ]
15. Alghamdi AF. Port Electrochim Acta. 2014;32:51. [ Links ]
16. Du L, Liu X, Huang W, et al. Electrochim Acta. 2006;51:5754. [ Links ]
17. Masek A, Chrzescijanska E, Zaborski M. Food Chem. 2014;148:18. [ Links ]
18. Brett AMO, Ghica ME. Electroanalysis. 2003;159:1745. [ Links ]
19. Kissinger PT, Heinema WH. Laboratory techniques in electroanalytical chemistry. 2nd Ed. New York: Marcel Dekker; 1996. [ Links ]
20. Bard AJ, Faulkner LR. Electrochemical methods, fundamentals and applications. 2nd Ed. New York: John Wiley and Sons; 2001. [ Links ]
21. Brett CMA, Brett AMO. Electrochemistry: principles, methods and applications. New York: Oxford University Press; 1993. [ Links ]
22. Chrzescijanska E, Wudarska E, Kusmierek E, et al. J Electroanal Chem. 2014;713:17. [ Links ]
23. Rao CN, Subbarayudu K, Rao CN, et al. Port Electrochim Acta. 2010;28:349. [ Links ]
24. Santos AL, Takeuchi RM, Stradiotto NR. Curr Pharm Anal. 2009;5:69. [ Links ]
*Corresponding author. E-mail address: ewa.chrzescijanska@p.lodz.pl
Received 18 July 2014; accepted 18 August 2014

