Introduction
Corrosion inhibitors are frequently employed in industry for protecting metals and alloys against dissolution in acidic environments (e.g., HCl, H2SO4 and H3PO4) [1-4]. Synthetic non-organic [5-7] and organic inhibitors are some of the effective compounds used to reduce CR [8-11]. However, most of these substances are expensive, very hazardous to the environment, and they can damage biochemical processes or enzyme systems in human bodies [12, 13]. Therefore, there is the need to find new compounds that are environmentally safe, readily available, non-toxic, inexpensive, and with very high IE% [14-18].
Green inhibitors, particularly natural extracts from various parts of plants, have gained a lot of attention from scientists, in recent years, as substitutes of synthetic compounds [19, 20]. Therefore, according to literature, most corrosion inhibitors produced from plant extracts are viewed as an extremely rich source of complex constituents, such as N and O base compounds, alkaloids, flavonoids, tannins, organic acids, anthraquinones, polyamides and polyphenols [21, 22]. These substances have a corrosion inhibitory impact, due to their adsorption onto metal surfaces in acidic corrosive environments, which creates dense protective coatings and may [23] cause structural changes in the double layer, such as lower rates of anodic metal dissolution or cathodic H2 ion reduction, or even both [24].
Several authors have focused on the use of plant extracts and their essential oils as inhibitors for CS corrosion in acidic solutions.
I. Nadi et al. [3] studied the inhibitory action of Euphorbia falcata L. methanol extract on CS, in HCl. They found a high IE of 93%, at 3 g/L.
Q. Wang et al. [25] reported the positive effect of Ficus tikoua leaves as a natural inhibitor of CS corrosion in 1 M HCl, with an IE of 95%, at 200 mg/L.
H. Boubekraoui et al. evaluated three types of dates (Lassiane, Khalt and Tadmamt), and their combinations, as inhibitors of CS corrosion in 1 M HCl [26]. They also examined the essential oil of Lavandula intermedia (LAV) Walberton's Silver Edge as a green corrosion inhibitor against CS dissolution [27].
In another study, Bromelain was investigated as an inhibitor for low CS corrosion in a HCl solution, at different temperatures [28]. At 308 K, it had an IE of 93%, with a concentration of 1000 ppm, which increased to 97.6%, at 338 K.
The Moroccan ZL (desf.), often called Sedra or Nbag, is found in numerous arid and semi-arid areas of Morocco, such as Chaouia, Zear, Rhamna, Haouz, Middle Atlas Gharb, Errachidia, the coastal region of Safi, Khenifra, eastern Sahara and Oujda [29]. This plant belongs to the Rhamnaceae family [30-32]. Several sections of ZL plant are widely used in traditional medicine for the treatment of many diseases, human nutrition and health-promotion [33]. Numerous scientific reports have indicated that this plant contains significant amounts of glutamic acid, sterols, vitamins, fibers, amino acids, triacylglycerol, mineral matter and antioxidant compounds [34-36]. ZL leaves were discovered to be a major source of polyphenols and flavonoids (from 3630 to 8144 mg/100 g) [34], and C (40-64 mg/100 g) [36-38], A (13.52 mg/100 g) [31, 34] and E (155.71 mg/100 g) vitamins [32].
The main objective of the present investigation was to assess the properties of ZL leaves C2H5OH extract inhibition effect on CS corrosion in 1 M HCl, by electrochemical methods (Tafel extrapolation and EIS). The inhibitor concentrations, the solution temperature and the immersion time have been tested.
Materials and methods
Corrosion inhibitor preparation
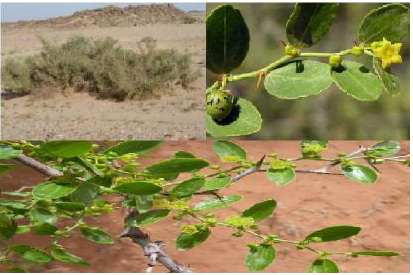
Fresh ZL leaves (Fig. 1), were plucked from Chichaoua region, Marrakech, in August. They were washed with tap water, for eliminating impurities, dried for 15 days, in the shade, at room temperature (25 to 27 ºC), then crushed into powder, using a blender. The extraction was carried out using the technique of maceration in C2H5OH. 15 g of powdered ZL were mixed with C2H5OH, for 48 h. The resulting solution was concentrated using a rotary vacuum evaporator, under 45 ºC. An appropriate amount of the solid extract was dissolved in a 1 M HCl solution, for obtaining the inhibitor desired concentrations, in the range from 0.5 to 3 g/L.
Electrode and solution preparation
CS chemical composition (wt%) is shown in Table 1.
The CS specimens, with the dimensions of 0.8 × 4 × 0.2 cm, and a rectangular shape, were employed for electrochemical measurements. Before each experiment, the WE surface was carefully abraded by a series of SiC papers (180, 200, 400, 600, 1200, 1500 and 2000 grades), degreased with acetone, abundantly rinsed with distilled water, and dried with warm air.
The aggressive solution of 1 M HCl was prepared by the dilution of HCl grade 37% (purchased from LOBA Chemie Company) with distilled water. Every test was performed with a freshly prepared solution. All corrosion tests were performed at a temperature of 293 K.
Electrochemical measurements
The electrochemical investigations were performed using a OrigaStat 100 potentiostat, controlled by Origamaster5 software. A conventional three-electrode cell was employed: a WE (CS with 0.64 cm² of exposed area); a CE (Pt); and a RE (SC). All the E values were compared to the SC electrode. In order to achieve a stable state OCP E value, the specimens were immersed in 1 M HCl solutions, for 30 min, before measurements. PDP curves of CS electrode in 1.0 M HCl, without and with ZL leaves extract, were recorded in the potential range from -750 to -100 mV/SCE, at the SR of 1 Mv/s-1. The frequency range for EIS tests was from 100 mHz to 1 kHz, at the OCP, with a signal amplitude perturbation of 10 mV. For identifying the parameters and determining the appropriate equivalent electrical circuit model, the data were examined using EC-Lab software. The temperature effect on the inhibitor performance was evaluated in the range from 293 to 323 K.
Results and discussion
PDP measurements
OCP
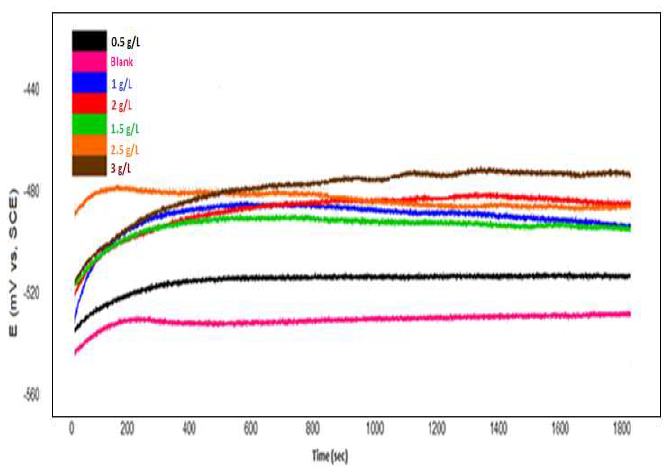
Determining OCP fluctuation in the WE, over time, is critical to explain metal corrosion mechanisms and behavior in the electrolyte (passivation, etc.) [39, 40]. Before the electrochemical measurements, the examined CS samples OCP was recorded, until a steady state condition was achieved. OCP variation with time, in 1 M HCl without and with different concentrations of ZL leaves C2H5OH extract, was evaluated, at 293 K. Fig. 2 presents the results.
At all ZL concentrations (except 2.5 g/L), OCP increased, and then stabilized after 30 min. As shown in Fig. 2, OCP value, at 2.5 g/L of the ZL solution, gradually decreased with time, which could be related to the CS surface corrosion. It stabilized at approxim. -0.487 V/SC, after about 20 min of immersion time. This could be related to the CS surface ennoblement, by the creation of a passivating film. In the blank solution, OCP increased over time, before stabilizing, at around -0.530 V/SC. N. Soltani et al. have already reported this behavior [40].
PDP curves
Fig. 3 shows the Tafel curves for the CS electrode, after 30 min of immersion, in 1 M HCl with various concentrations of ZL leaves extract, at 293 K.
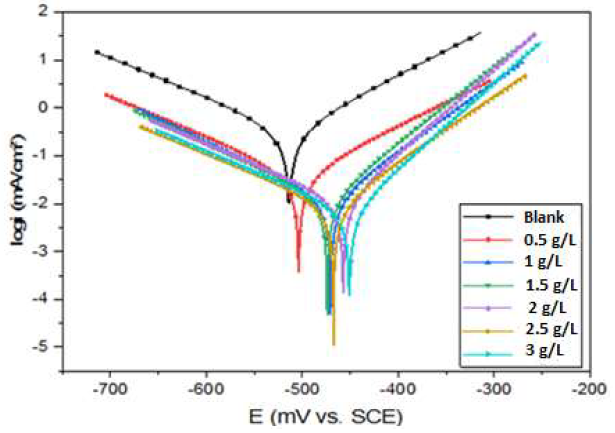
Figure 3 CS PDP curves, without and with ZL leaves extract, at different concentrations, in 1 M HCl, at 293K.
Ecorr, Icorr, ba and bc kinetic corrosion parameters extrapolation, and IE% are shown in Table 2. IE% from polarization data was calculated using equation (1) [41-43].
where Icorr and I'corr are corrosion current densities without and with inhibitor, respectively, derived from the Tafel plot.
Table 2 CS electrochemical parameters in 1 M HCl without and with ZL leaves extract, at various concentrations, and its corresponding IE%.
| Concentration (g/L) | Icorr (µA/cm2) | -Ecorr (mV vs SC) | ba (mV/dec) | -ba (mV/dec) | IE (%) |
|---|---|---|---|---|---|
| Blank | 174.4 | 513.7 | 58.6 | 88.6 | - |
| 0.5 | 25.1 | 503.8 | 67 | 98.5 | 86 |
| 1 | 18.4 | 471.6 | 86.4 | 124.3 | 89 |
| 1.5 | 11.7 | 474.0 | 68.5 | 95.7 | 93 |
| 2 | 10.7 | 457.2 | 58 | 118.4 | 94 |
| 2.5 | 9.6 | 468.1 | 87.2 | 117.2 | 94 |
| 3 | 7.7 | 450.7 | 65.2 | 129.6 | 95 |
PDP curves in Fig. 3 show that, as the ZL leaves extract concentration increased, both anodic and cathodic curves shifted to lower Icorr values, and Ecorr shifted to a positive E direction. This result implies that ZL leaves C2H5OH extract is a mixed type inhibitor for CS corrosion in 1 M HCl. According to previous studies, the difference in the interfacial E between the inhibited system and the blank solution can be used to identify the inhibitor type. If this difference is greater than 85 mV, the inhibitor can be classified as cathodic or anodic; if not, it is of the mixed type [44, 45]. In our study, the maximum displacement was approxim. 56 mV, which confirms that ZL leaves extract is a mixed type inhibitor, with anodic predominance. A similar behavior in Ecorr values has been indicated in the literature [46, 47].
It is also noteworthy that the cathodic curves were parallel Tafel lines, suggesting that HER was activation-controlled, and unaffected by ZL C2H5OH extract addition to the 1 M HCl solution. H+ ions reduction at the CS surface was mostly due to a charge transfer mechanism [48]. ZL leaves extract molecules were firstly adsorbed onto the CS surface, blocking the reaction sites, which reduced the surface area available for H+ ions, without altering the actual reaction process [49]. A wider coverage by ZL extract on the CS surface was obtained in solutions with higher concentrations. As shown in Table 1, Icorr decreased significantly from 174.7 to 7.7 µA/cm2, with 3 g/L ZL extract, at 293 K. It can be seen that, as the inhibitor concentration raised, IE% improved until it reached 95%, with 3 g/L ZL.
In another study, Dubey RK et al. investigated the performance of this plant as an inhibitor of MS corrosion in 1.0 M HCl. They reported an IE of 88.54%, at a concentration of 8% (v/v) [50].
EIS
EIS measurement is the most suitable method for identifying the inhibitors mechanism. It allows to measure the dielectric characteristics of the produced film and follow their evolution over time, using different parameters [13]. In this study, CS Nyquist and Bode plots, in a 1 M HCl solution without and with ZL, in different concentrations, at 293 K, are presented in Fig. 4a, 4b. The impedance parameters, Rct, Cdl and IE% are listed in Table 3. The IE% was calculated from equation (2) [51, 52]:
where Rct and Rct0 are the charge transfer resistance values, with and without ZL, respectively, obtained from the EIS diagrams.
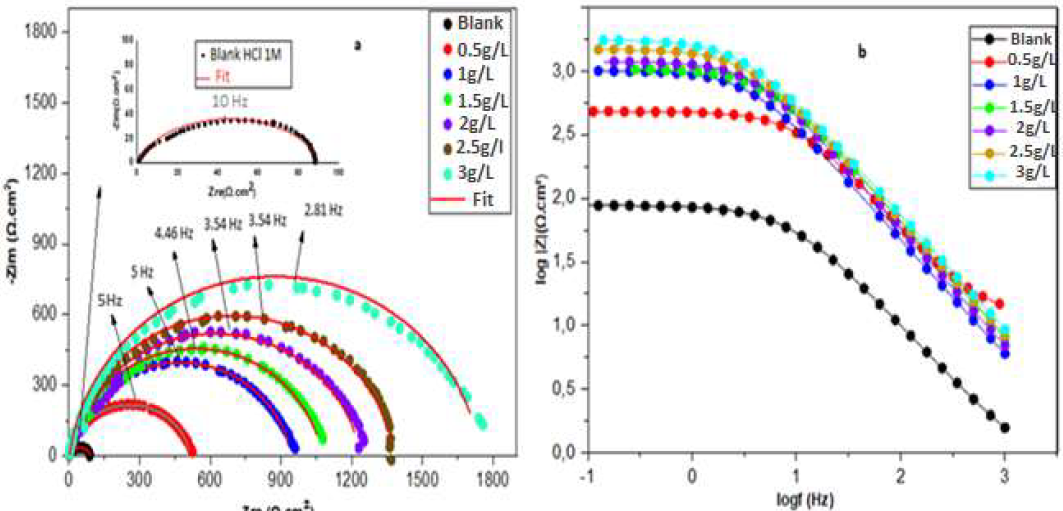
Figure 4 CS a) Nyquist plot and (b) Bode plot, in the HCl solution, without and with ZL leaves extract, in different concentrations, at 293 K.
Table 3 EIS parameters for CS in a 1 M HCl solution, without and with ZL extract, in various concentrations, at 293 K.
| Concentration (g/L) | Rs (Ω/ cm2) | Rct (Ω/cm2) | Cdl (μF/cm-2) | n | Qdl ( μω-1/cm-2/Sn) | IE (%) |
|---|---|---|---|---|---|---|
| Blank | 0.62 | 87.78 | 211.3 | 0.88 | 340 | - |
| 0.5 | 0.52 | 516.2 | 109.3 | 0.88 | 150.5 | 83 |
| 1 | 0.96 | 944 | 59.73 | 0.88 | 82.28 | 91 |
| 1.5 | 1.09 | 1 077 | 52.36 | 0.88 | 72.13 | 92 |
| 2 | 1.25 | 1 233 | 45.72 | 0.88 | 62.99 | 93 |
| 2.5 | 1.40 | 1 379 | 40.88 | 0.88 | 56.32 | 94 |
| 3 | 1.78 | 1 746 | 32.28 | 0.88 | 44.47 | 95 |
Fig. 4(a) shows that all plots of the uninhibited and inhibited samples had a single capacitive loop, and that the semicircular shape did not change after ZL leaves addition. This means that the corrosion reaction was under charge transfer control, and that the dissolution mechanism did not change after the inhibitor addition [17]. It can be seen, from the Nyquist graph, that higher ZL leaves extract concentrations led to an increase in the semicircles diameter. This could indicate that the organic compounds in the inhibitor were adsorbed onto the CS surface active sites [53]. As shown in Fig. 4(b), the impedance modulus increased with higher amounts of ZL C2H5OH extract, over the whole frequency range. These outcomes demonstrated the extract effective corrosion inhibition ability in the 1 M HCl electrolyte. The Nyquist plot semicircles are visibly imperfect. This behavior is typically attributed to the metal surface inhomogeneity, which is induced by surface roughness or interfacial phenomena [1, 17].
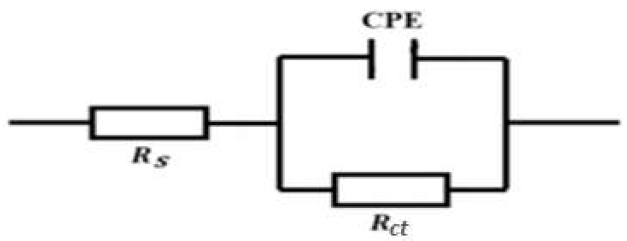
Impedance parameters were calculated from the fitting of the Nyquist plots experimental data, employing EC-Lab software. The strong agreement between the fitting lines and the experimental plots supported the proposed equivalent circuit model (Fig. 5). In this case, instead of C, CPE can be used to characterize the capacitance formed by the inhibitor at the metal surface [1, 17]. The CPE was used due to the non-uniformity of the capacitive layer produced at the surface. The CPE impedance is given by equation (3) [54]:
where Z is the constant phase frequency, A is the admittance, ω is the angular frequency, n is a number from -1 to 1 and j is a complex number. The system status was determined by the n value: the system is considered a pure capacitor if n = 1; a pure resistor if n = 0; or an inductor if n = -1. Other studies employed a similar equivalent circuit to explain the metal/solution interaction, without and with inhibitors [17, 53].
The increase in ZL leaves extract quantity led to an improvement in the corrosion IE%, as shown in Table 3. At 3 g/L, the highest corrosion IE of 95% was achieved. The increase in the inhibitor concentration led to a considerable reduction in the Cdl values, which decreased from 211.3 to 32.28 μF/cm2. This can indicate a reduction in the local Dk, due to the water molecules replacement by the inhibitor ones, and to an increase in the electrical double layer thickness, which implies ZL adsorption onto CS surface active sites [17].
Temperature effect on corrosion inhibition
Temperature has a significant effect on the inhibitors adsorption mechanism, since the active compounds may decompose and/or rearrange. It is a kinetic parameter that influences the metals corrosion phenomenon [55-56]. In order to research and assess CS behavior with changes in temperature, from 293 to 323 K, PDP measurements were carried out, without and with 3 g/L ZL leaf extract, as the optimal concentration that corresponds to the maximum IE% (Figure 6). Table 4 lists the polarization curves electrochemical parameters, at different temperatures.
The results indicate that higher temperatures caused an increase in HCl Icorr, without and with 3 g/L ZL leaves extract. This suggests that the inhibitor molecules acted by desorption on the CS surface in HCl, which is a characteristic of physisorption [55]. The IE decreased from 95 to 90%. The obtained results showed that the inhibitor offered adequate protection against CS corrosion, at the temperature of 293 K.
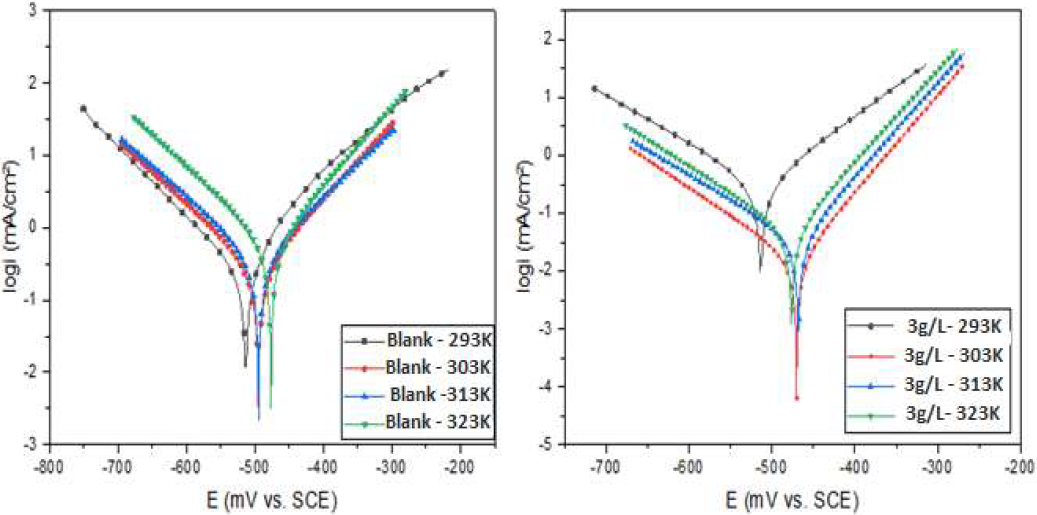
Figure 6 CS PDP curves in 1 M HCl and in 1 M HCl + 3 g/L of ZL leaves extract, at different temperatures.
Table 4 CS electrochemical parameters in 1 M HCl and in 1 M HCl + 3 g/L ZL leaves extract, at different temperatures.
| T (K) | Solution | Icorr (µA/cm2) | -Ecorr (mV vs SCE) | (a (mV/dec) | -(c (mV/dec) | IE (%) |
|---|---|---|---|---|---|---|
| 293 | Blank | 174.4 | 513.7 | 58.6 | 88.6 | - |
| Inhibitor | 7.69 | 450.7 | 65.2 | 129.6 | 95 | |
| 303 | Blank | 269.04 | 494.7 | 96.8 | 115.5 | - |
| Inhibitor | 15.69 | 470.4 | 59.9 | 104 | 94 | |
| 313 | Blank | 373.61 | 494.5 | 110.2 | 121.4 | - |
| Inhibitor | 26.1 | 476.4 | 57.1 | 85.2 | 93 | |
| 323 | Blank | 595.89 | 476.51 | 93.1 | 114.1 | - |
| Inhibitor | 59.6 | 476.4 | 66.3 | 109.1 | 90 |
Immersion time effect on corrosion inhibition
The immersion time influence on IE% was explored, for showing ZL leaves extract stability throughout time. EIS is a helpful technique for long-term assessments, since it does not significantly disturb the system, and it allows for the experiments following over time. Immersion time experiments were carried out in 1 M HCl, without and with 3 g/L ZL C2H5OH extract, for 30 min, 1, 2, 4, 8, 10, 12 and 24 h, at 293 K. EIS diagrams were acquired, as shown in Fig. 7. IE% and other calculated parameters are grouped in Table 5.

Figure 7 CS Nyquist plots in: a) 1 M HCl and b) 1 M HCl + 3 g/L of ZL extract, with different times of immersion, at 293 K.
Table 5 CS electrochemical parameters in 1 M HCl and 1 M HCl + 3 g/L of ZL extract, with different times of immersion, at 293K.
| Solution | Immersion time | Rs (Ω.cm2) | Rct (Ω.cm2) | Cdl (μF.cm-2) | n | Qdl (μω-1.cm-2.Sn) | IE (%) |
|---|---|---|---|---|---|---|---|
| Blank (1 M HCl) | 30 min | 0.62 | 87.78 | 211 | 0.88 | 340 | -- |
| 1 h | 0.20 | 77.86 | 118.6 | 0.84 | 247.6 | -- | |
| 2 h | 0.95 | 57.99 | 261 | 0.92 | 363.4 | -- | |
| 4 h | 1.06 | 43.91 | 365.2 | 0.96 | 425.9 | -- | |
| 8 h | 0.69 | 38.64 | 472.5 | 0.91 | 669.6 | -- | |
| 10 h | 0.70 | 33.46 | 569.1 | 0.95 | 697.1 | -- | |
| 24 h | 0.54 | 25.36 | 1510 | 0.87 | 2301 | -- | |
| 1 M HCl +3 g/L ZL extract | 30 min | 1.78 | 1 746 | 32.28 | 0.88 | 44.47 | 95 |
| 1 h | 0.71 | 1874 | 33.19 | 0.92 | 44.13 | 96 | |
| 2 h | 0.24 | 1 590 | 40.64 | 0.9 | 53.1 | 96 | |
| 4 h | 0.17 | 1518 | 41.04 | 0.9 | 55.67 | 97 | |
| 8 h | 0.03 | 1312 | 43.04 | 0.87 | 60.97 | 97 | |
| 10 h | 0.05 | 1130 | 45.9 | 0.87 | 66.6 | 97 | |
| 24 h | 0.2 | 1040 | 46.38 | 0.86 | 69.78 | 97 |
The outcomes revealed that the immersion time had a considerable impact on the impedance spectrum size, as illustrated in Fig. 7. The capacitive loops kept the same shape in the uninhibited and inhibited solutions, which indicates that CS corrosion was mainly controlled by a charge transfer process, during time. As indicated in Table 5, with ZL leaves extract, CS Rct decreased as the immersion time increased. However, a stable IE% value was noted as the immersion time rose. The IE attained 98%, after 24 h, with 3 g/L of inhibitor. According to Chafiq et al., this is mainly due to the significant number of unoccupied or vacant sites [57]. At the first contact of CS with the inhibited solution, attractive forces are developed between the active sites and the free electrons from the heteroatom molecules, which contribute to enhance the inhibitor productivity during the immersion time, until it complete fills the medium [57, 58]. This behavior had already been reported by Chaouiki et al. [59] .
Conclusions
ZL leaves extract IE%, against CS corrosion in a 1 M HCl solution, was evaluated using electrochemical techniques. The outcomes indicate that the ZL leaves C2H5OH extract was an effective inhibitor for CS corrosion in HCl. Results obtained through EIS revealed a maximal IE of 95%, with an inhibitor concentration of 3 g/L-1, at 293 K. Furthermore, the PDP findings demonstrated that the ZL leaves extract is a mixed inhibitor, since it affected both cathodic and anodic processes. As the temperature rose from 293 to 323 K, the extract ability to inhibit corrosion became less effective. The results obtained from this study show that the ZL leaves extract has a long-term stable inhibiting effect. The outcomes demonstrated that PDP and IES were in excellent accordance.
Acknowledgment
The authors express their gratitude to the team of the Laboratory of Bioprocesses and Biointerfaces for supporting this work.
Abbreviations
(a: anodic Tafel slope
(a: cathodic Tafel slope
C: capacitor
C2H5OH: ethanol
Cdl: double layer capacitance
CE: counter electrode
CR: corrosion rate
CS: carbon steel
CPE: constant phase element
Dk: local dielectric constant
E: potential
Ecorr: corrosion potential
EIS: electrochemical impedance spectroscopy
HER: hydrogen evolution reaction
H2SO4: sulphuric acid
H3PO4: phosphoric acid
HCl: hydrochloric acid
Icorr: corrosion current density
IE%: inhibition efficiency
OCP: open circuit potential
PDP: potentiodynamic polarization
Qdl: double layer charge
RE: reference electrode
Rct: charge transfer resistance
Rs: solution resistance
SC: saturated calomel
SR: scan rate
WE: working electrode
Wt%: weight percentage
ZL: Ziziphus lotus
Authors’ contributions
Sara Lahmady: conceived and designed the analysis; collected the data; inserted data or analysis tools; wrote the paper. Omar Anor: performed the analysis; collected the data. Issam Forsal: conceived and designed the analysis; edited and formatted the paper. Bouchaib Mernari: conceived and designed the analysis; supervised the project. Hafida Hanin: collected the data; Khalid Benbouya: contributed to the interpretation of the results; Abderrahmane Talfana: collected the data.


