


 Inglês (pdf)
 Artigo em XML
 Referências do artigo
 Enviar este artigo por email
 Citado por SciELO
  Similares em
SciELO
Similares em
SciELO 
 Permalink
Introduction
Metals are widely used in today’s world, especially in the fields of engineering, such as shipping, building, construction, machining, automobile, petroleum, and mining 1-3. Although the attractiveness and strength experienced from this metals while in use allow for their wider application, they are deeply affected by corrosion damage. Corrosion hinders metals’ durability, tensile strength, malleability, ductility, conductivity, lustrous, etc. Being the deterioration of a metal under unfavorable surrounding conditions 2,4, corrosion seems difficult to manage, considering the different growing environmental conditions experienced today, especially from green house effects. Corrosion causes are widely attributed to electrochemical or chemical processes involved in the preparation and treatment of metals before their application, such as acid pickling, acidification, descaling and fracking processes. 1,3-5.
Chemical CI have posed serious threat to the environment and the ecological system, since they are expensive to produce, difficult to procure (not easily assessable), and dangerous to health 1-5.
Therefore, since efforts have been taken in establishing alternative means to combat corrosive effects, plant extracts are mostly in use today in the area of corrosion mitigation 2,3,5-7. These group of CI are desirable, since they are ecologically friendly, inexpensive to produce, easily assessable and harmless to living beings 2,4,8. The interesting thing about plants is that they also possess hetero atoms (P, S and N), which are found in the presence of the hetero compounds (s), characteristics that portray them as good inhibitors 9,10.
MFe is made by continuous heating and cooling of white Fe. This process allows for the release of graphite molecules into the Fe carbide. Products made from this MFe bend without breaking, and offer a decent tensile strength. MFe is used in fences, pipes and electrical fittings, washers, tools, farm equipment and implements and machine parts 10-12. SAA is a major alkaloid of Cnidoscolus aconitifolius plant, which is popularly named as tree spinach. Its leaves are very high in protein, Ca, Fe, carotene and A, B and C vitamins.
The research target of this study was New Jerusalem Community in Obudu, Nigeria, where there are severe corrosion effects on tools/farm equipment and implements produced from MFe. It is believed that this research may promote the utilization of major alkaloids on these plants, for solving these corrosion effects.
Experimentation
Electrochemical experiment
A Gamry Reference 600 potentiostat was used. MFe, SCE and a 1 cm2 Pt foil were used as working, reference and counter electrodes, respectively. Electrochemical tests were conducted. With Rct and Icorr data, EI(%) obtained from EIS and PDP were calculated using Eqs. 1 and 2, respectively.
 (1)
(1)
 (2)
(2)
where r 𝑐𝑡 0 and 𝑟 𝑐𝑡 𝑖 and 𝐼 𝑐𝑜𝑟𝑟 0 and 𝐼 𝑐𝑜𝑟𝑟 𝑖 represent Rct and Icorr in HCl without and with SAA, respectively.
Computational method
This was carried out using Material Studio (version 8.0) software. Theoretical information, including EHOMO, ELUMO, ΔE, π, ɳ and σ, was derived according to (13, 14).
WL experiment
Soxhlet extraction method was adopted for the crude SAA extraction, while a separating funnel was used for the alkaloid extraction, according to previous works of 15-17. 5 g were used to make the stock solution from where serial dilution into different Ct of 1.0, 2.0, 3.5, 5.0 and 7.5 g/L were prepared. 100 mL beakers containing 100 mL SAA solution of different Ct were used to carry out the experimentation, while MFe coupons of 5.0 x 0.08 cm dimensions were suspended with a thread in the solutions. The composition of MFe used in this research was C (2.2-2.9%), Si (0.9-1.9%), Mn (0.15-1.25%), S (0.02-0.2%), P (0.02-0.2%) and the rest Fe. Crude Fe obtained from System Metals Company, Calabar, was pretreated through mirror surface polishing, using 200, 600 and 1200 grit of emery paper. Polished Fe was then washed in distilled water, degreased in ethanol, rinsed in acetone and air dried. The MFe coupons were then stored in an air tight desiccator. The experimentation was set for 60 min interval, after which the coupons were removed, washed in distilled water, degreased and rinsed in ethanol and acetone respectively, then air dried and weighed. The experiment was conducted for 6 h. IE(%) was calculated from Eq. 3.
 (3)
(3)
where 𝑟 𝑏 and 𝑟 𝑖 represent CR of MFe in HCl without and with SAA, respectively.
HER (gasometric) experiment
This experiment was carried out using gasometrical assembly equipment. MFe had dimensions of 2.0 x 0.08 cm. The experimentation was performed following previous works of (15, 18). IE(%) of SAA was calculated from the CR of MFe from HER volume, according to Eq. 4.
 (4)
(4)
where &0 and &i are CR of MFe in HCl without and with SAA, respectively, and Q% represents IE(%).
Results
Electrochemical analysis
The calculated values for electrochemical parameters, as displayed in Table 1, were obtained from Fig. 1a, which shows extended positive loops across the different Ct. The highest loop occurred at 7.5 g/L, showing that this Ct of SAA obtained the best inhibition of MFe corrosion in HCl.
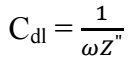 (5)
(5)
where Z” is impedance imaginary component, at any frequency inside the semicircle, and ω is angular frequency.
Table 1: Calculated values from Nyquist plots of EIS experiments.
| Ct of HCl in M (g/L) | rct (Ω/cm-2) | Cdl (µF/cm-2) | A% |
|---|---|---|---|
| 1 | 97 | 1.64 x 10⁻⁵ | - |
| 1.0 | 388 | 4.10 x 10⁻⁶ | 75.0 |
| 2.0 | 426 | 3.37 x 10⁻⁶ | 77.2 |
| 3.5 | 584 | 2.73 x 10⁻⁶ | 83.4 |
| 5.0 | 619 | 2.57 x 10⁻⁶ | 84.3 |
| 7.5 | 1033 | 1.54 x 10⁻⁶ | 90.6 |
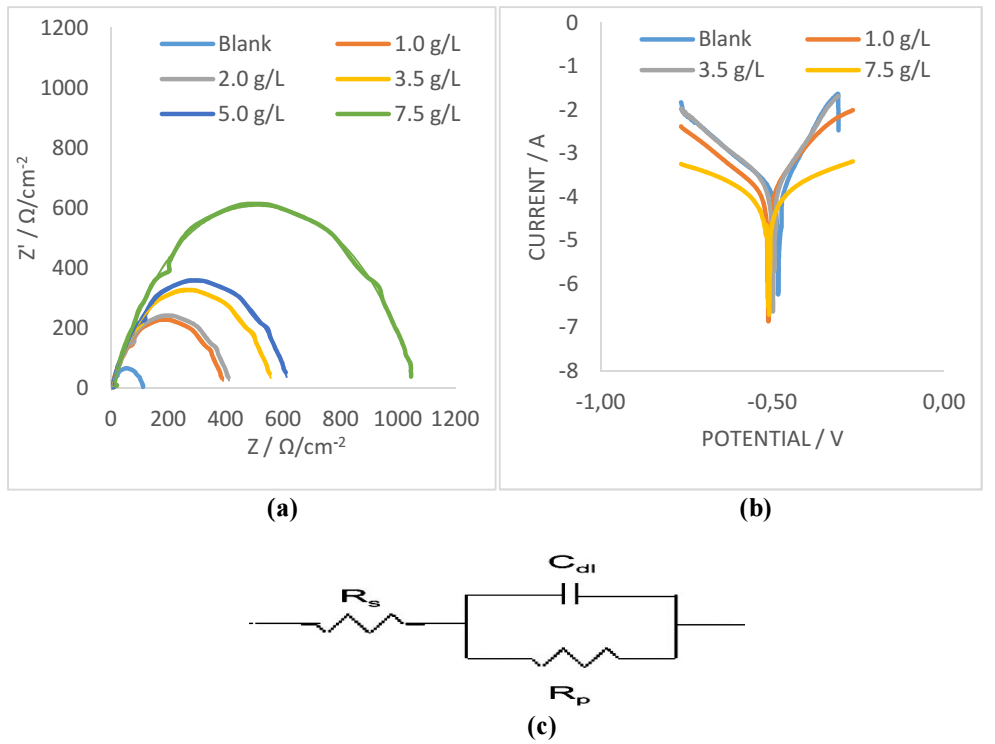
Figure 1: (a) Nyquist plot; (b) Tafel plot; and (c) electrochemical equivalent circuit diagram for CI of MFe in 1 M HCl.
However, calculated values of IE(%) showed that SAA reduced the trend of MFe anodic dissolution, leading to oxidation, thus protecting the metal from acidic corrosion 16,19,20. This is supported by high Rct values in Table 1, which shows that SAA reduced the possibility of rapid charge transfer across the working electrode (MFe) and HCl, hence protecting it against corrosion 19,20. Electrochemical equivalent circuit for EIS is presented in Fig. 1c.
The data for semicircle Cdl were determined by Eq. 5, and are shown in Table 1.
Icorr aids in explaining the accumulated current charges on the working electrode. This accumulation could enhance or decrease the extent of corrosion effect on the working electrode 17,18,21,22. Table 2 shows a decrease in Icorr, from 6.9 to 0.6 mA/cm-2, for MFe in HCl without and with SAA, respectively, which was derived from Fig. 1b. As Icorr values tend to be lower than those of blank HCl, IE(%) values of SAA are expected to be higher at the metal/surface interface. This experience with SAA was typical, as recorded in Table 2, which indicates that it was actively adsorbed onto the working electrode, hence reducing the strong effect of acid corrosion on MFe 10-12. SAA addition to HCl slightly shifted Ecorr data, but altered both βa and βc values, indicating that it is a mixed type of inhibitor 23.
Table 2: Calculated values from Tafel plots of PDP experiments.
| Ct (g/L) | Icorr (mA/cm-2) | Ecorr (mV) | (c (mV/dec) | (a (mV/dec) | J(%) |
|---|---|---|---|---|---|
| Blank | 6.911 | -806 | 217 | 145 | - |
| 1.0 | 1.431 | -661 | 211 | 110 | 79.3 |
| 3.5 | 0.519 | -652 | 172 | 98 | 92.5 |
| 7.5 | 0.164 | -118 | 109 | 83 | 97.6 |
Computational analysis
It can be seen from Figs. 2a-c that HOMO of SAA is situated at the tropane skeletone, while its LUMO is seen in the benzene ring. HOMO placement in SAA indicates that O and N were the preferential sites for the corrosive attack 13-15.
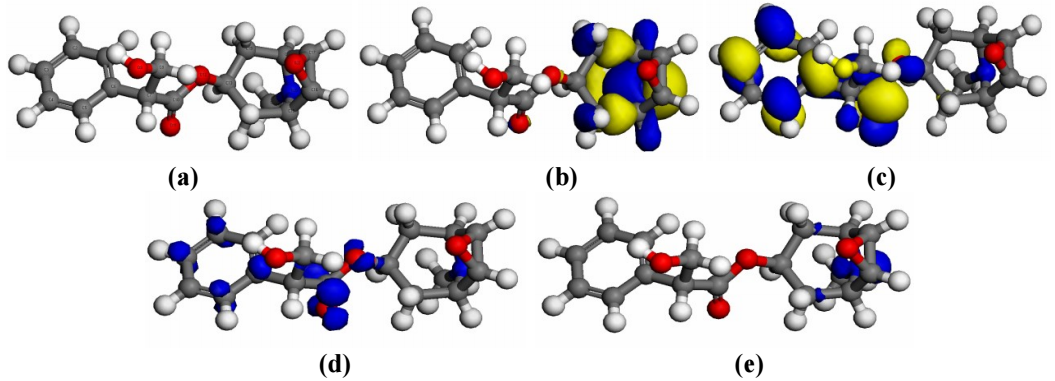
Figure 2: SAA structure showing: (a) optimized structure; (b) HOMO; (c) LUMO; (d) adsorption centers for Fukui (+); and (e) Fukui (-) functions.
Table 3 presents different quantum values obtained using DFT. Value for change in ΔE was far lower than the threshold, hence explaining better inhibition arising from the possibility of an electron to be removed from HOMO 13. It is also seen that ( value is higher than σ. Literature shows that the more softer a molecule, the more stronger the inhibition trend 14,15. Hence, SAA showed an increased IE(%), which was confirmed from µ high value. To affirm the centre of adsorption of the effective constituents adsorbed onto MFe surfaces, Fukui indices were examined on their local reactivity (Figs. 2d and e).
It is clear from Table 3 that N, O, and other C atoms closer to those atoms, could profer perfect adsorption witnessed in the experimental study with alkaloids. SAA has propitious zones for nucleophilic attack located on O9, O11, O12 and N20. SAA has increased dependable sites for its adsorption onto MFe in the HCl solution.
Table 3: Quantum mechanical calculation parameters for SAA major adsorbed compounds.
| Parameters | SAA |
|---|---|
| µ (debye) | 1.002 |
| EHOMO (eV) | -3.440 |
| ELUMO (eV) | -1.277 |
| ΔE (eV) | 2.163 |
| ( | 1.510 |
| σ | 0.513 |
WL determination
Slope values from WL plots (mg) vs. IT (min) were used to determine CR values, as shown in Table 4. It is seen that WL values of MFe were lower in SAA presence than in its absence. This is always due to SAA molecules strong adsorption onto the MFe exposed corrosion active sites 12,19,24.
Table 4: Fukui indices showing local reactivity for SAA.
| Negative (-) charge centers | Positive (+) charge centers | Total charges |
|---|---|---|
| O9, O11, O12, C14, C19, N20, C21 and C22 | C10, C13 | 10 |
Since water molecules and O presence around MFe tends to expedite corrosion, it is possible that SAA absence to replace water molecules on the metal created a condition for oxidation at anodic sites. This allowed for corrosion to occur, as seen in CR value for the blank 1 M HCl solution 22-25. SAA strong adsorption onto the MFe surface led to an increased IE(%) recorded at 98.3%, as shown in Table 5.
Table 5: WL data for CI of MFe by SAA in 1 M HCl.
| Ct of HCL in M (g/L) | CR (mg/cm2/h) | SC (θ) | IE(%) |
|---|---|---|---|
| 1 | 7.646 | - | - |
| 1.0 | 4.097 | 0.464 | 46.4 |
| 2.0 | 3.267 | 0.573 | 57.3 |
| 3.5 | 1.808 | 0.764 | 76.4 |
| 5.0 | 1.067 | 0.860 | 86.0 |
| 7.5 | 0.127 | 0.983 | 98.3 |
Gasometric analysis
The researchers investigated the effect of different T (313, 323 and 333 K) on SAA, to determine its inhibitive strength. It is seen from Table 6 that SAA showed appreciable inhibition at T up to 333 K. IE(%) was also noticed to increase with higher Ct of SAA, as earlier recorded in WL results. This is applicable to corrosion active sites deactivation by strong adsorption of SAA molecules onto the MFe surface 25,26. There was a slight decrease in IE(%) following the rise in T. This is due to SAA molecules gradual desorption caused by strong T and accumulated corrosion particles in HCl 25-27. However, inhibition was stronger at lower T of 313 K (98.7%), which explains a physical adsorption phenomenon and a possible exothermic reaction, where new bonds are formed between SAA molecules and MFe lattice 28-30.
Table 6: HER data for CI of MFe by SAA in 1 M HCl.
| Ct M (g/L) | 313 K | 323 K | 333 K | 313 K | 323 K | 333 K | 313 K | 323 K | 333 K |
|---|---|---|---|---|---|---|---|---|---|
| 1 HCl | 13.060 | 17.265 | 26.809 | - | - | - | - | - | - |
| 1.0 | 4.999 | 7.989 | 14.633 | 0.617 | 0.537 | 0.454 | 61.7 | 53.7 | 45.4 |
| 2.0 | 3.066 | 5.886 | 10.685 | 0.765 | 0.659 | 0.601 | 76.5 | 65.9 | 60.1 |
| 3.5 | 2.905 | 3.602 | 8.682 | 0.778 | 0.791 | 0.676 | 77.8 | 79.1 | 67.6 |
| 5.0 | 0.783 | 2.167 | 5.084 | 0.940 | 0.875 | 0.810 | 94.0 | 87.5 | 81.0 |
| 7.5 | 0.175 | 0.431 | 2.736 | 0.987 | 0.975 | 0.898 | 98.7 | 97.5 | 89.8 |
Adsorption mechanism
Langmuir’s isotherm was deployed to study SAA nature of adsorption onto the MFe surface, using data generated from gasometric analysis. Table 7 shows various adsorption parameters.
Table 7: Langmuir’s isotherm data for MFe CI by SAA in 1 M HCl.
| T (K) | Ct (g/L) | R2 | Slope | ∆G*ads (kJ/mol) |
|---|---|---|---|---|
| 313 | 0.625 | 0.9976 | 1.185 | -9.029 |
| 323 | 0.800 | 0.9922 | 1.394 | -9.966 |
| 333 | 0.839 | 0.9939 | 1.575 | -10.403 |
Langmuir’s isotherm equation used to calculate the various adsorption parameters is represented in in Eq. 6.
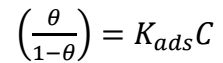 (6)
(6)
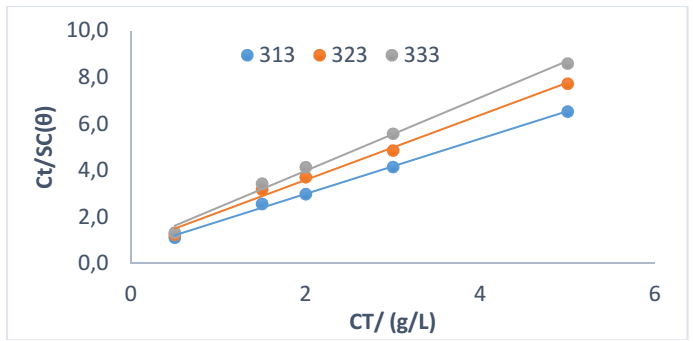
where 𝜃 and C are SC and Ct of SAA, respectively. A perfect linear R2 was obtained when data from gasometrical analyses were fitted into Langmuir’s isotherm model (Fig. 3), suggesting that SAA adsorption mechanism was consistent with that model (11-13, 31) Eq. 7 was adopted for ΔGads calculation.
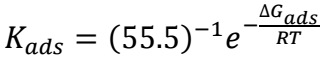 (7)
(7)
where R is universal gas constant (8.314 J/mol-1/K-1) and 55.5 is water Ct in HCl (mol/L-1). Literature reports confirm that Kads high value and ΔGads low value indicate a strong interaction of SAA with the metal surface and its adsorption onto it 29-32. Values obtained for those parameters confirmed that SAA showed a strong CI of the MFe surface.
Thermodynamics investigation
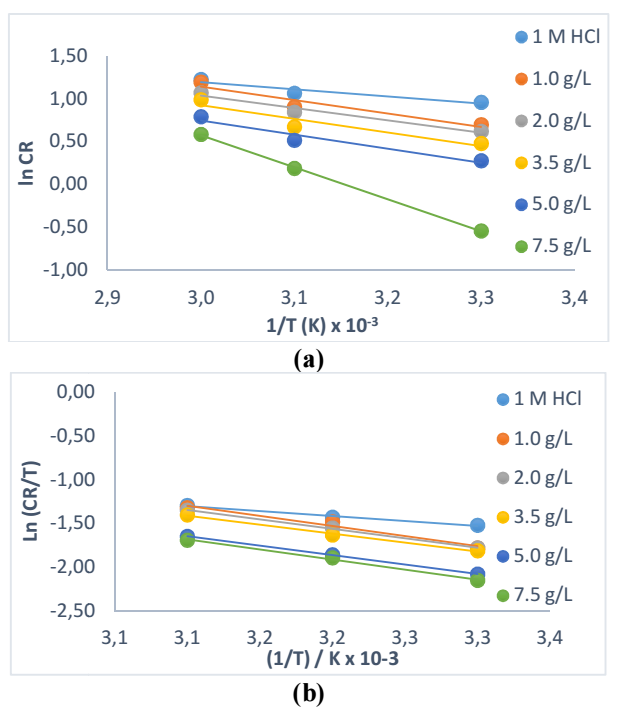
In other to examine the effect of T on the CI action of SAA on the MFe surface, Ea, ΔHads and ΔSads were calculated, as shown in Table 8.
Table 8: Thermodynamic data for CI of MFe by SAA in 1 M HCl.
| Ct of HCl in M (g/L) | Ea | ∆Hads (kJ/mol) | ∆Sads (kJ/mol) |
|---|---|---|---|
| 1 | 6.9 | -8.4 | -74.1 |
| 1.0 | 12.0 | -15.6 | -146.7 |
| 2.0 | 13.1 | -16.1 | -151.0 |
| 3.5 | 13.3 | -16.7 | -157.6 |
| 5.0 | 13.7 | -18.0 | -170.5 |
| 7.5 | 14.5 | -21.9 | -208.8 |
These data were derived from Arrhenius and transition state equation plots in Figs. 4a and b. From Table 8, it was confirmed that Ea data obtained for MFe with SAA were higher than those without it, and lower than 20 kJ/mol-1. This indicates that SAA adsorption was best at lower T, and that it was physical, which confirms results from gasometrical analyses 30,33. It also reveals that the system was required to overcome more energy for the corrosion reaction to occur, due to SAA molecules stronger adsorption onto the MFe surface. The analyses also revealed negative ΔHads and values lower than 80 kJ/mol-1, which indicates an exothermic reaction where new bonds were formed between SAA molecules and MFe lattice. SAA was also physically adsorbed, which confirms results from gasometrical analysis 22-23,34. The reaction was stable and spontaneous in the forward direction, and with a significantly lesser degree of disorderliness, as shown by ∆Gads (< 20 kJ/mol) and ∆Sads values 16-19,34-35.
SEM analysis
Figs. 5 a-c show images obtained for the working electrode (MFe) scanning in HCl without SAA and with its Ct of 1.0 and 7.5 g /L, respectively.
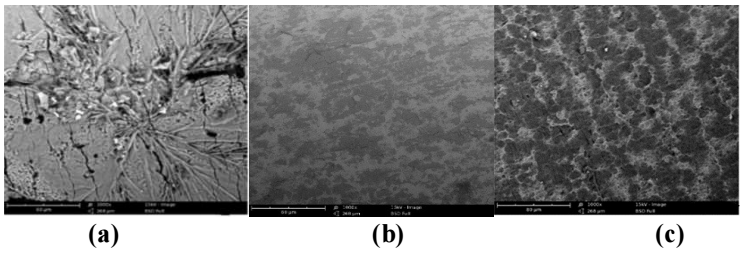
Figure 5: Images obtained from SEM for Fe corrosion in: (a) pure 1 M HCL; (b) with 1.0 g/L SAA; and (c) with 7.5 g/L SAA.
Fig. 5a depicts strong and aggressive attack from HCl on MFe, due to corrosion effects 32-34. However, SAA addition, at 1.0 g/L Ct, caused an appreciable decrease in metal surface roughness. Complete smoothness was achieved with a higher Ct of SAA (7.5 g/L). This could be due to large SC of the MFe surface by SAA, which protected both anodic and cathodic active sites from corrosion activation (10, 32-34).
Conclusion
It was observed from the various experiments that SAA perfectly mitigated MFe corrosion, with IE(%) up to 90.6, 97.6, 98.3 and 98.7%, for EIS, PDP, WL and HER results, respectively. SAA showed significant stability and less disorderliness while in contact with the MFe surface, through a physical adsorption phenomenon. SAA increased the reaction Ea, leading to higher energy requirement for corrosion to occur between it and MFe. Theoretical data show that SAA created a shorter ΔE between different bands of MFe, which allowed for an easy transition of the inhibitor molecules, hence establishing a speedy and stronger adsorption. All results obtained from in the experimental analyses in the study agreed.
Authors’ contributions
B. U. Ugi: research design; data analysis and interpretation of results; manuscript writing. J. E. Boekom: data analysis; manuscript proofreading. P. B. Ashishie: material collection; laboratory work; manuscript review. P. U. Ubua: laboratory experimentation; manuscript proofreading.
Abbreviations
Cdl: double layer capacitance
CI: corrosion inhibitors
CR: corrosion rate
Ct: concentration
DFT: density functional theory
Ea: activation energy
Ecorr: corrosion potential
EHOMO: energy of the highest occupied molecular orbital
EIS: electrochemical impedance spectroscopy
ELUMO: energy of the lowest occupied molecular orbital
HCl: hydrochloric acid
HER: hydrogen evolution reaction
HOMO: highest occupied molecular orbital
Icorr: corrosion current
IE(%): inhibition efficiency
IT: immersion time
J: current density
Kads: equilibrium constant of the adsorption-desorption
LUMO: lowest unoccupied molecular orbital
MFe: malleable Fe
PDP: potentiodynamic polarization
R2: regression coefficient
Rct: charge transfer resistance
SAA: scopolamine alkaloid
SC: surface coverage (θ)
SCE: saturated calomel electrode
SEM: scanning electron microscopy
T: temperature
WL: weight loss

