Serviços Personalizados
Journal
Artigo
Indicadores
-
 Citado por SciELO
 -
 Acessos
Links relacionados
-
 Similares em
SciELO
Compartilhar
Tourism & Management Studies
versão impressa ISSN 2182-8458versão On-line ISSN 2182-8466
TMStudies vol.13 no.2 Faro jun. 2017
MANAGEMENT: SCIENTIFIC PAPERS
The main barriers of Portuguese entrepreneurship ecosystem: Interpretive Structural Modeling (ISM) approach
As principais barreiras ao Ecossistema Empreendedor Português: Modelagem estrutural interpretativa
*Banha, F., ** Almeida, H., *** Rebelo, E., **** Orgambídez-Ramos, A.
*University of Algarve, Faculty of Economics, Gambelas Campus, 8005-139 Faro, Portugal, a55262@ualg.pt
**University of Algarve, Faculty of Economics, Gambelas Campus, 8005-139 Faro, Portugal, halmeida@ualg.pt
***University of Algarve, Faculty of Economics, Gambelas Campus, 8005-139 Faro, Portugal, elrebelo@ualg.pt
****University of Algarve, Faculty of Humanities and Social Sciences, Gambelas Campus, 8005-139 Faro, Portugal, aoramos@ualg.pt
ABSTRACT
This study is based on the technique Interpretive Structural Modelling (ISM), in order to delineate a flowchart that shows the main ten barriers (and their relationships) influencing the development of Portuguese Entrepreneurship Ecosystem. Through a process of modelling it was possible to reach a graphical representation that shows the operating sequence of these barriers in order to understand the logic of their relationship. The results show a model represented by a flowchart consisting of 10 barriers, three of them that are positioned at the base of the model have political-legislative features with high level of range in all the remaining barriers, so a political involvement, carefully measured, could contribute to the improvement of the Portuguese Entrepreneurship Ecosystem. The final model is a useful tool that can be adopted by key decision-makers and players in the Ecosystem in order to optimize the selection of measures enabling the entrepreneurial activity in Portugal.
Keywords: Interpretive Structural Modelling, Portuguese Entrepreneurship Ecosystem, Barriers, Modelling, Flowchart.
RESUMO
Este estudo baseia-se na técnica Interpretive Structural Modeling (ISM), com vista a delinear um fluxograma que apresente as dez principais barreiras (e respetivas relações) influenciadoras do desenvolvimento do Ecossistema Empreendedor Português. Através de um processo de modelação foi possível chegar a uma representação gráfica que mostra a sequência operacional destas barreiras com vista a compreender a lógica da sua relação. Os resultados mostram um modelo representado por um fluxograma constituído por 10 barreiras, três das quais, posicionadas na base do modelo possuem características politico-legislativas com elevado nível de alcance em todas as restantes, pelo que um envolvimento político, cuidadosamente calibrado, poderia vir a contribuir para a melhoria das condições do ecossistema empreendedor português. O modelo final, é um instrumento útil que pode ser adotado pelos principais decisores e atores do Ecossistema no sentido de otimizar a seleção de medidas dinamizadoras da atividade empreendedora em Portugal.
Palavras-chave: Modelagem estrutural interpretativa, Ecossistema Empreendedor Português, Barreiras, Modelação, Fluxograma.
1. Introduction
Entrepreneurial Ecosystems (EE's) are one of the impulse engines to the development and competitiveness of economies. However, design a self-sustaining system that encourages entrepreneurship is complex and requires work on different variables that, taken together, contribute to boost innovation and new business initiatives. According to Mason and Brown (2013) an Entrepreneurship Ecosystem (EE) is: “a set of interconnected entrepreneurial actors (both potential and existing), entrepreneurial organisations (e.g. firms, venture capitalists, business angels, banks), institutions (universities, public sector agencies, financial bodies) and entrepreneurial processes (e.g. the business birth rate, numbers of high growth firms, levels of ‘blockbuster entrepreneurship', number of serial entrepreneurs, degree of sell-out mentality within firms and levels of entrepreneurial ambition) which formally and informally coalesce to connect, mediate and govern the performance within the local entrepreneurial environment” (p.5). There are many entities worldwide that have invested heavily in the study and in the formulation of strategic plans and templates to facilitate the development of these ecosystems, including The World Bank, World Economic Forum, OECD, United Nations, European Commission, Eurydice, European Private Equity and Venture Capital Association, several universities (Business School of Harvard University, University of Toronto, University of Cambridge, Baylor University, Business School of University of Strathclyde, University of Exeter, University of Warwick, Utrecht School of Economics, Babson College …), non-governmental organizations (Council on Competitiveness, COTEC Portugal…), associations (European Regional Science Association - ERSA, Opinno…), companies (Augusto Mateus e Associados, LBC - Leadership Business Consulting…) e entrepreneurs (Brad Feld,…).
However, an ecosystem can only be sustainable if he can ignite entrepreneurship when faced with the various facilitators and barriers, both behavioural and contextual (personal, social, political, financial, economic and environmental).
This study aims to respond to the desire to know what is the flowchart which is delineated by the barriers of the Portuguese Entrepreneurship Ecosystem (PEE), in order to: (1) establish a framework of interactions between these barriers and (2) represent, in a diagram, the level of the reach of several barriers that are part of the ecosystem and their respective directions and interactions.
Being descriptive, the present study is structured as follows: (i) identification of the main ten barriers to EEP; (ii) description of the research methodology adopted; (iii) Interactions between Modelling Barriers to PEE; (iv) Model Analysis created based on the methodology suggested by the ISM.
2. Review of the literature to identify the main ten barriers to Portuguese Entrepreneurship Ecosystem
Following a review of available and relevant literature on the functioning of EE`s, it was possible to identify 21 barriers that may contribute to a lower efficiency of such ecosystems. These 21 barriers were subject to scrutiny by 10 experts about the Portuguese ecosystem in order to select the main 10 that they considered simultaneously as the most important and effective, that we will present here.
2.1 Lack of access to networks and business contacts
Entrepreneurs can thrive when they have access to corporate or social networks (Singh, 2000) since it is through the participating entrepreneurs these networks that they can have access to relevant information, technology, financial and non-financial as well as business contacts (Jain & Ali, 2013). Van de Ven and colleagues (1984) found that high performance entrepreneurs maintain a large and complex network of relationships with people inside and outside the company. A number of studies (Aldrich & Zimmer, 1986; Ostgaard & Birley (1996), Jain & Ali, 2013) also revealed that there is a positive relationship between the network that an entrepreneur has and the performance of his business project.
2.2 Psychological and cultural limitations in accessing the entrepreneurial activity
According to OECD/European Commission (2013) European countries are characterized by a low tolerance with regard to the consequences associated with faults and failures at the enterprise level and there is a social stigma attached to all that relates to the issue of bankruptcy. Despite the efforts made in the European Union and by each member country individually, that is (Fuerlinger et al, 2015) "the number of people interested in starting their own business has been declining since 2004, in 23 of the 27 Member States of the European Union to 37% of the population. In the US, that number is 51% "(p.11). In Germany, "78% do not think even desirable to start a business”).
2.3 Low level of self-efficacy and corporate ambition
According to Jain and Ali (2013) the intention of becoming an entrepreneur depends mainly on the personal attraction to entrepreneurship and perceived self-efficacy. Accordingly, Chen, Greene and Crick (1998) and Shane (2003, quoted by Jain & Ali, 2013) they really found evidence of a positive correlation between perceived self-efficacy and the decision to be an entrepreneur.
2.4 Lack of capital to finance start-up and business growth
The finding of the existence of market failures in business financing in the early stages (Mason & Brown, 2013; Startupinvestorsmanifesto.eu, 2014) concerns the actors of the public and private sector since, as stated Mazzucato (2013), "many companies terminate, for lack of access to additional capital to continue to work after periods of uncertainty in the market, than for lack of innovative technology "(p.162). The absence of a critical mass of seed capital and specialized investors in start-up business (Mason & Brown, 2013; May & Liu, 2015), decreases the likelihood of entrepreneurs achieve appropriate capital to the development of their business.
2.5 Lack of transparency and predictability of the legislative and regulatory environment
The legislative and regulatory environment related to business activity, particularly in industrial areas, bank financing and taxation have a significant impact on the motivation associated with the act of taking, and building entry barriers (Kouriloff, 2000; Auerswald, 2015; Fuerlinger et al., 2015). The OECD (2013) argues that one of the main limiting factors of entrepreneurial dynamics is the legislation and the regulatory environment, ie, intellectual property rights, immigration laws, income tax, insolvency law and corporate recovery, formal process creation of new businesses.
2.6 Reduced number of entrepreneurship education programs
Education for entrepreneurship, through cross-cutting programs to all disciplines and methodologies with learning by doing, remains little expressive, within Europe (Eurydice, 2016). Contrary to recommendations issued by the Commission of the European communities, in 2006, according to which public authorities, especially the authorities competent in the field of education, employment, industry and business, should actively promote the entrepreneurship horizontally and interdisciplinary education (European Commission, 2006:8). This flaw affects the transmission of feelings of confidence, initiative, entrepreneurial spirit and self-esteem (Jain & Ali, 2013) and, afterwards, the appearance of a greater number of potentially interested in the theme and in the entrepreneurial process.
2.7 Lack of high growth companies (commonly referred to as Gazelles)
Although it appears that policy makers in all OECD countries are strongly focused on promoting high growth firms (OECD, 2013), the fact is that the majority of EE`s continues to show poor results with regard to the generation, growth and sustainability of this company typology (Mason & Brown, 2013).
The results demonstrate ineffectiveness of stimulus measures by EE's the appearance of gazelle companies (Mason & Brown, 2010), conditioned on not getting levels above the average of productivity, innovation, export and internationalization. These companies generate a disproportionately large share of net new jobs compared to companies that do not record these high growth (Henrekson & Johansson, 2010).
2.8 Lack of programs of "Procurement" by the public administration aimed at start-ups
The European Commission (2014) estimates that the total amount of expenditure incurred by Public Organisms in 2011, in the procurement of goods and services and contracting of public works, reached more than 2,406 million euros, or about 19 percent of EU GDP European. Despite the high number of public procurement carried out annually at European level, the number of European start-ups that presented proposals is residual within the aforementioned public procurement, given the specificity and complexity of regulations, as recognized by the EU (2014). Even more, the use of public procurement has been recognized by the booster potential it has in terms of innovation and new business creation (Yanchao & Georghiou, 2015) and in the process of raising venture capital (Mazzucato, 2013).
2.9 Residual number of success cases within the Entrepreneurship Ecosystem
The residual number of successful cases originating in EE`s is a reality (Mason & Brown, 2013) that led even Isenberg (2011a) to defend the application of the "law of small numbers" to highlight the importance of enhancing, with the entrepreneurial community, the positive effects derived from the successes of this small number of entrepreneurs. This limitation (Napier & Hansen, 2011) contributes to a lower optimization of EE, by limiting the existence of a virtuous circle. The demonstration effect resulting from the presentation of these companies (Banha, 2001), would contribute to the training and motivation of entrepreneurs. This body of knowledge and skills would give more start-ups and better, therefore, most likely to succeed by investors and consequently more capital to be reinvested in the Ecosystem.
2.10 Lack of involvement of large companies in the Entrepreneurship Ecosystem
Hocherts and Wüstenhagen (2010) argue that large companies and start-ups have a decisive role in the design and marketing solutions that generate sustainable value. But for these benefits to occur will have to establish (Isenberg, 2011b) points of interest between the parties involved, only possible to achieve if big companies have a more active involvement in EE. In fact, several authors (Mason & Brown, 2013; Fuerlinger et al, 2015) who believe that in the heart of an EE should be multiple "big companies" because they play an important role in terms of human resource development, vocational training, management and technology and also in creating business opportunities for start-ups can test their solutions. Isenberg (2011b) points out that we cannot have a thriving EE without major companies to "cultivate it," intentionally or not.
3. Modelling of interactions between barriers
The Interpretive structural modelling (ISM), It is a technique introduced by Warfield in 1973, using a modelling process analyses the impact of an element on other elements in order to obtain better insight into a certain problem (Entezari, 2015). Uses a mathematical language applicable to complex problems in order to be analysed in terms of sets of elements and relationships (Jayant, Azhar & Singh, 2014-2015).
Methodologically ISM starts with an identification of variables, which are relevant to the problem or issue, and then extends with a group problem solving technique. Then a contextually relevant subordinate relation is chosen. Having decided on the element set and the contextual relation, a structural self-interaction matrix (SSIM) is developed based on pairwise comparison of variables. In the next step, the SSIM is converted into a reachability matrix (RM) and its transitivity is checked. Once transitivity embedding is complete, a matrix model is obtained. Then, the partitioning of the elements and an extraction of the structural model called ISM is derived (for all steps of the process unleashed by the ISM, see Jacob & Pramod, 2014, pp165-166).
Of the above steps, it is easily deduced that the ISM technique is characterized by having four attributes (Sharma et al, 2011.): 1) Interpretative, based on the judgment of the expert group that decides if and how the items / elements of the system are related (e.g. Raeesi et al (2013);. 2) Structural extracting an overall structure of complex variables, based on the identified relationships; 3) modelling, providing a model represented graphically configured by specific relationships and a general structure (Raeesi et al, 2013); 4) Help to impose an order and interaction of the complexity of the relationship between the various elements of a system (Sage, 1977).
4. Methodology
Like the ISM technique (Warfield, 1973) and the steps suggested by Jacob and Pramod (2014) we followed in this study, a methodology that includes the following steps:
Step 1: Identification and listing of all elements, factors, criteria, or dimensions (here, barriers) whose relations will go through a process of modelling. To this end, a comprehensive review of the literature was performed where is extracted 21 barriers that were presented to a group of 10 senior members of representative bodies of the main areas that make up the EEP. These experts assessed a semantic scale of five points, having at each end two opposite adjectives - unimportant and very important; ineffective and very effective - the importance and the relative effectiveness of the barriers, in order to ascertain the barriers with average values higher than the global average values and simultaneously the criteria importance and effectiveness.
Step 2: Formation of a contextual relationship between the identified set of barriers which can be evaluated. To this end it has formed a focus group with the participation of four experts, one of which assumed the role of moderator, benefiting not only their academic knowledge but fundamentally their experience. To this end, structural and contextual connections from the causal type were established, (leads to) the 10 barriers identified.
Step 3: Creation of the SSIM to indicate the relationship of these variables, two by two.
Step 4: Develop a designated binary matrix IRM from the SSIM and verify its transitivity, a key assumption of the model, which is based on the following principle: if A is related to B and B is related to C then A is related to C.
Step 5: Partition of IRM matrix in different levels.
Step 6: Construction of a flowchart based on the relationships identified in the IRM matrix, being careful to eliminate the transmission links.
Step 7: Conversion of the flowchart in ISM model obtained by replacing nodes for statements.
Step 8: Review of the model to confirm that there are no inconsistencies in its design.
The steps described above, carried out in this study to build the ISM model of development of the EEP are developed in the subsections that follow.
5. Modelling
5.1 Structural Self Interaction Matrix (SSIM)
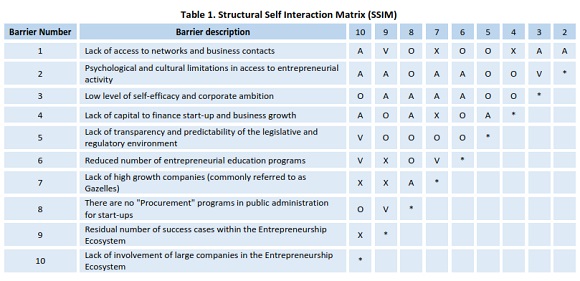
In order to understand the relationship between the ten barriers selected, we used a focus group on the basis of which it was possible to build the SSIM, following the following assumptions:
All relationships between any two actors i and j and the direction associated with relations were questioned. Four symbols, i.e., V, A, X and O were used to assign the type of relation between i and j barriers, as follows:
V-The enabler i ameliorate/improve to achieve enabler j
A-The enabler j ameliorate/improve to achieve enabler i
X- The enablers i and j ameliorate/improve to achieve each other
O- The enablers i and j are unrelated
The experts were asked to perform a contextual connection, such as "leads" between any two barriers. That is, when barrier i leads to barrier j, this barrier contributes to the j barrier may happen, or will strengthen it.
Contextual relationships between national EE barriers were identified by the cited experts, as Table 1.
5.2 Initial Reachability Metrics (IRM)
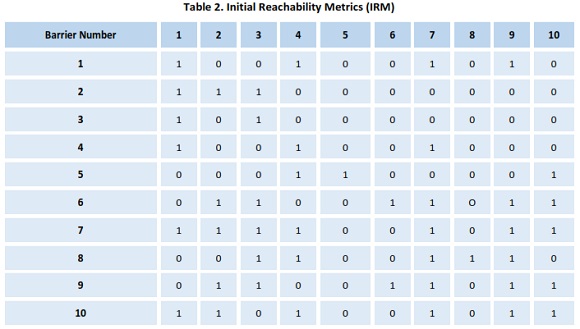
At this stage it is necessary to convert the constant symbol of SSIM in order to build the IRM matrix. To this end we will replace the symbols of the SSIM-V, A, X and O-for 1 and 0, according to the following rules: If the (i, j) entry in the SSIM is V then substitute in the (i, j) entry in the reachability metrics as 1 and (j, i) entry as 0. If the (i, j) entry in the SSIM is A then substitute in the (i, j) entry in the reachability metrics as 0 and (j, i) entry as 1. If the (i, j) entry in the SSIM is X then substitute in the (i, j) entry in the reachability metrics as 1 and (j, i) entry as 1. If the (i, j) entry in the SSIM is O then substitute in the (i, j) entry in the reachability metrics as 0 and (j, i) entry as 0. The application of these rules, the barriers to EE national IRM is shown in Table 2.
5.3 Final reachability Matrix (FRM)
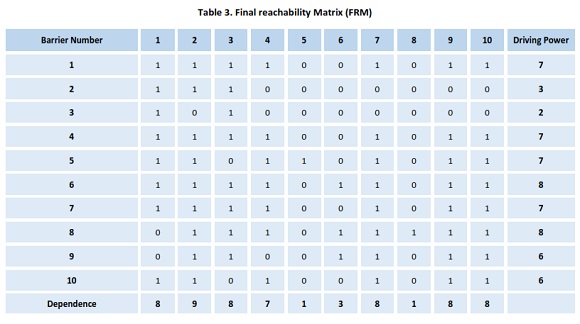
For the construction of the Final Reachability Matrix (FRM) we consider the effects of transitivity of IRM Matrix following the logic if A leads to B and B leads to C then A leads to C. For example, if the barrier 1 "lack of access to corporate networks and contacts" affects the barrier 7 "lack of high-growth companies (commonly known as gazelles)" which in turn affects the barrier 10 "lack of involvement of large companies in Entrepreneurial ecosystem ", so the first barrier will affect this last barrier.
This exercise resulted in the FRM Matrix that is represented by the Table 3 and that we present below:
Should be noted that in the construction of the Matrix FRM is also calculated the "Driving Power" and the respective "dependence". The "driving power" of a barrier is obtained by the total number of barriers, including itself, which is influenced by the barrier in question (in-line summation). In turn, the "dependence" of a barrier is the total number of barriers (including itself) leading to the barrier (SUM column).
Whether the data have been obtained at the level of "Driving Power" or the "Dependence", will be key to building the Cluster diagram that will be developed after modelling that will be carried out and described in the following points.
5.4 Level Partitions
At this stage it is found the range and antecedent set for each barrier, to the national EE, using the data in the Matrix FRM.
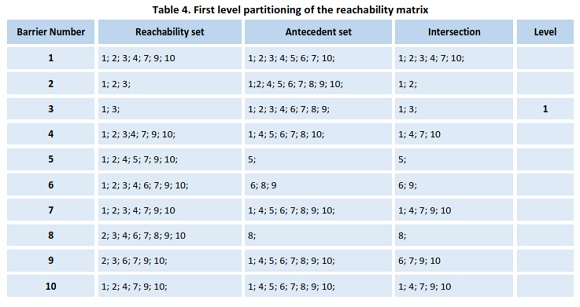
Thus the "reach set" (first column) includes all the barriers that are influenced by the barrier in question (including itself). In turn, the "set of antecedent" (second column) includes all the barriers that influence the barrier in question (including itself). On the other intersection (third column) shows the barriers that are part simultaneously of the reach and advance sets. When the intersection set is equal to the range set, the barrier in question gets with its level set.
In the next step of the barrier (s) of the top level, is (are) omitted from the list and its (their) number (s) corresponding (s) is (are) removed from all sets of reach, antecedent or intersection. In our case the first level of the range of the matrix is provided by the following set of intersections listed in Table 4:
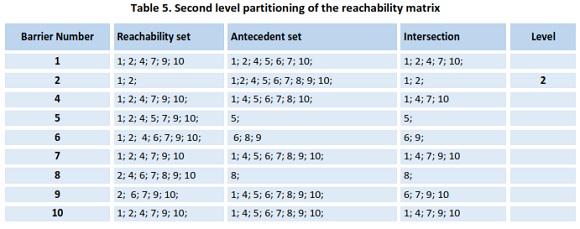
Thus, the barrier 3 "low level of self-efficacy and entrepreneurial ambition" fulfilled this criterion, therefore, will appear at the top of the flow chart. For the choice of subsequent levels, the barrier 3 will be omitted and withdrawal of all sets of reach and antecedent. This exercise leads to Table 5, from which we can identify the level II, according to the criteria explained above.
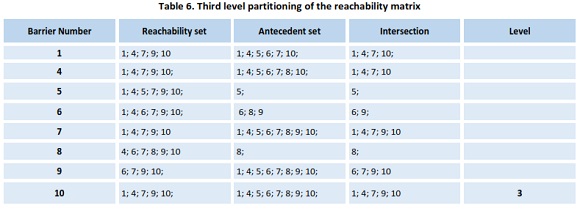
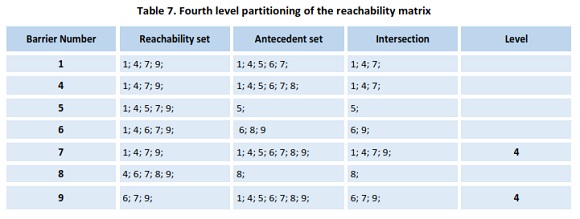
The same modelling procedure was continued until all levels are determined as shown in Tables 6, 7, 8, 9 and 10, which are shown below:
5.5 Formation of ISM-Based Model
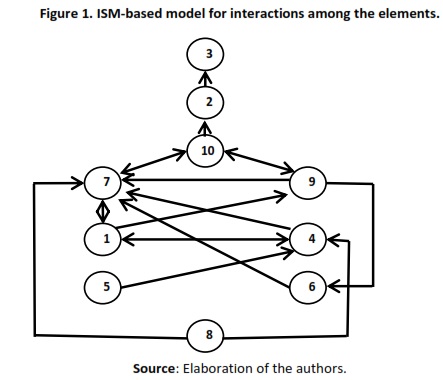
To create the final flowchart ISM (Figure 1) we used all the information collected in the previous step, each barrier was placed on the respective partition level. To determine the direction of links we used the MRI matrix, removing the transitivities.
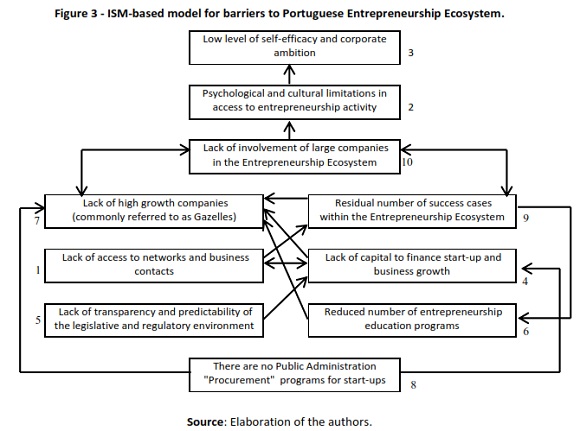
We can see that the barrier 3 stayed at the top preceded by the barrier 2, while at the base of diagram remained the barrier 8.
In the interpretation of the obtained model can be seen that the barrier 6 affects the barrier 7, which allows a direct direction (one-way) between these two limiting barriers of the optimizing of the national EE. All other links listed in the diagram, follow this logic.
5.6 Clustering of Barriers to Portuguese Entrepreneurship Ecosystem
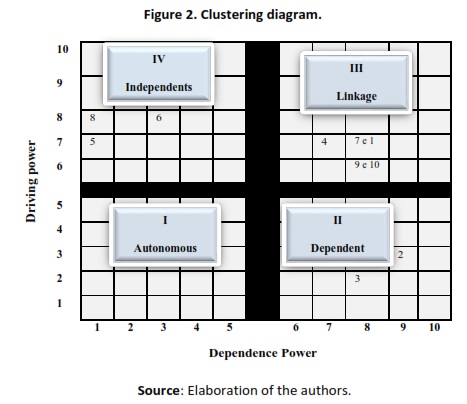
Using the information in the FRM Matrix, Table 3, in particular the details of the "Driving power" and "dependence" you can sort the barriers to national EE in four different clusters, namely: I- autonomous barriers; II-dependent barriers; III- connection barriers and IV- independent barriers. In this sense each barrier was positioned on the diagram (Figure 2) according to their respective "driving power" and "Dependence”:
Accordingly, and with regard to the dependence of strength and "driving power", the barriers can be classified into four different clusters taking into account their score, i.e. autonomous barriers dependent barriers, binding barriers and independent barriers.
The first cluster (I) is in the autonomous barriers which have low driving power and are fairly weak dependence and disconnected from the system. We can verify that none of the barrier is located in the autonomous barriers, i.e., none of the barriers is disconnected from the system.
The second cluster (II) contains the dependent barriers, i.e. those with weak driving power but strong dependence. These barriers are the ones most susceptible to be affected by other being their power of influence tiny. Thus, in the second cluster we have two barriers, the barrier 3 which has a dependency 8 and driving power 2 and the barrier 2 with dependence 9 and driving power 3.
Naturally, these are barriers that are on top of the flow chart, as result of the existence of all other barriers that remain downstream.
The third cluster (III) contains connecting barriers because it has strong driving power associated with a strong dependence. These barriers are key barriers to EE and any action of these barriers will have an effect on the remaining barriers.
Thus, in the third cluster we have 5 barriers (i) the barriers 9 and 10, both with 8 dependence and 6 driving power, (ii) the barriers 1 and 7 with dependence 8 and driving power 7 and (iii) barrier number 4 with dependence 7 and driving power 7.
The fourth and last cluster (IV) presents the independent barriers, or with a strong driving power and low dependency. These barriers are considered the basis on which all other barriers are based, and because of that they deserve particular attention in the analysis made to its impact on the effectiveness of the EEP. The barriers belonging to this last cluster are (i) the barrier 6 with dependence 3 and driving power 8 (ii) the number 5 barrier, with dependence 1 and driving power 7, and finally (iii) the number barrier 8 with dependence 1 and driving power 8.
We can conclude, in accordance with the ISM model analysis that the EEP barriers are positioned in the clusters I, II and III, meaning that they are closely linked and dependent upon each other. Should be noted that the barriers belonging to the cluster III have the binding function between cluster II and IV.
6. Results
6.1 Analysis of the ISM-Based Model
Replacing the numbers of the barriers by their designations it is possible to come to the representative flowchart of barriers to EEP as Figure 3. This model has returned to be reviewed by the same four experts who had the opportunity to comment on the consistency of the model, and how it relates to their professional and academic experience. Feedback from experts has been positive since all agreed on the relevance of the model and the usefulness of the information that stems from it.
Indeed, the structural model provides fruitful and informative connotations in terms of public policy. A simple measure of "introduction of procurement programs within the Public Administration", directed to start-ups, would bring enormous benefits to all EEP, given that the absence of these programs is the basis of all other barriers that affect their efficiency. According to this model, which is consistent with the literature (Connel, 2006; Mazzucato, 2013; Yanchao & Georghiou, 2015) this kind of programs would lead in the Portuguese case, to the capital increase to finance the start-up and business growth and, moreover, increase the number of growth companies. These would be the direct and immediate effect.
In turn, the increased of capital lead to improved access to corporate networks and contacts and therefore lead to an increase of successful cases within the EEP. The increase in successful cases would make the entrepreneurship education programs more appeal, given that decision-makers would be led to understand the dynamics of important business creation for the increase of wealth and society welfare. On the other hand, it is essential to intervene at the level of transparency and predictability of the legislative and regulatory environment. This is an independent barrier that is at the base of the system. If we act in this barrier, we will once again affect the amount of capital available to finance the start-up and business growth, and consequently, all other adjacent barriers aforementioned. The level of involvement of large companies in the EEP, this is only possible if all the barriers mentioned above are reduced. Denotes that the involvement of large companies has an effect of feedback on these barriers. Finally, the psychological and cultural restrictions on access to the business activity and the low level of self-efficacy and entrepreneurial ambition, are not barriers in itself, but a mirror of an ecosystem clogged with serious efficiency problems. People are risk averse to launch new businesses, because the EE is unable to support and motivate. As regards the specific role of the barrier "limited number of entrepreneurship education programs", it also proved to be an independent barrier, i.e., it depends on few barriers but with strong power of influence on the EE. This barrier can be reduced through public incentives to the introduction of these programs in the curriculum, and would have direct effects on the emergence of high growth companies (commonly known as gazelles) which, in turn, lead to the involvement of large companies in the EE decreasing, by this means, the psychological and cultural restrictions on access to the business activity and the low level of self-efficacy and entrepreneurial ambition. On the other hand, increasing the number of entrepreneurship education programs would lead to an increased number of successful cases in EEP which, in turn, would contribute for improving the access to networks and business contacts, and finally, increased capital to fund the creation of more businesses. Education barrier does not only affect procurement programs and the lack of transparency and predictability of the legislative and regulatory environment, which resolution is exclusively in the decision-making sphere of political power and legislative.
7. Conclusions
The ISM provides an orderly and directional structure to complex problems and to decision makers a realistic picture of the EEP, the main barriers that involves their range level and the direction in which they influence each other.
The ISM process can thus transform mental models of complex systems uncertain and poorly articulated in visible models to help understand the positioning and the interactions between the barriers of EEP.
It also allows you to find the key factors related to the problem in question that in this case, are independent barriers whose resolution depends on political will, in particular expressed in the creation of procurement programs, transparency and predictability of the legislative and regulatory environment and also in the introduction of entrepreneurial education programs more widely in school and university curricula. These three barriers are the basis of the national EE inefficiency; its elimination would lead to increased momentum in the start-up financing and business growth developed by start-ups, emergence of successful cases, involvement of large companies and the emergence of an entrepreneurial culture and business ambition.
The ISM method is understandable for a variety of users from different interdisciplinary groups and a great way to integrate the different perceptions of the participating groups. It is able to handle a large number of components and typical relationships of complex systems and has unique heuristic capabilities in terms of evaluation and subsequent adequacy to the studied model.
However, some limitations of a methodological nature are you mentioned, such as the fact that the final model presented by the ISM is not a statistically validated model, or his own limited graphical representation capacity, which does not foresee the introduction of other significant variables, which also affect the system.
REFERENCES
Aldrich, H., & Zimmer, C. (1986). Entrepreneurship Through Social Networks, in Sexton D L and Smilor R W (Eds.), The art and science of entrepreneurship, (3-23). Cambridge: MA, Ballinger.
Auerswald, P. P. (2015). Enabling Entrepreneurial Ecosystems. Insights from Ecology to Inform Effective Entrepreneurship Policy. Ewing Marion KAUFFAM Foundation. [ Links ]
Banha, F. (2001). Capital de Risco- Os Tempos estão a mudar. Lisboa: Editora Bertrand. [ Links ]
Chen, C. C., Greene, P. G., & Crick, A. (1998). Does Entrepreneurial Self-efficacy Distinguish Entrepreneurs from Managers? Journal of Business Venturing, 13(4), 295-316. [ Links ]
Connel, D. (2006).”Secrets” of The World´s Largest Seed Capital Fund: How the United States Government Uses its Small Business Innovation Research (SBIR) Programme and Procurement Budgets to Support Small Technology Firms. Centre for Business Research, University of Cambridge. [ Links ]
Entezari, Y. (2015). Bulding Knowledge-Based Entrepreneurship Ecosystems: Case of Iran, Procedia Social and Behavioral Sciences, 195, 1206 - 1215. [ Links ]
European Commission. (2006). Aplicar o Programa Comunitário de Lisboa: Promover o espírito empreendedor através do ensino e da aprendizagem. Comunicação da Comissão ao Conselho, ao parlamento Europeu, ao Comité Económico e Social Europeu e ao Comité das regiões. Brussels: European Commission. [ Links ]
European Commission by PwC, ICF GHK, & Ecorys (2014). SMEs' access to public procurement markets and aggregation of demand in the EU. Brussels: European Commission. [ Links ]
Eurydice (2016). Entrepreneurship Education at School in Europe. Education and Training. Eurydice Report. [ Links ]
Fuerlinger, G., Fandl, U., & Funke, T. (2015). The role of the state in the entrepreneurship ecosystem: insights from Germany. Triple Helix, a Springer Open Journal 2(3). [ Links ]
Henrekson, M., & Johansson, D. (2010). Gazelles as job creators: a survey and interpretation of the evidence. Small Business Economics, 35, 227-244. [ Links ]
Hocherts, K., & Wüstenhagen, R. (2010). Greening Goliaths versus emerging Davids - Theorizing about the role of incumbents and new entrants in sustainable entrepreneurship. Journal of Business Venturing, 25, 481-492. [ Links ]
Isenberg, D. (2011a). The Entrepreneurship Ecosystem Strategy as a New Paradigm for Economic Policy: Principles for Cultivating Entrepreneurship. The Babson Entrepreneurship Ecosystem Project. [ Links ]
Isenberg, D. (2011b). When big companies fall, entrepreneurship rises. Harvard Business Review. January 4, 2016, Retrieved from https://hbr.org/2013/03/when-big-companies-fall-entrep/ [ Links ]
Jacob, P.G., & Pramod, V.R. (2014). An interpretive structural model (ISM) analysis approach in steel re rolling mills (SRRMS). International Journal of Research inEngineering & Technology, 2(4), 161-174. [ Links ]
Jain, R., & Ali, S. W. (2013). A review of facilitators, barriers and gateways to entrepreneurship: directions for future research. South Asian Journal of Management, 20 (3), 122-163. [ Links ]
Jayant, A., Azhar, M., & Singh, P. (2014-2015). Interpretive Structural Modeling (ISM) Approach: A State of the Art Literature. International Journal of Research in Mechanical Engineering & Technology, 5, 15-21. [ Links ]
Kouriloff, M. (2000). Exploring Perceptions of A Priori Barriers to Entrepreneurship: A Multidisciplinary Approach. ET& P - Entrepreneurship Theory and Practice, 59-79. Baylor University. [ Links ]
Mason, C., & Brown, R. (2010). High Growth Firms in Scotland. Scottish Enterprise, Glasgow.
Mason, C., & Brown, R. (2013). Entrepreneurial ecosystems and growth oriented entrepreneurship. Background paper prepared for the workshop organised by OECD LEED programme and the Dutch Ministry of Economic Affairs on Entrepreneurial Ecosystems and Growth Oriented Entrepreneurship, The Hague, Netherlands, 7th November 2013.
May, J., & Liu, M. M. (2015). Angels without Borders. Trends and Policies Shaping Angel Investment Worldwide. Kindle Edition. [ Links ]
Mazzucato, M. (2013). The entrepreneurial state: debunking public vs private sector myths. Anthem Press. [ Links ]
Napier, G. & Hansen, C. (2011). Ecosystems for Young Scalable Firms. FORA Group [ Links ]
OCDE (2013). Entrepreneurial Ecosystems and Growth-Oriented Entrepreneurship. Summary Report of an International Workshop, organized by the OCDE and the Netherlands Ministry of Economic Affairs. The Hague, 7 November 2013. [ Links ]
OECD/European Commission. (2013). The missing Entrepreneurs: policies for inclusive entrepreneurship in Europe. Paris: Organization for Cooperation and Development Publishing. [ Links ]
Ostgaard, T.A., & Birley, S. (1996). New Venture Growth and Personal Networks. Journal of Business Research, 36(1), 37-50. [ Links ]
Raeesi, R., Dastranj, M., Mohammadi, S., & Rasouli, E. (2013). Understanding the Interactions among the Barriers to Entrepreneurship Using Interpretive Structural Modeling. International Journal of Business and Management, 8 (13), 56-72. [ Links ]
Sage, A. (1977). Interpretive Structural Modelling: Methodology for Large-scale Systems. New York, NY: Mc Graw-Hill, 91-164. [ Links ]
Sharma S. K., Panda B. N., Mahapatra S. S. & Sahu, S. (2011). Analysis of barriers for reverse logistics: an Indian perspective. International Journal Model Optim, 1(2), 101-106. [ Links ]
Singh, R. (2000). Entrepreneurial Opportunity Recognition Through Social Networks. Melbourne: Macmillan Education [ Links ]
Startupinvestorsmanifesto.eu. (2014). Monitoring mechanism a committee formed of representatives of the three main investment groups hereby reflected (early stage venture capital funds, business angels and crowdfunding). Retrieved from http://startupinvestorsmanifesto.eu/manifesto/manifesto.pdf [ Links ]
Van de Ven, A. H., Hundson, R., & Schroeder, D. M. (1984). Designing New Business Start-ups: Entrepreneurial, Organizational, and Ecological Considerations. Journal of Management, 10(1), 87-107. [ Links ]
Warfield, J. W. (1973). Binary Matrices in System Modeling. IEEE Transcript on Systems, Men & Cybernetics, vSMC-3 5, 441-448. [ Links ]
Yanchao, L., & Georghiou, L. (2015). Signaling and accrediting new technology: Use of procurement for innovation in China. Science and Public Policy. Retrieved from http://www.ipcsit.com/vol45/045-ICIKM2012-M10008.pdf [ Links ]
Acknowledgements
This paper is financed by National Funds provided by FCT- Foundation for Science and Technology through project UID / SOC / 04020/2013.
Received: 16.05.2016
Revisions required: 10.07.2016
Accepted: 17.11.2016


